
Analysis And Optimizationofin1-xgaxasysb1-ythermophotovoltaiccellsunderlowradiatortemperatures
15
0
0
Texte intégral
(2) F. Bouzid et al.. J Fundam Appl Sci, 2013, 5(1), 81-95. 82. The radiator, generally made by refractory materials such as Tungsten [2] or ceramic oxides [3], may be heated by the ignition of a fuel, highly concentrated sunlight or by using radioisotopic power sources [4] as described in figure 1.. Fig.1. Principle of RTPV conversion. A TPV system powered by radioisotope decay, as an alternative source of power, is a potential power system used in current deep space satellites, where the solar radiation energy density is too low for a conventional PV power system to be used [5]. In order to make the process efficient, the energy of the photons reaching the PV cell must be superior to the bandgap energy. Thus, In1-xGaxAsySb1-y quaternary alloys have been considered as promising materials for TPV applications because they have the advantage of large range of energy gaps from 0.29ev to 0.72ev when they are lattice matched with GaSb or InAs wafers [5]. These cells are able to convert a larger part of the infrared spectrum, and therefore have the potential to give high efficiency and power output at low temperature radiators.To increase the efficiency which is determined by energy absorbed relative to total incoming radiation, the remainder of the spectrum must be reflected back to the radiator. Thereby a back surface reflector (BSR) is often employed in the design of conventional TPV cells. This creates the concept of “photon recycling” whereby photons with energies less than optimum for conversion are sent back to the radiator for recycling until they come back at the proper energy [6]. For efficient RTPV conversion, the radioisotope source need a number of important requirements such as: high temperature of the heat source, decays without too much gamma or neutron emission, a long half-life of several years or decades so that extended missions are supported and high decay energy per isotope mass. Some current RTPV systems use isotope as a heat source since, in a pure form,. 238. Pu. 238. Pu can reach surface temperature of 1300°k. [7], others uses 238PuO2 with molybdenum multi-foil insulations which can withstand hot side.
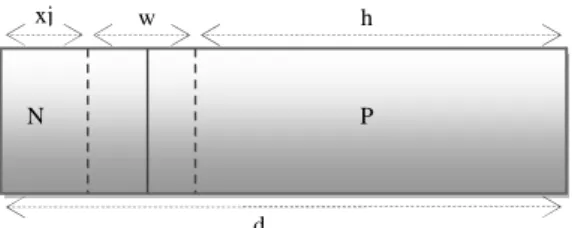
(3) F. Bouzid et al.. J Fundam Appl Sci, 2013, 5(1), 81-95. 83. temperature up to 1500°k [5,8]. However, recently published works show that the 90Sr isotope meets all the above mentioned requirements [9]. The current TPV cell technology is approaching 30% cell efficiency at 300°k due steady improvement in MOCVD manufacturing process. Through the use of dual junction cells to convert below bandgap photons, further improvements in the cell efficiency are expected to take place over the next few years with expectations of approaching 40% [10]. Relatively little work has been done to perform the design and structure optimization of In1xGaxAsySb1-y. TPV cells because of the insufficient knowledge of device related parameters.. Therefore, the underlying goal of this work is to establish an analytical model to enhance the qualitative understanding of the electro-optical behavior of In1-xGaxAsySb1-y TPV cells, following the classical ideal diodes equation taking account of the photons with energy below the cells bandgap and without accounting for the effect of series resistance. For that reason, the theoretical efficiency of In0.2Ga0.8As0.18Sb0.82 cells, exposed to radiation from a blackbody radiator in the 1100°k to 1300°k temperature range, is computed and the influences of the base region doping profile, the cell thickness, the surface recombination velocity, the radiator emissivity and the cell temperature on the conversion efficiency have been investigated in order to find an optimum energy conversion system.. 2. MODEL DESCRIPTION Figure 2 show a simplified structure of our TPV cell object, where xj is the junction depth, w is the depletion region width, h is the P-type quasi neutral region and d is the cell thickness. xj. w. h. N ’. P. d. Fig.2. Simplified configuration of the In1-xGaxAsySb1-y TPV cell. In our calculations, the effect of the back surface field (BSF) is not taken into account for the sake of simplicity, no structural losses and contact shadowing for the cells and the values of the physical and geometrical parameters were chosen from various published papers.. 3. ANALYTICAL MODEL.
(4) F. Bouzid et al.. J Fundam Appl Sci, 2013, 5(1), 81-95. 84. The determination of the TPV cell efficiency implies knowledge of its current voltage characteristic under illumination which can be written as [11]:. I Total I Ph I D. (1). Where ID is the dark current (in the absence of irradiation), and IPh is the current excited by the incident radiations, i. e., the photocurrent for the so-called ideal model. The dark current is described by the Shockley diode equation: I. D. I0. . qv exp kT 1. (2). Where q is the elementary charge, K is the Boltzmann constant, T is the temperature and I0 is the reverse saturation current, given by equation (3) [11], using the cell design shown in figure 2:. I0 . qSD e n le N a. 2 i. sele h cosh( ) sinh( De le sele h sinh( ) cosh( De le. shlh h xj ) cosh( ) sinh( 2 le qSD h n i Dh lh shlp h lh N d xj ) sinh( ) cosh( le Dh lh. xj ) lh xj ) lh. (3). Where ni is the intrinsic carrier concentration calculated from the relation: n i2 N c N v exp( . Eg ) kT. (4). Where Nc and Nv are the effective densities of states in the conduction and valence bands respectively, Eg is the bandgap energy, Na and Nd are the acceptor and donor concentrations, Sh and Se are the recombination velocities in the N and P-type regions, S is the cell surface, De and Dh are the diffusion constants of electrons and holes respectively, calculated from Einstein relationship: D. e/h. . kT µ q. e/h. (5). Where µ e and µ h are mobilities of the electrons and holes respectively, le and lh are the minority carrier diffusion lengths of electrons and holes respectively. The photocurrent Iph is given by the sum of the photocurrents generated in the emitter, the base and the depleted region of the cell. λmax. I Ph . q S Fλ SR λ dλ. (6). 0. Where λ is the wavelength of the incident photon, λmax is the cutoff wavelength corresponding to the bandgap energy, and SR(λ) is the internal spectral response of the TPV cell given by.
(5) F. Bouzid et al.. J Fundam Appl Sci, 2013, 5(1), 81-95. 85. the sum of the contribution from the emitter, the base and the depleted region as described in equation (7):. SRλ SRE λ SRB λ SRDR λ. (7). F(λ) is the spectral photons flux of the incident radiation that was absorbed by the TPV cell. Its expression for λ < λmax could be written as [12,13]: F λ χ . 2π c hc λ 4 e λkTRad 1 . (8). Where TRad is the TPV radiator temperature, h is the plank constant, c is the speed of light and χ is the effective cavity emissivity that characterizes the performance of the spectral control in TPV system. The value of χ is taken as 0.78 based on the best reported spectral control system performance.. 4. PHOTOVOLTAIC PARAMETERS The open circuit voltage is expressed as [11]: Voc . nkT Cell q. I ln sc 1 I0 . (9). Where n is the factor of ideality assumed to be 1, Isc is the short circuit current, and TCell is the cell temperature. The power delivered by the cell is given by the product of the cell voltage and current, and was maximized by satisfying the condition: d(I. V). Total. dI. 0. (10). The fill factor is defined by: FF . Im Vm I sc v oc. (11). Where Im and Vm are coordinates of the maximum power point. The overall conversion efficiency of a TPV system, supposing that no resistive losses, can be expressed as [14]: η. I sc V oc FF PInc - PRet. (12). Where PInc is the total incident radiation power integrated over all frequencies and PRet is the power returned to the radiator, since photons not absorbed are able to be recycled..
(6) F. Bouzid et al.. J Fundam Appl Sci, 2013, 5(1), 81-95. 86. InGaAsSb parameter equations W. Chan et al. [15] suggested a semi empirical equation for the temperature dependence of the bandgap energy of the form: Eg 0.5548 1.952 10 4 T 300 . (13). The Mobility of both electrons and holes is calculated as a function of doping and temperatures using the Caughey – Thomas empirical model [16] given as: μ e 420 μ. h. 110 . 8500 1 [ N a 5 10 1 [N. d. 500 9 10. 17. 17. ] 0.7 ] 0.66. (14) (15). The absorption coefficient of In1-xGaxAsySb1-y was calculated using the direct bandgap semiconductor expression given as [17]. α(E) A 0. E Eg. (16). Where A0 = 2.6 [µm-1 ev-0.5], and E is the incoming photon energy. The equation relating the relative dielectric constant of In1-xGaxAsySb1-y to the mole fraction x is given by [18]: ξr = 15.3 + 0.4 × x. (17). The effective masses for electrons and holes are given by the expressions [19]: me*= (0.022 + 0.03×x - 0.012×x ²) × m0. (18). mh*= (0.41 + 0.16×x + 0.023×x ²) × m0. (19). Where m0 is the electron rest mass. The effective densities of states Nc and Nv are given in [19] as: Nc= 4.82×1015× (0.022 + 0.03×x - 0.012×x²)1.5 × t1.5. (20). Nv= 4.82×1015× (0.41 + 0.16×x + 0.23×x²)1.5 × t1.5. (21). 5. INCIDENT LIGHT SPECTRUM Figure 3 gives a general idea of how much light is accessible to a PV cell made of In1xGaxAsySb1-y.. The colored portions in the figure indicate the fraction of the photon spectrum. that is above the bandgap energy. Table 1 below indicates the fraction of incident light with energies below the cell’s bandgap calculated by integrating the spectral irradiance under the blackbody curve for λ > λ max, and the total incident radiation power PInc..
(7) F. Bouzid et al.. J Fundam Appl Sci, 2013, 5(1), 81-95. 87. Fig.3. Blackbody spectral irradiance for χ = 0.78. Table 1. Percentage of incident radiations with energies below the In1-xGaxAsySb1-y bandgap for χ = 0.78, and the total incident radiation power PInc. TRad (°k) 1100 1200 1300 Returned power (%) 81.63 76.57 71.52 6.39 9.08 12.53 PInc(w/m²). 6. RESULTS AND DISCUSSION Effect of the base region profile and cell thickness The level of doping plays a crucial role in the performance of TPV devices. To reveal the potential effect brought by the base region doping profile, we have simulated and plotted the conversion efficiency versus different doping levels in figure 4. The analysis starts by assuming the values assigned for the cell parameters, presented in Table 2. Table 2. Cell parameters used in simulations for TCell = 300°k and TRad = 1200°k. Eg [ev] 0.55. Nd [cm-3] 2e18. τe [µs] 1. τh [µs] 1. Se Sh [cm/s] [cm/s] 1000 700. χ 0.78. S [cm²] 1. Where τe and τh are electron and hole minority carrier lifetimes respectively.. xj [µm] 0.3.
(8) F. Bouzid et al.. J Fundam Appl Sci, 2013, 5(1), 81-95. 88. Fig.4. Effect of the base region profile and cell thickness on the conversion efficiency.. It can be seen from Figure 4 above that the maximum value of the base region doping concentration is about 2e19 cm-3. At the same time, it is clear that the efficiency increases significantly with increasing the cell thickness. Where, In case of Na = 2e19 cm-3, the efficiency curve shows an improvement from 24.04% to 26.51% for 3µm and 7µm cell’s thickness respectively for the reason that, in case of thin thickness, most of the incident photons are not absorbed resulting in a lower efficiency. However, when the cell thickness exceeds 7µm, we note a weak reduction in the conversion efficiency due to the recombination phenomenon, since the free carriers generated deeper in the bulk have to travel longer before being collected. So a cell thickness of about 7µm is needed to lose not too much of the efficiency.. Effect of the front recombination velocity In this work, the back surface recombination velocity was fixed at 2000 cm/s, and the influence of the front recombination velocity on the conversion efficiency has been simulated, where values of 700, 1000 and 2000 cm/s was used for different cell thicknesses with TRad = 1200 °k, TCell = 300 °k, Na = 2e19 cm-3and χ = 0.78 . From figure 5 below, it is apparent that the efficiency drops notably with increasing the front recombination velocity, since most of the photo-generated carriers cannot be collected by the electrodes what implies a low electric current. The maximum conversion efficiency obtained for 7µm cell thickness can attain 26.51% for a front recombination velocity equals to 700.
(9) F. Bouzid et al.. J Fundam Appl Sci, 2013, 5(1), 81-95. 89. cm/s. Therefore, to reduce the power loss, the front surface recombination velocity should not exceed 700 cm/s.. Fig.5. Effect of the front surface recombination velocity and cell thickness on the conversion efficiency. The obtained results are very similar to those obtained by Bermel P. et al. [20] and Waits C. M. [21]. They simulated the conversion efficiency of In1-xGaxAsySb1-y TPV cells for 1200°k radiator temperature and they obtained efficiencies of 26.9% and about 26% respectively. However, Dashiell M. W et al. [17] have calculated the conversion efficiency of In1xGaxAsySb1-y. TPV cells by employing PC-1D software and they obtained 28% for a radiator. temperature of 1223°k at ambient temperature. We believe that the obtained results agree well and the differences in efficiency results can be partly attributed to the difference in parameter formulas used. All formulas seek to duplicate results from actual measurements. Therefore, all formulas are approximations only and it is difficult to state which formula is more correct.. Effect of the radiator effective cavity emissivity The radiator exhibits a high emissivity in the spectral range usable for the PV cell, and a low emissivity elsewhere. The emissivity of Tungsten and ceramic oxides based on Erbium and Ytterbium, frequently used in TPV systems, is around 0.6, however the emissivity of SiC range from 0.7 to 0.94 depending on author and measurement methodology [5]. Therefore, it is interesting to evaluate the average emissivity-dependant effect on the practical device performance..
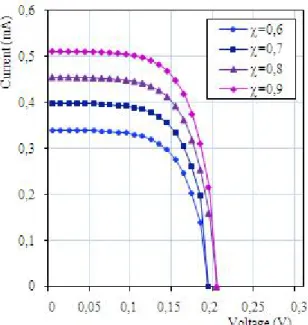
(10) F. Bouzid et al.. J Fundam Appl Sci, 2013, 5(1), 81-95. 90. In figure 6, we have simulated the current - voltage characteristics as a function of χ, while Table 3 gives the computations of the open circuit voltage, short circuit current, fill factor and the conversion efficiency for all cases of the radiator effective emissivity with TRad = 1200°k, TCell = 300°k, Na = 2e19 cm-3.. Fig.6. Simulated current-voltage characteristics for different values of the effective emissivity. Table 3. Effect of the radiator emissivity on the photovoltaic parameters. χ Voc (V) Isc (mA) FF (%) η (%). 0.6 0.194 0.34 63.24 25.14. 0.7 0.198 0.40 63.89 25.61. 0.8 0.201 0.45 64.27 27.05. 0.9 0.204 0.51 64.44 27.11. It is seen, from the table and the figure above, that the efficiency improves from 25.14% for χ= 0.6 to 27.11% for χ = 0.9. Both open circuit voltage and the fill factor show little increment with the evolution of χ, whereas, the remaining parameters displays important improvements. So in order to achieve high conversion efficiency, it is important that the radiator has a high emissivity. Effect of the radiator temperature.
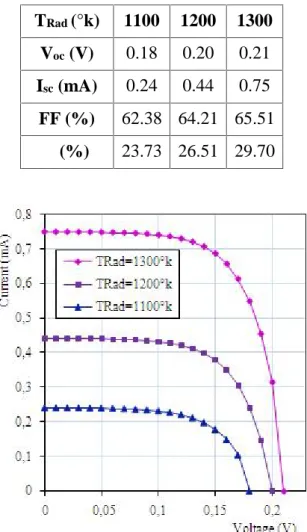
(11) F. Bouzid et al.. J Fundam Appl Sci, 2013, 5(1), 81-95. 91. We simulated the current-voltage characteristic under three types of blackbody illumination spectrums with TCell = 300°k, Na = 2e19 cm-3, χ = 0.78, and the results were shown in figure 7. Table 4 shows that the efficiency improves from 23.73% to 29.70% for 1100°k and 1300°k radiator’s temperature respectively. Table 4: Effect of the radiator temperature on the photovoltaic parameters.. TRad (°k). 1100. 1200. 1300. Voc (V). 0.18. 0.20. 0.21. Isc (mA). 0.24. 0.44. 0.75. FF (%). 62.38 64.21 65.51. η (%). 23.73 26.51 29.70. Fig.7. Simulated current - voltage characteristics under three blackbody illumination spectrums. This improvement can be explained by taking into account that the increase in the radiator’s temperature involves a significant increase in photocurrent for the reason that, as we saw in equation (6), the photocurrent is practically proportional to luminous flow, and owing to the fact that the open circuit voltage is also related to the short circuit current, it will undergo an increase and the conversion efficiency is always better in case of 1300°k radiator’s temperature..
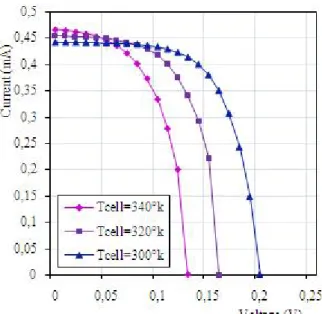
(12) F. Bouzid et al.. J Fundam Appl Sci, 2013, 5(1), 81-95. 92. Effect of the cell temperature As it is not realistic to operate a TPV cell at 300°K, we have simulated the effect of elevated operating temperatures on the performance of the converter for Na = 2e19 cm-3 and χ = 0.78, under three types of blackbody illumination spectrums. According to the results represented in Table 5 and the figure 8 below, it is seen that the increase of the cell’s temperature causes a reduction in the bandgap width, therefore, the reverse saturation current will increase, causing a reduction in the open circuit voltage, and the mechanism of carrier’s production becomes increasingly significant what implies a weak increase in the short circuit current.. Fig.8. Simulated current-voltage characteristics for different cell temperatures for TRad = 1200°k. Table 5: Effect of the cell temperature on the photovoltaic parameters. TRad (°k) TCell (°k) Eg (ev) I0 (A) Voc (V) Isc (mA) FF (%) η (%). 300 0.555 1.91e-7 0.20 0.44 64.21 26.51. 1200 320 0.551 1.02e-6 0.17 0.45 59.05 20.99. 340 0.547 4.53e-6 0.14 0.47 52.91 15.63.
(13) F. Bouzid et al.. J Fundam Appl Sci, 2013, 5(1), 81-95. 93. It may be seen also that the fill factor undergoes a reduction with the increase of the cell’s temperature following the increase in the dark saturation current, and owing to the fact that the reduction in the open circuit voltage is more significant with respect to the increase of the short circuit current, the conversion efficiency will also decrease.. 7. CONCLUSION In this study, we have improved a comprehensive model to predict the performance of an In1xGaxAsySb1-y. TPV converter heated by radio-isotopic source using a simulation program. designed for this reason. Our results indicate that in order to achieve higher conversion efficiency, it is important to keep the base region doping as high as possible. Moreover, a cell thickness of about 7µm with low front recombination velocity is privileged to not contribute significantly in recombination. It was found also that the conversion efficiency depends not only on the quality of the PV cell itself, but also on other external conditions as the specter quality, which depends strongly of the radiator emissivity and temperature. Our study proves that the spectrums of radiators operating at 1300°k, for an emissivity value of 0.78, contain significant proportion of incident radiations with energies sufficient to generate charge carriers in the PV cell and efficiencies exceeding 29% have been achieved by considering the cell’s reflectance to the radiations with energy below the cell’s bandgap. The obtained results are found to be in good agreement with the available data. In addition, we have analyzed the effect of elevated cell operating temperature on the conversion efficiency and we found that the increase of the cell temperature results a degradation of their performances.. 8. REFERENCES [1] Luque. A and Hegedus. S. 2003, Handbook of photovoltaic science and engineering, John Wiley & Sons, England. [2] Andreev V. M, Vlasov A. S, Khvostikov V. P, Khvostikova O. A, Gazaryan P. Y, Sorokina S. V, Sadchikov N. A, Solar thermophotovoltaic convertors based on tungsten emitters, J. Sol. Energy Eng. – Trans. ASME, 2007: 129, pp. 298-303. [3] Licciulli A, Diso D, Torsello G, Tundo S, Maffezzoli A, Lomascolo M, Mazzer M, The challenge of high-performance selective emitters for thermophotovoltaic applications, Semiconductor Science and Technology. 2003: Vol. 18, pp. 174-183..
(14) F. Bouzid et al.. J Fundam Appl Sci, 2013, 5(1), 81-95. 94. [4] Donald L. Chubb. 2007, Fundamentals of thermophotovoltaic energy conversion, First Edition, Elsevier. [5] Bauer. T. 2011, Thermophotovoltaics Basic principles and critical aspects of system design, Springer. [6] Yang W. M, Chou S. K, Shu C, Li Z. W, Xue H, Research on micro-thermophotovoltaic power generators, Solar Energy Materials & Solar Cells, 2003: Vol. 80, pp. 95-104. [7] Malvadkar S. and Parsons E, Analysis of Potential Power Sources for Inspection Robots in Natural Gas Transmission Pipelines, Topical Report DE-FC26-01NT41155, National Energy Technology Laboratory, 2007:Accessed at: http://www.netl.doe.gov/technologies/oilgas/publications/td/parsons%20malvadkar%20rep ort.pdf. [8] Schock A, Mulcunda M, Or C, Kumar V, and Summers G, Design, Analysis, and Optimization of a Radioisotope Thermo-photovoltaic (RTPV) Generator, and its Applicability to an Illustrative Space Mission, Acta Astronautica, 1995: Vol. 37, pp. 21-57. [9] Kovacs A.. and Janhunen P, Thermo-photovoltaic spacecraft electricity generation,. Astrophys. Space Sci. Trans., 2010: 6, pp. 19-26. [10] Teofilo V. L, Choong P, Chang J, Tseng Y. L. and Ermer S, Thermophotovoltaic Energy Conversion for Space, The journal of physical chemistry, C, 2008: Vol. 112, pp. 78417845. [11] Sze S. M. and Ng K. K. 2006, Physics of Semiconductor Devices, Third Edition, John Wiley, Interscience. [12] Wang Y, Chen N. F, Zhang X. W, Huang T. M, Yin Z. G, Wang Y. S, Zhang H, Evaluation of thermal radiation dependent performance of GaSb thermophotovoltaic cell based on an analytical absorption coefficient model, Solar Energy Materials & Solar Cells, 2010: Vol. 94, pp. 1704-1710. [13] Peng X, Guo X, Zhang B, Li X, Zhao X, Dong X, Zheng W, Du G, Numerical analysis of the. short-circuit current density in GaInAsSb thermophotovoltaic diodes, Infrared. Physics & Technology, 2009: Vol. 52, pp. 152-157. [14] Lal N. N. and Blakers A. W, Sliver Cells in Thermo-photovoltaic Systems , Solar Energy Materials & Solar Cells, 2009: Vol. 93, Issue 2, pp. 167-175, Feb. [15] Chan W, Huang R, Wang C, Kassakian J, Joannopoulos J and Celanovic I, Modeling low-bandgap thermophotovoltaic diodes for high-efficiency portable power generators, Solar Energy Materials & Solar Cells, 2010: Vol. 94, pp. 509-514..
(15) F. Bouzid et al.. J Fundam Appl Sci, 2013, 5(1), 81-95. 95. [16] Wang C. A, Choi H. K, Oakley D. C, and Charache G. W, Expressions fit from mobility data of InGaAsSb layers grown on insulating GaAs substrates given in C.A., J. Cryst. Growth, 1998: vol. 195, no. 1–4, pp. 346. [17] Dashiell M. W, Beausang J. F, Ehsani H, Nichols G. J, Depoy D. M, Danielson L. R, Talamo P, Rahner K. D, Brown E. J, Burger S. R, Fourspring P. M, Topper W. F, Baldasaro P. F, Wang C. A, Huang R. K, Connors M. K, Turner G. W, Shellenbarger Z. A, Taylor G, Li J, Martinelli R, Donetski D, Anikeev S, Belenky G. L. and Serge Luryi, Quaternary InGaAsSb Thermophotovoltaic Diodes, IEEE Transactions On Electron Devices, 2006: Vol. 53, No. 12, December. [18] Mikhailova. M. P. 1999, Handbook Series on Semiconductor Parameters, vol. 2, World Scientific, London, pp. 180-205. [19] Ioffe Physico - Technical Institute: http://www.ioffe.ru/SVA/NSM/Semicond/GaInAsSb/basic.html [20] Bermel P, Ghebrebrhan M, Chan W, Yeng Y. X, Araghchini M, Hamam R, Marton C. H, Jensen K. F, Soljacic M, Joannopoulos J, Johnson S. G. and Celanovic I, Design and global optimization of high efficiency thermophotovoltaic systems, Optics Express, 2010: Vol. 18, No. 103, September. [21] Waits. C. M, Thermophotovoltaic energy conversion for personal power sources, Army Research Laboratory – Adelphi, MD 20783-1197, ARL-TR-5942, February 2012.. How to cite this article Bouzid F and Maamri N. Analysis and optimization of in1-xgaxasysb1-y thermophotovoltaic cells under low radiator temperatures. J Fundam Appl Sci. 2013, 5(1), 81-95..
(16)
Figure

+2
Documents relatifs
TABLE I: Summary of results; ε denotes the reconstruc- tion efficiency and ε tot the total efficiency including daugh- ter branching fractions, both in percent; N is the number
Abstract.- The dependences on temperature of superconducting materials bulk samples were measured using the continuous - flow helium cryostat developed in Research Institute
L’archive ouverte pluridisciplinaire HAL, est destinée au dépôt et à la diffusion de documents scientifiques de niveau recherche, publiés ou non, émanant des
present up to both ends of the studied temperature range. The results can be qualitatively interpreted as the consequence of a third order anharmonic coupling between strains and
utilisées comme « bloc-notes visuels » (Colleyn, 1993) ont constitué un outil précieux pour la description des différents acteurs en présence, de leurs pratiques et
Analysis and optimization of In1-xGaxAsySb1-ythermophotovoltaic cells under low radiatortemperatures
The results show that for an emissivity value of 0.78, a cell thickness of about 7µm with low front recombination velocity(700cm/s),a conversion efficiency greater than 29% can
YBa~CU~O~ film, on the associated heat production and of the temperature profile i,ia numerical integration of the Fourier equations (anisotropic case) from which the modified
Vapour pressures of ethylene glycol, hydroxyacetaldehyde and hydroxyacetone were measured by using a standard closed system equipped with a vacuum line, built
