HAL Id: hal-02017713
https://hal.sorbonne-universite.fr/hal-02017713
Submitted on 13 Feb 2019
HAL is a multi-disciplinary open access
archive for the deposit and dissemination of
sci-entific research documents, whether they are
pub-lished or not. The documents may come from
teaching and research institutions in France or
abroad, or from public or private research centers.
L’archive ouverte pluridisciplinaire HAL, est
destinée au dépôt et à la diffusion de documents
scientifiques de niveau recherche, publiés ou non,
émanant des établissements d’enseignement et de
recherche français ou étrangers, des laboratoires
publics ou privés.
Investigation of Intrinsically Disordered Proteins
through Exchange with Hyperpolarized Water
Dennis Kurzbach, Estel Canet, Andrea G. Flamm, Aditya Jhajharia,
Emmanuelle M. M. Weber, Robert Konrat, Geoffrey Bodenhausen
To cite this version:
Dennis Kurzbach, Estel Canet, Andrea G. Flamm, Aditya Jhajharia, Emmanuelle M. M. Weber,
et al..
Investigation of Intrinsically Disordered Proteins through Exchange with Hyperpolarized
Water. Angewandte Chemie International Edition, Wiley-VCH Verlag, 2017, 56 (1), pp.389-392.
�10.1002/anie.201608903�. �hal-02017713�
Investigation of Intrinsically Disordered Proteins through Exchange
with Hyperpolarized Water
Dennis Kurzbach,* Estel Canet, Andrea G. Flamm, Aditya Jhajharia, Emmanuelle M. M. Weber,
Robert Konrat, and Geoffrey Bodenhausen
Abstract: Hyperpolarized water can selectively enhance NMR signals of rapidly exchanging protons in osteopontin (OPN), a metastasis-associated intrinsically disordered protein (IDP), at near-physiological pH and temperature. The transfer of magnetization from hyperpolarized water is limited to solvent-exposed residues and therefore selectively enhances signals in
1H-15N correlation spectra. Binding to the polysaccharide
heparin was found to induce the unfolding of preformed structural elements in OPN.
I
ntrinsically disordered proteins (IDPs) constitute a class of physiologically active proteins that lack stable secondary and tertiary structures.[1] The highly dynamic nature of theseproteins endows them with an inherent ability to interact simultaneously with multiple binding partners in the cellular environment.[2] IDPs thus frequently constitute important
hubs in protein interaction networks. The malfunction of IDPs often leads to severe diseases associated with dereg-ulation of the cellular machinery.[3]Since intrinsically
disor-dered proteins or regions constitute approximately 30% of the human proteome,[4]understanding their functionality and
structure–function relationships is clearly desirable, especially with a view to developing novel therapeutic strategies for the treatment and prevention of diseases related to IDP mal-function.[5]
The inherent dynamics and flexibility of IDPs explain their astonishingly rich interactome. Nuclear magnetic reso-nance (NMR) spectroscopy has developed into a key method for the study of IDPs.[6] Multidimensional techniques and
high-field NMR spectrometers give access to residue-resolved dynamics of IDPs at ambient temperature and low pH.[7]
However, under physiological conditions, the spectra
typi-cally suffer from strong signal overlap and broadening, thus leading to peak intensities below the detection threshold.[8]To
the best of our knowledge, only one study has been published so far that employs1H-15N correlation spectra of IDPs under
physiological conditions at pH 7.4 and 3788C.[9]
These limitations in the study of IDPs can be overcome by using hyperpolarized HDO[10]produced through dissolution
dynamic nuclear polarization (D-DNP).[11]Because exchange
between hyperpolarized HDO and amide HNprotons only
enhances a limited set of solvent-exposed residues under near-physiological conditions,[8]the1H-15N correlation spectra
are sparse and can be assigned despite the poor dispersion of their chemical shifts.[12]Such sparse spectra are reminiscent of
“spectral dilution” techniques that rely on 13C labelling of
selected amino acids.[13]Felli and co-workers have advocated
the use of 13C direct detection techniques that allow the
observation of IDPs under physiological conditions in13C-15N
correlation spectra but do not show any proton signals, which are the object of our work.[14]
Osteopontin (OPN, Figure 1a) is a cancer- and metastasis-associated IDP that can interact with heparin, an analogue of the natural ligand hyaluronic acid (HA).[15]By using
hyper-polarized HDO to selectively observe residues that undergo fast exchange with the solvent, it is possible to follow the structural and dynamical adaptions of OPN induced by binding to heparin at pH 7.4 and 3788C.
To hyperpolarize water, we employ dissolution DNP (D-DNP).[16] A volume of 100 mL of a 20 mm solution of
4-hydroxy-2,2,6,6-tetramethylpiperidin-1-oxyl (TEMPOL) in H2O, mixed 1:1 (v/v) with glycerol as a glass-forming solvent,
is frozen at 1.2 K in a magnetic field of 6.7 T. Microwave irradiation near 188.2 GHz on resonance with the para-magnetic centers leads to hyperpolarization P(1H) = 89% in
the glassy solid.[10a] The 200 mL hyperpolarized solid are
rapidly dissolved by a burst of 5 mL (25-fold dilution) preheated D2O (18088C, 10.5 bar) and transported in
approx-imately 6 s through a magnetic tunnel to a suitably buffered protein solution that is waiting in a 5 mm NMR sample tube in a high-resolution 800 MHz NMR spectrometer. The protein solution was adjusted to pH 8 before dissolution, so that a near-physiological pH 7.5 is reached after dilution. The temperature of the sample was approximately 308 K (3588C) after mixing. Our approach is summarized in Figure 1b.[17]
The most exposed amide (HN) protons of the protein rapidly
exchange with the hyperpolarized HDO (after 40-fold dilution of H2O in D2O, most solvent protons are found in
the form of HDO), while non-exposed residues exchange slower. After a delay of 8 s to allow turbulence to settle, a band-selective optimized-flip-angle short-transient
hetero-[*] Dr. D. Kurzbach, E. Canet, A. Jhajharia, E. M. M. Weber, Prof. G. Bodenhausen
Departement de Chimie, Ecole Normale Sup8rieure PSL Research University, UPMC Univ Paris 06 CNRS, Laboratoire des Biomol8cules (LBM) 24 rue Lhomond, 75005 Paris (France) and
Sorbonne Universites, UPMC Univ Paris 06 Ecole Normale Sup8rieure, CNRS
Laboratoire des Biomol8cules (LBM), Paris (France) E-mail: kurzbach@ens.fr
A. G. Flamm, Prof. R. Konrat
Department of Structural and Computational Biology Max F. Perutz Laboratories, University of Vienna Vienna BioCenter Campus 5, 1030 Vienna (Austria) Supporting information for this article can be found under: http://dx.doi.org/10.1002/anie.201608903.
nuclear multiple-quantum correlation (15N-1H
SOFAST-HMQC) spectrum[18]was recorded in 19.2 s (see the
Support-ing Information).
Frydman and co-workers[19]have reported similar
experi-ments, although their 1H-15N correlation spectra do not
feature any resolved resonances of individual amino acids that would be amenable to assignment. By contrast, we show that it is possible to monitor the folding and unfolding of individual residues of an IDP induced by the presence of ligands like heparin under near-physiological conditions. After dissolution, the TEMPOL concentration drops below 0.25 mm. The lifetime of the HDO proton hyperpolarization is T1(1H) = 29 s, which is close to the value of HDO without
TEMPOL.
The average relaxation time T1(1HN) of amide protons in
OPN is on the order of 1 s,[20]but the proton polarization is
replenished by exchange as long as the HDO (which is approximately in 100-fold excess with respect to the protein) remains hyperpolarized. The proton signals must be detected before the polarization becomes too weak.
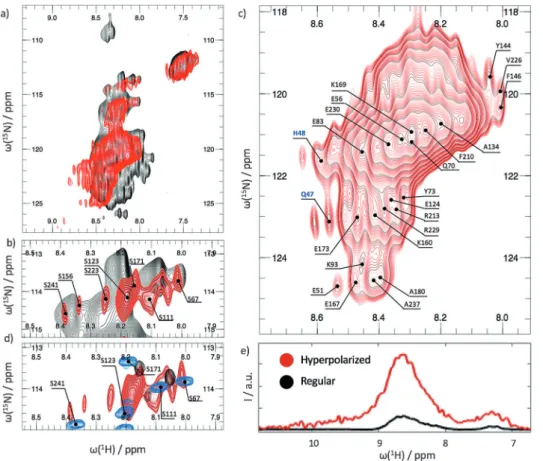
Figure 2a shows a SOFAST-HMQC using hyperpolarized HDO (red) obtained in less than 30 s compared with a regular SOFAST-HMQC spectrum (black) of the same sample obtained in thermal equilibrium over 18 h. Note that the peaks of the regular SOFAST-HMQC are very broad, as expected at pH 7.5 and 3588C.[8]IDPs generally give rise to
poorly dispersed peaks, and the signals are further broadened by fast proton exchange under our experimental conditions.[21]
Relaxation of the amide protons (HN) of OPN by TEMPOL is
negligible.[22]
In the red hyperpolarized spectrum in Figure 2a, we only see enhanced signals for the most labile HNprotons, which can
exchange rapidly with HDO.[8] The exchange rates are
estimated to be between 30–140 s@1at 3588C.
The probability that a hyperpolarized proton exchanges with OPN is at best 1/40 owing to the dilution of hyper-polarized protons with non-hyper-polarized protons and deuterons. Thus, for an exchange rate of 30 s@1and a recovery delay of
0.3 s (which was optimized empirically for our experiments), the probability to detect a hyperpolarized HNamide proton is
only about 25%. This probability rises for exchange rates near 140 s@1. Thus, only rapidly exchanging protons have a
suffi-ciently high probability to be detected, as displayed in Figure 2a.
Only residues that can exchange efficiently with the solvent on this time scale will be visible in our experiments, while residues that exchange more slowly will not be observed. The spectrum appears as if observed through a hyperpolarized exchange filter that suppresses1H-15N cross
peaks for protons that slowly exchange with the solvent. Additionally, many peaks appear in the hyperpolarized SOFAST HMQC that cannot be observed through other methods owing to weak signal intensity at pH 7.5 and 3588C. Thus, exchange with the hyperpolarized HDO boosts the magnetization of fast exchanging residues above the detection limit.
In Figure 2b, an expansion of the serine and threonine region is shown. Our method not only has the advantage that the signals are amplified, but also that the enhancement is selective. The signals can therefore be assigned to their respective residues, which is not possible in a conventional 2D correlation spectrum because of extensive signal overlap (Figure 2b, black). Figure 2c shows the “bulk” signal of our hyperpolarized exchange filtered spectrum. Figure 2d and Figure S1 in the Supporting Information show overlays of OPN spectra, either enhanced by hyperpolarized HDO at pH 7.5 and 3588C, or detected in thermal equilibrium at pH 6.5 and 2588C, where the NMR signals are strongest in the absence of hyperpolarization.[15b] In high-resolution spectra obtained
without hyperpolarization, many signals disappear when going from NMR-optimized to near-physiological conditions, that is, from pH 6.5 and 2588C to 7.5 and 3588C. These signals can be recovered through exchange with hyperpolarized water. Thus, a further advantage of our D-DNP technique is the observation of signals that are broadened beyond detection in conventional methods, although the resolution in hyperpolarized HMQC spectra suffers from rapid accu-mulation (< 30 s) after dissolution. Notwithstanding signifi-cant signal overlap, some peaks can still be assigned unambiguously. Even the N-terminal amino acids can be observed, which is normally impossible owing to fast solvent exchange. Here, however, for the very same reason, they become observable. Our method is therefore ideal for study-ing systems that cannot be studied otherwise owstudy-ing to excessively fast exchange—a frequent obstacle is turned into an advantage in this method.
Figure 1. a) Sketch of the functional architecture of quail osteopontin (OPN). Full-length OPN consists of 267 amino acids. The metastasis-associated construct studied here comprises the 220 C-terminal residues (47–267) of the primary sequence. The heparin interaction epitope is located between residues 100 and 165. The heparin binding site comprises residues 145–165. The compensatory residues 100–145 become more mobile when bound to heparin. b) A mixture of H2O
and glycerol containing 10 mm TEMPOL is hyperpolarized at 1.2 K and 6.7 T, dissolved with a 20-fold excess of superheated D2O, and
transferred to an 18.8 T (800 MHz) spectrometer where it is mixed with a solution of OPN that is waiting in the NMR tube (ca. pH 7.5 and 308 K after mixing.) Strong signals in the1H-15N correlation
spectra arise for rapidly exchanging protons (HN) in OPN, while slowly
Note that the highest enhancement factors that were achieved for OPN were about 40 for the overall spectrum and 58 for the most intense peaks with respect to thermal equilibrium. Figure 2e shows a comparison between the signal intensities of OPN in a hyperpolarized exchange-filtered spectrum and a conventional spectrum in thermal equilibrium. Frydman and co-workers reported enhancement factors up to 330 at pH 7 and 6088C for denatured Trypsin (247 amino acids, like OPN). The enhancement factors should be compared with caution since the experimental conditions were quite different. Frydman and co-workers used a much faster injection system (1–3 s) and employed radical-separa-tion techniques. Despite these differences, we may conclude that while we aim for physiological conditions that should be favorable for system-oriented studies, stronger signal enhancements may be obtained at other temperatures and pH. Furthermore, it has to be taken into account that in OPN,
the compacted core features reduced exchange rates so that many cross peaks are not enhanced by hyperpolarized HDO, while in entirely dena-tured proteins like that of Fryd-man and co-workers, all resi-dues can be enhanced homoge-neously.
In the complex of OPN bound to heparin, the binding site[15b,20]is located between
res-idues 145–165 of OPN (Fig-ure 1a). Between residues 100 and 145, a compensatory site is located that masks the binding site in the apo-state (i.e., in the absence of heparin), but is exposed to the solvent in the holo-state (i.e., when OPN is bound to heparin).[20]This
fea-ture, which compensates for entropy loss, is retained at near-physiological pH and tem-perature.
Figure 3 a shows the Gly region of the hyperpolarized exchange filtered (red, 30 s) and normal (gray, obtained by time-averaging for 18 h) SOFAST HMQC spectra in the presence of heparin. Clearly, hyperpolarization allows the assignment of signals that are invisible in the normal spectrum owing to strong signal broad-ening. Most importantly, the glycine residues are not observ-able in the absence of heparin. Figure 3 b shows how the HN
exchange rates are affected when heparin binds to OPN. This leads to distinct effects in the glycine region. For exchange rates that increase upon binding, we observe that new cross-peaks emerge (green arrows in Figure 3d). In contrast, the only glycine that was observable in the apo-form becomes weaker owing to a decreased exchange rate in the holo-form (red arrow in Figure 3d). All visible glycine residues lie in the region between residues 100 and 180. They are more exposed to the solvent in the holo-form than in the apo-form.[20] This exposure accelerates exchange with
hyperpolarized HDO, thereby rendering them amenable to detection. Only one glycine signal disappears upon heparin binding. It is located within the binding interface between residues 140–165, which display reduced exchange rates.
Figure 3c shows chemical-shift perturbations along the primary sequence of OPN observed by hyperpolarized exchange spectroscopy. These chemical shifts are in excellent agreement with earlier studies and highlight both the heparin
Figure 2. a) Red:1H-15N correlation spectrum of OPN selectively enhanced by hyperpolarized HDO.
Black: A regular spectrum of the same sample after return to thermal equilibrium. b) Region showing resonances of serines selectively enhanced by hyperpolarized HDO. c) The bulk signal still allows the assignment of some cross peaks. d) Overlay of a hyperpolarized exchange filtered SOFAST HMQC at pH 7.5 and 3588C (red), a high resolution HSQC with a recycling time of 1 s and 256 complex increments in the indirect dimension at pH 7.5 and 3588C (black), and the same HSQC with a recycling time of 1 s at pH 6.5 and 2588C (blue). Differences in chemical shifts between the red and the blue spectra stem from the different experimental conditions. For the overlay of the entire spectrum, see the Supporting Information. e) Comparison of the projection of the full1H-15N spectra of OPN onto the proton
dimension, detected with hyperpolarized water and SOFAST HMQC (red, see Figure 2c) in a single accumulation and the exact same experiment detected with 256 accumulations (black) after return to thermal equilibrium of the sample after dissolution. In both cases the recycling delay was set to 0.3 s. The two projections are scaled by the ratio of the number of spectra averaged (hyperpolarized/ thermalized = 1:256) and the applied receiver gain (hyperpolarized/thermalized =128:912). The signal enhancement due to hyperpolarized HDO was 40.
binding site and the compensatory site.[20,23] Hyperpolarized
HDO thus provides a reliable method to monitor conforma-tional changes in IDPs.
Acknowledgments
We thank Dr. Pavel Kaderˇ#vek, Dr. Daniel Abergel, and Dr. Phillippe Pelupessy for their support, and Bruker BioSpin for generously providing the D-DNP prototype. This work was supported by the French CNRS, the European Research Council (ERC contract “Dilute para-water”), and the Aus-trian Science Foundation (FWF), P26317.
Keywords: dynamic nuclear polarization · hyperpolarized water · intrinsically disordered proteins · NMR spectroscopy ·
solvent exchange
How to cite: Angew. Chem. Int. Ed. 2017, 56, 389–392 Angew. Chem. 2017, 129, 397–401
[1] a) P. Tompa, Trends Biochem. Sci. 2012, 37, 509 – 516; b) H. J. Dyson, P. E. Wright, Nat. Rev. Mol. Cell Biol. 2005, 6, 197 – 208; c) C. K. Fisher, C. M. Stultz, Curr. Opin. Struct. Biol. 2011, 21, 426 – 431.
[2] M. Fuxreiter, P. Tompa, Adv. Exp. Med. Biol. 2012, 725, 1 – 14. [3] M. M. Babu, R. van der Lee, N. S. de Groot, J. Gsponer, Curr.
Opin. Struct. Biol. 2011, 21, 432 – 440.
[4] A. K. Dunker, Z. Obradovic, P. Romero, E. C. Garner, C. J. Brown, Genome Inf. Ser. 2000, 11, 161 – 171.
[5] L. Geist, M. A. Henen, S. Haiderer, T. C. Schwarz, D. Kurzbach, A. Zawadzka-Kazimierczuk, S. Saxena, S. Zerko, W. Kozminski, D. Hinderberger, R. Konrat, Protein Sci. 2013, 22, 1196 – 1205. [6] a) T. Mittag, J. D. Forman-Kay, Curr. Opin. Struct. Biol. 2007, 17, 3 – 14; b) M. R. Jensen, M. Blackledge, Proc. Natl. Acad. Sci. USA 2014, 111, E1557 – E1558.
[7] A. Zawadzka-Kazimierczuk, W. Kozminski, H. Sanderova, L. Krasny, J. Biomol. NMR 2012, 52, 329 – 337.
[8] G. S. Rule, T. K. Hitchens, Fundamentals of Protein NMR Spectroscopy, Springer, Dordrecht, 2006.
[9] F. X. Theillet, A. Binolfi, B. Bekei, A. Martorana, H. M. Rose, M. Stuiver, S. Verzini, D. Lorenz, M. van Rossum, D. Goldfarb, P. Selenko, Nature 2016, 530, 45 – 50.
[10] a) Q. Chappuis, J. Milani, B. Vuichoud, A. Bornet, A. D. Gossert, G. Bodenhausen, S. Jannin, J. Phys. Chem. Lett. 2015, 6, 1674 – 1678; b) T. Harris, O. Szekely, L. Frydman, J. Phys. Chem. B 2014, 118, 3281 – 3290.
[11] A. Abragam, M. Goldman, Rep. Prog. Phys. 1978, 41, 395 – 467. [12] G. Platzer, S. Zerko, S. Saxena, W. Kozminski, R. Konrat,
Biomol. NMR Assignments 2015, 9, 289 – 292.
[13] a) V. Tugarinov, V. Kanelis, L. E. Kay, Nat. Protoc. 2006, 1, 749 – 754; b) J. Schçrghuber, T. Sara, M. Bisaccia, W. Schmid, R. Konrat, R. J. Lichtenecker, ChemBioChem 2015, 16, 746 – 751. [14] S. Gil, T. Hosek, Z. Solyom, R. Kummerle, B. Brutscher, R. Pierattelli, I. C. Felli, Angew. Chem. Int. Ed. 2013, 52, 11808 – 11812; Angew. Chem. 2013, 125, 12024 – 12028.
[15] a) D. Kurzbach, G. Platzer, T. C. Schwarz, M. A. Henen, R. Konrat, D. Hinderberger, Biochemistry 2013, 52, 5167 – 5175; b) G. Platzer, A. Schedlbauer, A. Chemelli, P. Ozdowy, N. Coudevylle, R. Auer, G. Kontaxis, M. Hartl, A. J. Miles, B. A. Wallace, O. Glatter, K. Bister, R. Konrat, Biochemistry 2011, 50, 6113 – 6124; c) P. H. Anborgh, J. C. Mutrie, A. B. Tuck, A. F. Chambers, J. Cell. Mol. Med. 2010, 14, 2037 – 2044; d) L. R. Rodrigues, J. A. Teixeira, F. L. Schmitt, M. Paulsson, H. Lind-mark-Mansson, Cancer Epidemiol. Biomarkers 2007, 16, 1087 – 1097; e) P. Y. Wai, P. C. Kuo, J. Surg. Res. 2004, 121, 228 – 241. [16] J. H. Ardenkjaer-Larsen, B. Fridlund, A. Gram, G. Hansson, L. Hansson, M. H. Lerche, R. Servin, M. Thaning, K. Golman, Proc. Natl. Acad. Sci. USA 2003, 100, 10158 – 10163.
[17] a) D. Gajan, A. Bornet, B. Vuichoud, J. Milani, R. Melzi, H. A. von Kalkeren, L. Veyre, C. Thieuleux, M. P. Conley, W. R. Grgning, M. Schwarzw-lder, A. Lesage, C. Cop8ret, G. Boden-hausen, L. Emsley, S. Jannin, Proc. Natl. Acad. Sci. USA 2014, 111, 14693 – 14697; b) B. Vuichoud, A. Bornet, F. de Nanteuil, J. Milani, E. Canet, X. Ji, P. Mi8ville, E. Weber, D. Kurzbach, A. Flamm, R. Konrat, A. D. Gossert, S. Jannin, G. Bodenhausen, Chem. Eur. J. 2016, 22, 14696.
[18] P. Schanda, E. Kupce, B. Brutscher, J. Biomol. NMR 2005, 33, 199 – 211.
[19] G. Olsen, E. Markhasin, O. Szekely, C. Bretschneider, L. Frydman, J. Magn. Reson. 2016, 264, 49 – 58.
[20] D. Kurzbach, T. C. Schwarz, G. Platzer, S. Hçfler, D. Hinder-berger, R. Konrat, Angew. Chem. Int. Ed. 2014, 53, 3840 – 3843; Angew. Chem. 2014, 126, 3919 – 3922.
[21] R. Konrat, J. Magn. Reson. 2014, 241, 74 – 85.
[22] G. M. Clore, J. Iwahara, Chem. Rev. 2009, 109, 4108 – 4139. [23] a) D. Kurzbach, Protein Sci. 2016, 25, 1617 – 1627; b) D.
Kurz-bach, A. G. Flamm, T. Sara, Protein Sci. 2016, 25, 1628 – 1636.
Manuscript received: September 12, 2016 Final Article published: December 5, 2016 Figure 3. a) Expanded Ser/Thr region of the regular correlation
spec-trum of apo-OPN (partly folded in the absence of heparin; gray) and the spectrum of apo-OPN boosted by hyperpolarized HDO (colored). b) Differential exchange rates Dkex=kex(holo)@kex(apo). The green
arrows indicate Gly residues that only appear in 2D correlation spectra of the holo-state of OPN. The red arrow indicates the only glycine resonance can be observed by means of hyperpolarized HDO in the apo-form. Its signal becomes weaker upon heparin binding. c) Chem-ical-shift perturbation (CSP) of resolved amino acid upon the binding of heparin to OPN.