IL 323 t
Université de Monfréal
Étude de l’association entre peptides et micelles typiques
ou polymériques effectuée par spectroscopie
UV/VIS
et
par MEKC
Par Cari Hémond
Département de Chimie faculté des Arts et des Sciences
Mémoire présenté à la Faculté des études supérieures en vue de l’obtention du grade de
Maîtrise ès sciences (M. Sc.) en chimie
Août 2003
Université
de Montréal
Direction des bibliothèques
AVIS
L’auteur e autorisé l’Université de Montréal à reproduire et diffuser, en totalité ou en partie, par quelque moyen que ce soit et sur quelque support que ce soit, et exclusivement à des fins non lucratives d’enseignement et de recherche, des copies de ce mémoire ou de cette thèse.
L’auteur et les coauteurs le cas échéant conservent la propriété du droit d’auteur et des droits moraux qui protègent ce document. Ni la thèse ou le mémoire, ni des extraits substantiels de ce document, ne doivent être imprimés ou autrement reproduits sans l’autorisation de l’auteur.
Afin de se conformer à la Loi canadienne sur la protection des renseignements personnels, quelques formulaires secondaires, coordonnées ou signatures intégrées au texte ont pu être enlevés de ce document. Bien que cela ait pu affecter la pagination, il n’y a aucun contenu manquant. NOTICE
The author of this thesis or dissertation has granted a nonexclusive license allowing Université de Montréal to reproduce and publish the document, in part or in whole, and in any format, solely for noncommercial educational and research purposes.
The author and co-authors if applicable retain copyright ownership and moral rights in this document. Neither the whole thesis or dissertation, nor substantial extracts from it, may be printed or otherwise reproduced without the author’s permission.
In compliance with the Canadian Privacy Act some supporting forms, contact information or signatures may have been removed from the document. While this may affect the document page count, it does flot represent any loss of content from the document.
Ce mémoire intitulé
Étude de l’association entre peptides et micelles typiques
ou polymériques effectuée par spectroscopie
UVIVIS
et
par MEKC
présenté par: Cari Hémond
a été évalué par un jury composé des personnes suivantes: Dr. Marius D’Amboise président-rapporteur Dr. Karen C. Waidron directrice de recherche Dr. Sébastien Sauvé membre dujury
Sommaire
L’intérêt des études sur l’interaction entre une série de peptides et un agent micellant donné, porte généralement sur la détermination de la valeur relative des constantes d’association apparentes (Kas), plutôt que sur leur valeur absolue. La fiabilité d’une méthode à déterminer les Kas est donc rarement considérée, en raison de la variation des conditions expérimentales pouvant se produire à l’intérieur de la même technique analytique. Il est toutefois important de savoir si les Kas obtenues par des méthodes électrophorétiques sont comparables à celles obtenues par une autre technique instrumentale. Dans cette étude, l’électrophorêse capillaire (CE) en milieu micellaire (MEKC) a été comparée à la spectroscopie d’absorption afin d’estimer les Kas de systèmes peptides-micelles pour trois petits peptides sous les conditions suivantes solution aqueuse tamponnée à pH 4,1 pour les études des interactions avec le CTAB et 7,0 et 8,1 pour les études des interactions avec le SDS à des températures de 25°C, 20°C et 33°C. Les deux méthodes ont donné des valeurs similaires de Kas pour les trois systèmes peptides-micelles de dodécyl sulfate de sodium (SDS) avec des valeurs allant de 12 ± 3 M’ à 38,6 ± 0,7 M’. Dans le cas des deux méthodes utilisées, les Kas du système Leu-Phe en présence de micelles de bromure de cétyltrirnéthylammonium (CTAB) étaient du même ordre de grandeur que celles obtenues avec les micelles de SD$. D’autre part, l’association enképhaline-micelle de CTAB était à peu près 10 fois plus forte (Kas = 122 ± 3 M’ à 311 ± 9 M’) que l’association enképhaline-micelle de SDS.
De plus, la MEKC sous-estime les valeurs de Kas, par rapport à la spectroscopie par un facteur de 2-3 pour les systèmes enképhaline-CTAB.
Une certaine difficulté s’est manifestée lors de la détermination de la concentration micellaire critique (CMC) des surfactants, révélant ainsi la dégradation du SDS en fonction du temps. Une série d’études a donc été réalisée afin d’évaluer l’effet de ce comportement du SDS sur la mobilité effective des peptides utilisés en MEKC. Étant donné que deux de nos peptides ont deux résidus aromatiques (phénylalanine et tyrosine), nous voulions identifier celui qui
est impliqué dans l’association avec les micelles. La spectroscopie d’absorption a permis d’évaluer séparément la contribution de deux résidus aromatiques présents dans le même peptide en utilisant la troisième dérivée du spectre UV/Vis. La comparaison des constantes d’association ainsi obtenues a démontré que la phénylalanine interagit beaucoup plus avec la phase micellaire
(Kas(pIe): 310 + 40 M’) que la tyrosine, qui a plutôt des interactions avec la
surface de la micelle de CTAB (Kas(Tyr) 170 ± 10 M1). Dans le cas des micelles
de SDS, les résidus de Met-enképhaline ne s’insèrent pas dans la phase micellaire. Les constantes d’association obtenues reflètent donc le changement de conformation du peptide et permettent de vérifier que les résidus aromatiques interagissent conformément à une étude réalisée par RMN qui a été publiée en 2001.
Pour déterminer la constante d’association apparente, une relation mathématique impliquant la variation de la mobilité en MEKC ou du maximum de la longueur d’onde en spectrophotométrie UV/Vis en fonction de la concentration en agent micellant est utilisée. De façon similaire, les interactions entre des peptides et des polyélectrolytes ont été mesurées par électrophorèse capillaire. Nous avons proposé que des stoechiométries d’association 1:1 et 1:2 se produisant simultanément entre le peptide et le copolymère décrivaient le mieux les résultats observés (I= 110 mM phosphate de sodium, pH 2,0, 25°C).
Mots clefs : Spectroscopie d’absorption / Constante d’association / Chromatographie électrocinétique capillaire / Micelle / Peptide / Polyélectrolyte / Micelle unimoléculaire / Enképhaline / Electrophorèse capillaire
lu
Abstract
The relative, rather than absolute, binding strengths of a series of peptides with a given binding agent are normally sought after in a study. Thus the reïiability of a method to accurately determine equilibrium association constants, Kas, is rarely considered, particularly because experimental conditions can vary widely even within the same measurement technique. Nonetheless, it is important to know whether Kas obtaincd by electrophoretic-based methods are meaningful by comparing Kas values for a given chemical interaction with those obtained by another instrumental technique, keeping in mmd that each method interrogates a different property and can thus bias the Kas estimation. In this study, micellar electrokinetic capillary chromatography (MEKC) was compared to absorption spectroscopy to estimate Kas for peptide-micelle systems using three small peptides under the following conditions: aqueous solutions buffered at pH 4.1 for CTAB interactions and at 7.0 and 8.1 for SDS at temperatures of 25°C, 20°C and 33°C. Viscosity-corrected MEKC mobilities gave reasonably similar estimates of Kas between the two methods for all three peptide-sodium dodecyl sulfate (SDS) micelle systems, with Kas values ranging from 12 ± 3 M’ to 38,6 ± 0,7 M1. For cetyltrimethylammonium bromide (CTAB), estimates of Kas for Leu-Phe with CTAB micelles association were of the same order of magnitude as the SDS micelles by the two methods of estimation. On the other hand, enkephalin-CTAB micelle binding was about 10 times stronger (Kas = 122 ± 3 M1 to 311 + 9 M1)
than the enkephalin-SDS micelle binding. In addition, MEKC underestimated the Kas values relative to spectroscopy by a factor of 2—3 for the enkephalin-CTAB system.
Problems arising during the critical micellar concentration (CMC) determination showed evidence of $DS degradation over time. A series of studies were donc to evaluate the behaviour and age of SDS buffer solutions on the effective mobility of the peptides used in MEKC. Because two of our peptides have two aromatic residues (phenylalanine and tyrosine), we wanted to know whether one of them was preferentially involved during the binding with
the micelles. Using spectroscopy, the contribution of two different aromatic side chains present in the same peptide could be evaluated separately by using the first or third derivative of the UV/Vis spectrum. A comparison of the constants showed that phenylalanine interacted more strongly with the micellar phase
(Kas(phe)$ 310 ± 40 M’) while tyrosine interactions were mostly located at the
surface ofthe CTAB micelle (Kas(Tyr) 170 ± 10 M’). In the case of SDS micelles,
the Met-enkephalin residues are not insertcd into the micellar phase. In this case, the association constants reflected the change of conformation of the peptide and they confirmed that the residues interact together rather than with the micelles, as shown by NMR studies published in 2001.
$imilarly, the affinity of peptides for polyelectrolytes was measured by capillary electrophoretic techniques in an attempt to identify and quantify the interactions involved. To determine the apparent binding constant, mathematical relationships involving the variation of mobility (MEKC) or wavelength maximum (spectrometry) as a function of increasing additive concentration were used. We proposed that two binding stoichiometries 1:1 and 1:2 occurring simultaneously between the peptide analyte and the copolymer best described the observed data (I= 110 mM sodium phosphate, pH 2.0, 25°C).
Keywords: Absorption spectroscopy / Association constant / Binding constant / Electrokinetic capillary chromatography / Micelle / Peptide / Polyelectrolyte / Unimolecular micelle / Enkephalin / Capillary electrophoresis
V
Table des matières
Sommaire
Abstract iii
Table des matières y
Liste des tableaux viii
Liste des figures ix
Liste des abréviations xii
Remerciements xiv
1. Introduction générale 1
1.1 Importance de la détermination des constantes d’association 2 1.2 Calcul des constantes d’association 3 1.2.1 Électrophorèse capillaire 3 1.2.2 Spectrophotométne d’absorption $
1.3 Objectifs du projet 9
2. A comparison between electroldnetic capillary chromatography and absorption spectroscopy for the analysis of peptide-micelle association by weak hydrophobic interactions’ 11
2.1 Introduction 13
2.2 Materials and methods 15
2.2.1 Materials 15
2.2.2 Buffer and sample preparation 16 2.2.3 Absorption spectroscopy methods 16 2.2.4 Capillary electrophoresis methods I $ 2.3 Results and discussion 20
Analyte 23
2.4 Conclusions 2$
2.5 Annexe 29
3. Comportement des solutions micellaires lors des études faites par
électrophorèse capillaire 36
3.2 Théorie. 38
3.2.1 HydrolyseduSDS 38
3.2.2 Détermination de la CMC 39 3.2.3 Détermination du facteur de correction de la viscosité 39 3.3 Matériels et méthodes 41 3.3.1 Provenance des produits 41 3.3.2 Préparation des tampons et des échantillons 41 3.3.3 Électrophorèse capillaire 42 3.4 Résultats et discussion 43
3.5 Conclusion 49
4. Comparaison des constantes d’association obtenues à partir de chacun des chromophores présents dans la Met-enképhaline 52
4.1 Introduction 53
4.2 Matériels et méthodes 54 4.2.1 Provenance des produits 54 4.2.2 Préparation des tampons et des échantillons 55 4.2.3 Spectrophotométrie UV-Visible différentielle 55 4.3 Résultats et discussion 56
4.4 Conclusion 60
5. Étude des interactions peptides-micelles polymériques par électrophorèse
capillaire 62
5.1 Introduction 63
5.2 Matériels et méthodes 66 5.2.1 Provenance des produits 66 5.2.2 Préparation des tampons et des échantillons 66 5.2.3 Électrophorèse capillaire 67 5.3 Résultats et discussion 6$ 5.4 Conclusion 80 6. Conclusion générale $2 6.1 Conclusion $3 6.2 Directions futures 86
vii
Liste des tableaux
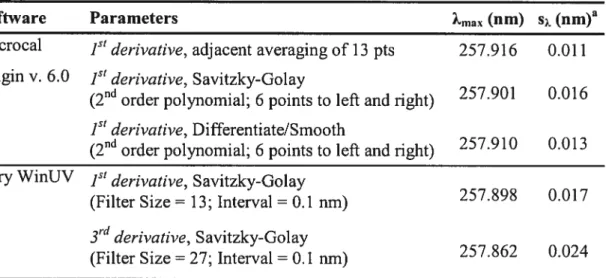
Table 2.1 Summary of different methods used for the derivative spectrum
calculation and data smoothing to obtain 2max 21
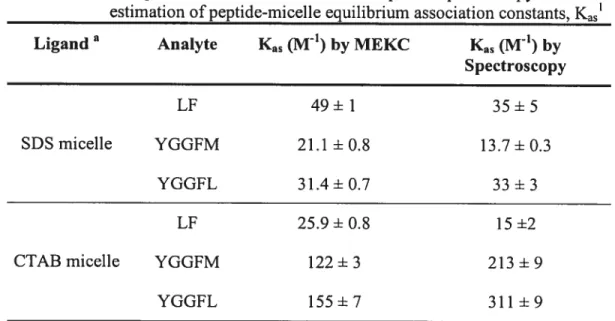
Table 2.2 Comparison of MEKC and absorption spectroscopy for the estimation
of peptide-micelle equilibrium association constants, Kas 23
Table 2.3 Summary of different methods used for the derivative spectrum
calculation and data smoothing to obtain 2max offree Leu-Phe using n 12 33
Table 2.4 Comparison of MEKC and absorption spectroscopy for the estimation of peptide-micelle equilibrium association constants, Kas. 33
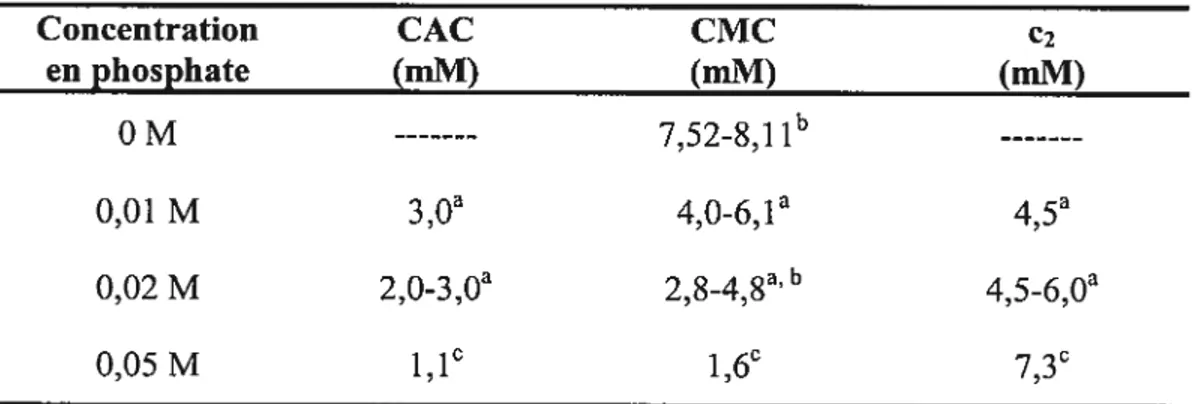
Tableau 3.1 Comparaison des paramètres de micellisation (CMC) et d’agrégation (CAC) du $DS dans des tampons phosphate pH 7,0 de différentes
concentrations 48
Tableau 3.2 CAC, CMC et concentration e2 du SDS et du CTAB dans des
tampons phosphates ayant I 100 mM 49
Tableau
4.1
Comparaison des constantes d’association apparentes entre la Met enképhaline et des surfactants obtenues à partir des spectres différentiels de TyroudePhe 59
Tableau 5.1 Détermination du pH auquel la mobilité d’une série de peptides subit un déplacement en présence de 0,2 g/L de PAMPS 90% Dod 10% par
rapport à la mobilité électrophorétique 69
Tableau 5.2 Mobilités des espèces associées des différents systèmes copolymère-peptide estimées par régression non-linéaire1 78
Tableau 5.3 Constantes d’association apparente peptide-copolymère déterminées à partir du modèle utilisant les interactions 1 :1 et 1:2 simultanément2 79
ix
Liste des figures
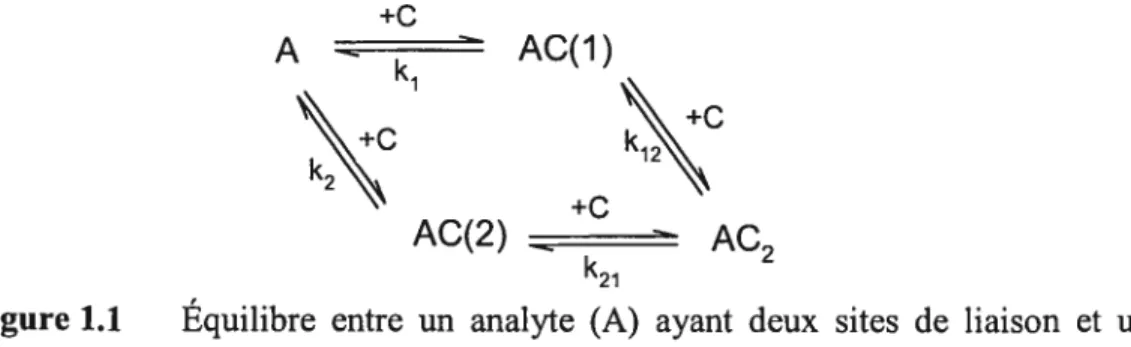
Figure 1.1 Équilibre entre un analyte (A) ayant deux sites de liaison et un agent micellant (C) ayant un site de liaison 6 Figure 2.1 Double-reciprocal plot and weighted linear regression for the estimation of Kas by absorption spectroscopy for Met-enkephalin association with CTAB micelles. The concentration of CTAB in the micelles (complexing agent) was calculated as follows: [C] = [CTAB]totaj - 0.8 mM. The CTAB concentration
ranged from 10 to 50 mM in sodium phosphate background electrolyte with total buffer ionic strength of 110 mM, pH 4.1, at 25°C. Analyte (YGGFM) concentration was 0.2 mM. The value of 7’max (i.e., 7obs) was approximately 275
nm. Error bars represent the standard deviation of 3 replicate measurements. The correlation coefficient of the regression was R2 = 0.998 and Kas= 213 + 9 M1 24
Figure 2.2 Double-reciprocal plot and weighted linear regression for the estimation of Kas by MEKC for Met-enkephalin association with CTAB micelles. The concentration of micellar CTAB and the background electrolyte were the same as in fig. 2.1. Separations were carried out at 500 V/cm, 76.5 tA, with detection at 235 nm. Analyte (Met-enkephalin) concentration was 0.3 mM. Error bars represent the standard deviation of 3 replicate electropherograms. The correlation coefficient of the regression was R2= 0.999 and Kas= 122 + 3 M 25
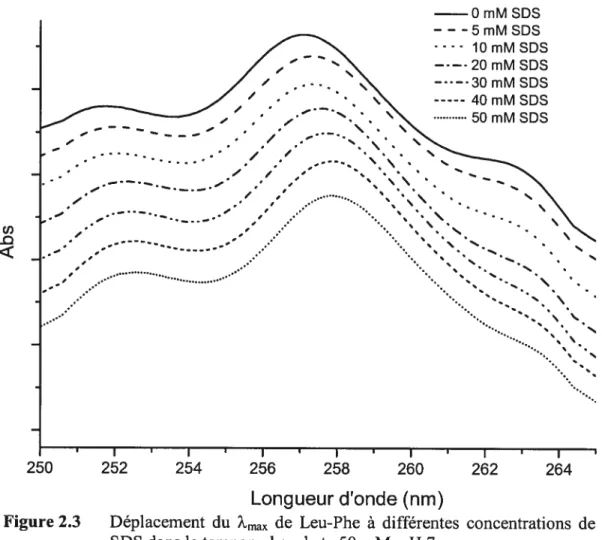
Figure 2.3 Déplacement du ?rnax de Leu-Phe à différentes concentrations de
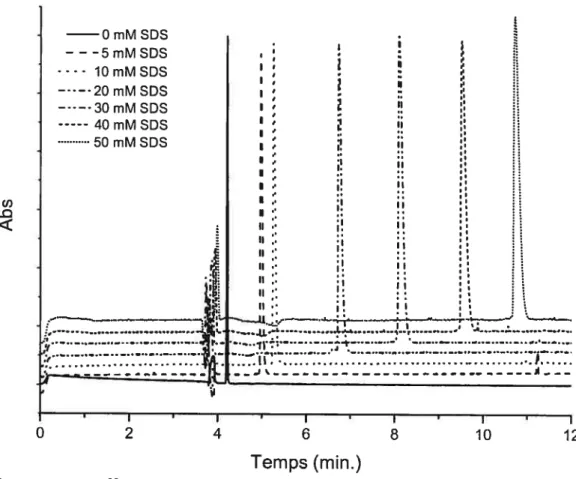
SDS dans le tampon phosphate 50 mM, pH 7 30 Figure 2.4 Effet de l’augmentation de la concentration de SD$ sur l’électrophérogramme de Leu-Phe. Tampon 50 mM phosphate, pH 7, 25 kV,
20°C 31
Figure 2.5 Importance du facteur de correction de la viscosité lors de la détermination de la valeur de Kas entre Met-enképhaline et le CTAB 32 Figure 2.6 Détermination de la constante d’association par MEKC à l’aide d’une régression non-linéaire basée sur l’équation 1.8. Tampon 10 à 50 mM CTAB dans un tampon phosphate 1=110 mM, pH 4,1, détection à 235 nm, analyte
1 mM Met-enképhaline 32
Figure 2.7 Double-reciprocal plot and weighted linear regression (error bars to determine weight) for the estimation of Kas by absorption spcctroscopy for Met-enkephalin association with CTAB micelles. The concentration of CTAB in the micelles (binding agent) was calculated as follows: [C] = [CTAB]totai — 0.8 mM. The CTAB concentration ranged from 10 to 50 mM in sodium phosphate background electrolyte with total buffer ionic strength of 110 mM, pH 4.1, at 25°C. Analyte (Met-enkephalin) concentration was 0.2 mM. The value of &max (i.e., 2obs) was approximately 275 nm. Error bars represent the standard deviation
of 3 replicate measurements. The correlation coefficient of the regression was R2
= 0.99$, F = 706 (critical value is: Fi,3= 216 (P = 0.05)) and Kas= 213 ± 9 M*
..
34Figure 2.8 Double-reciprocal plot and weighted linear regression for the estimation of Kas by MEKC for Met-enkephalin association with CTAB micelles. The concentration of micellar CTAB and the background electrolyte were the same as in Fig. 2.1. Separations were carried out at 500 V/cm, 76.5 jiA, with detection at 235 mn. Analyte (Met-enkephalin) concentration was 0.3 mM. Error bars represent the standard deviation of 3 replicate electropherograms. The correlation coefficient of the regression was R2 = 0.999, F = 2689 (critical value
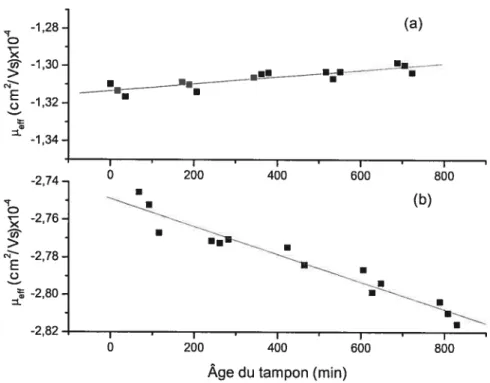
is:F1,3=216(P=0.05))and Kas=122±3M’ 35 Figure 3.1 Influence du temps sur la mobilité (J.teff) de la Met-enképhaline
dans un tampon phosphate I = 106 mM, pH 8,1 contenant : (a) O mM SDS (F =
43, R2 = 0,7669), (b) 50 mM SDS (F= 177, R2 = 0,9365) 44
Figure 3.2 Progression dans le temps : (a) de la mobilité de la Met enképhaline et (F = 2,7, R2 = 0,7703) (b) du courant dans le capillaire (F =44, R2 = 0,2 143), pour un tampon phosphate I = 94 mM, pH 7,0 contenant 50 mM de
SDS. 45
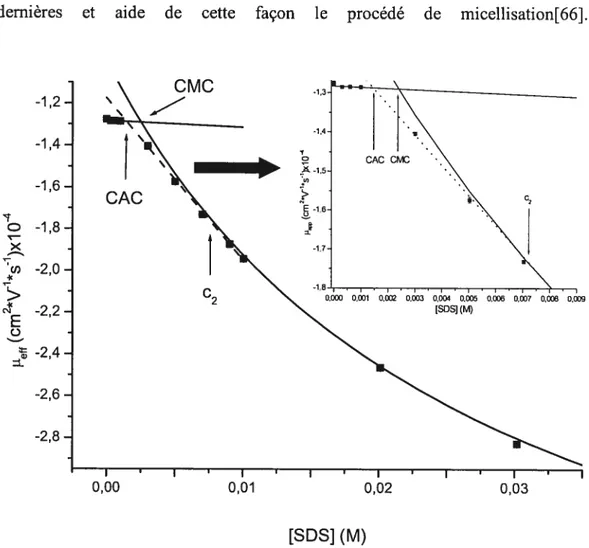
Figure 3.3 Variation de la mobilité effective de la Met-enképhaline en fonction de la concentration de SDS. Tampon phosphate I= lO6mM, pH 8,1 47
Figure 3.4 Variation du facteur de correction de la viscosité, y, causée par
l’augmentation de la concentration de SDS dans un tampon phosphate ayant un pH de 8,1 et une force ionique de 106 mM 50 Figure 4.1 Spectres d’absorption (a) d’ordre zéro, (b) de première dérivée et (c) de troisième dérivée de la Met-enképhaline
(—),
de Leu-Phe(---)
et de Ac Tyr-NH2(...)
dans un tampon phosphate 1=106 mM, pH 8,1 57 Figure 5.1 Structure des copolymères de AMPS, Dod et py ayant respectivement une abondance dcx = 80 ou 90 mol %, y = 5, 10 ou 15 mol % et z=Oou5mol%[80] 65
Figure 5.2 Effet de l’augmentation de la concentration (0 à 0,56 g/L de haut en bas respectivement) de PAMPS 90% Dod 5% py 5% (a) et de PAMPS 80% Dod 15% py 5% (b) sur le temps de migration de Leu-Phe et de la Leu enképhaline (premier et deuxième pic respectivement). Tampon : I = 110 mM
phosphate, pH 2,0, 11 kV, 25°C 71 Figure 5.3 Variation de la mobilité effective de la Leu-enképhaline avec la concentration de PAMPS 90% Dod 5% py 5% dans les conditions : tampon phosphate I = 110 mM, pH 2,0, 11 kV, 25°C. Les erreurs sont de la même taille
xi Figure 5.4 Tracé de la fonction inverse pour le système PAMPS 90% Dod 5% py 5%-Leu-Phe. L’équation de la régression linéaire simple est: y = -0,380 x +
600. Le coefficient de corrélation de la droite est 0,9997 et F = 195 (la valeur
critique est : F1,4= 225 (P= 0.05)) 75
Figure 5.5 Régression non-linéaire pour le système Leu-enképhaline-PAMPS 90% Dod 5% py 5% dans les conditions : tampon phosphate I = 110 mM, pH
2,0, 11 kV, 25°C. Les points (u) apparaissant sur le graphique représentent les données expérimentales, tandis que la courbe représente la régression non-linéaire effectuée selon l’équation 5.2. Le coefficient de corrélation de la courbe est 0,99999 et F= 18240 (la valeur critique est: F4,4= 6,4 (P = 0.05)) 76
Liste des abréviations
ACE affinity capillary electrophoresis (électrophorèse capillaire d’affinité)
Arg-Phe arginine-phenylalanine
AMPS monomère de 2-(acrylamido)-2-rnethylpropanesulfonate de sodium ANOVA Analyse de la variance
C2 concentration à laquelle les micelles libres apparaissent
CAC concentration d’agrégation critique
CE capillary electrophoresis (électrophorèse capillaire) CEC capillary electrochromatography (électrochormatographie
capillaire)
CMC critical micellar concentration (concentration micellaire critique) CTAB cetyltrimethylammonium bromide (bromure de
cétyltriméthylammonium)
CZE capillary zone electrophoresis (électrophorèse capillaire en solution libre)
Dod monomère de N-dodecyl-méthacrylamide
EKC electrokinetic chromatography (chromatographie électrocinétique) EOF electroosmotic flow (flux électroosmotique)
FACCE frontal analysis continuous capillary electrophoresis (analyse frontale continue en électrophorèse capillaire)
Kas constante d’association apparente
LC liquid chromatography (chromatographie liquide) Leu-enképhaline leucine enképhaline
Leu-Phe leucine-phenylalanine
MEKC micellar electrokinetic chromatography (électrophorèse capillaire en milieu micellaire)
Met-enképhaline méthionine enképhaline
NMR nuclear magnetic resonance (résonance magnétique nucléaire) PAMPS polymère de 2-(acrylamido)-2-methylpropanesulfonate de sodium
py monomère de N-(1 -pyrènylmethyl)méthacrylamide $DS sodium dodecyl sulfate (dodécyl sulfate de sodium) Tyr-Phe tyrosine-phenylalanine
UV ultraviolet
Remerciements
En premier lieu, je souhaite remercier ma directrice de recherche, la Professeure Karen C. Waldron pour m’avoir accepté dans son groupe. J’ai grandement apprécié la confiance qu’elle m’a accordée, l’intérêt qu’elle a manifesté à la progression de mon projet et les précieux conseils qu’elle m’a prodigués et qui m’ont permis de réaliser ce dernier.
Je désire également remercier le Département de Chimie de l’Université de Montréal et la Professeure Joelle Pelletier qui m’ont permis d’utiliser leur spectrophotomètre UV/Vis. Je tiens aussi à remercier Roger C.W. Liu, Julie Murray et la Professeure Françoise Wiimik qui m’ont gracieusement fourni les micelles polymériques nécessaires à la réalisation d’une partie de ce projet. Je tiens aussi à souligner les conseils judicieux que m’a donnés Alexandra ftrtis qui a effectué les études préliminaires de ce projet.
Mes remerciements s’adressent aussi à mes collègues de laboratoire avec qui il fût stimulant de travailler.
Je tiens finalement à remercier toute ma famille pour le soutien constant qu’elle m’a apporté.
1.1
Importance de la détermination des constantes d’association
Les interactions moléculaires non-covalentes sont largement répandues dans la nature et leurs constantes d’association (Kas) sont des paramètres fondamentalement importants dans la compréhension d’un éventail de phénomènes biologiques et biochimiques. Par exemple, la détermination des Kas entre des protéines provenant du plasma et des médicaments est essentielle au développement pharmaceutique, puisque la concentration de médicaments non-liés à une excellente corrélation avec l’activité pharmacologique[1]*.
D’autre part, les micelles ont un attrait particulier, puisqu’elles permettent d’imiter la structure des membranes cellulaires. Cette caractéristique est largement utilisée pour étudier les interactions neuropeptides-membranes biologiques, ainsi que l’effet de ces interactions sur le changement de conformation des neuropeptides qui se produit avant son association avec son récepteur[2-4].
Les micelles sont aussi largement utilisées dans des techniques de séparation comme la chromatographie liquide et l’électrophorèse capillaire (CE). C’est en effet en 1984 que Terabe et al. ont introduit l’électrophorèse capillaire en milieu micellaire (MEKC){5]. Cette technique a permis d’étendre le champ d’application de l’électrophorèse capillaire, puisqu’elle permet la séparation d’analytes non-ioniques grâce aux interactions entre l’analyte et les micelles, ce qu’il est impossible de faire en CE en solution libre (CZE). Cette méthode permet aussi d’améliorer l’analyse des composés ioniques, puisqu’il y a séparation selon leur degré d’hydrophobicité en plus de leur rapport charge/masse (seul mécanisme sur lequel repose la CZE). La détermination de Kas (aussi connue sous le nom de constante de partage) est essentielle dans cette branche de la chimie analytique, puisqu’elle permet de comprendre les mécanismes d’association analytes-micelles, facilitant ainsi le développement de méthodes de séparation en MEKC.
3 Ces dernières années, un vif intérêt s’est manifesté envers l’utilisation de polyléctrolytes comme phase pseudo-stationnaire en CE, afin de pallier aux faiblesses des surfactants conventionnels en MEKC{6-8]. Le grand éventail de structures chimiques que peut adopter les polymères permet théoriquement d’obtenir la sélectivité chromatographique désirée. Les polymères possèdent aussi une grande stabilité même si les conditions analytiques sont modifiées. Ils peuvent en effet, être solubles en présence ou en absence de solvants organiques. Afin d’obtenir un large éventail de migration des analytes, il est aussi possible de leur fournir une mobilité électrophorétique élevée. Les polymères doivent toutefois être monodisperses et avoir un transfert de masse rapide entre la phase pseudo-stationnaire et le tampon, afin d’obtenir des séparations efficaces.
Dans le domaine de la détermination de constantes d’association, Dubin et al. ont développé la technique FACCE (frontal Analysis Continuous Capillary Electrophoresis) capable de quantifier les interactions entre des polyélectrolytes synthétiques et des protéines[9-161. Cette technique ne s’applique toutefois qu’aux interactions ayant une cinétique très lente. D’autre part, Progent et al. ont développé une technique permettant de quantifier les constantes d’association entre des polyélectrolytes et des peptides ayant une cinétique rapide[17]. Finalement, Palmer et al. ont étudié la sélectivité de plusieurs copolymères formant des micelles unimoléculaires à l’aide d’une série d’analytes neutres[8, 18-21]. Il existe donc un grand vide dans la littérature au niveau de la détermination des Kas entre des peptides et des micelles polymériques, ainsi qu’au niveau de la compréhension de leur mécanisme d’association.
1.2
Calcul des constantes d’association
1.2.1 Électropliorèse capillaire
Le phénomène d’association entre un analyte et un agent micellant est bien connu en CE et a déjà été décrit en détail par le groupe de Chen[22-30]. L’interaction la plus simple et la plus commune rencontrée en CE entre un analyte A et un agent micellant C a une stoechiométrie 1 :1. L’association de deux molécules d’agent micellant avec un analyte peut se produire s’il y a plus
d’un site de liaison sur ce dernier. Toutefois, dans la plupart des cas par exemple dans celui des micelles de dodécyl sulfate de sodium (SDS) et de bromure de cétyltriméthylammonium (CTAB), des associations multiples se produisent rarement et elles ont donc une influence négligeable sur la mobilité de l’analyte. Un modèle décrivant des interactions 1 :1 a d’abord été utilisé. Un équilibre dynamique 1 :1 en CE peut donc être décrit selon:
A+CAC (1.1)
où AC représente l’association entre Ï’analyte et l’agent micellant. Les équations qui suivent sont applicables que si la cinétique de la réaction 1.1 est rapide. En effet, l’équilibre doit se faire plus rapidement que la séparation afin de pouvoir estimer les constantes d’association de la façon décrites dans les équations suivantes[31]. Les systèmes peptides-agents micellants étudiés dans ce travail rencontrent cette condition, contrairement à d’autres systèmes ayant des cinétiques lentes et demandant ainsi l’utilisation de méthode différente telle l’analyse frontale[32]. La constante d’association (Kas) est:
K = [AC] (1.2)
[A][C]
Lorsque l’analyte est dans sa forme libre, il a une mobilité électrophorétique, JtAaq, et lorsque l’analyte est lié, il a une mobilité
électrophorétique, tAC. La mobilité électrophorétique apparente de l’analyte,
1eff, est définie selon:
= fP-aq +(1— (1.3)
où
f
est la fraction d’analyte sous forme libre. Il faut noter que l’analyte ou l’agent micellant doit être chargé et qu’il n’y a pas de restriction sur le type de solvant qui est utilisé.La mobilité effective est aussi définie selon
PeJf /app (1.4)
où est la mobilité électroosmotique (dépend, par exemple, des propriétés du tampon) et est la mobilité apparente de l’analyte à une concentration d’agent
5 micellant donnée. Cette équation est utilisée afin de déterminer la mobilité effective de l’analyte de façon expérimentale.
Si la fraction de l’analyte libre
(J)
est définie comme [A]/[A]0, où [A]0 est la concentration initiale d’analyte avant l’association, la substitution de [A]0 par ([A]+[AC]) donne:[A] = 1
(1.5) [A]+[AC] 1+Kas[C]
En remplaçant
f
dans l’équation (1.4) par l’équation (1.5), la mobilité électrophorétique peut être décrite selon:* 1 Kas[C]
p4 + p (1.6)
1+Kas[C] q 1+Kas[C]
-L’équation (1.6) ne peut être utilisée directement, à moins qu’un facteur de correction de la viscosité du tampon soit pris en compte[22]. Un facteur de correction, y, a donc été utilisé (voir section 3.2.3) afin de normaliser les
mobilités électrophorétiques expérimentales. Comme la mobilité électrophorétique apparente normalisée, Iteff, est égale à VJleff, l’équation (1.6)
devient:
1 Kas[C]
vp.— p + PAc 1.7
eJj
l+K[C] A-aq 1+Kas[C] -L’équation (1.7) peut être réarrangée pour donner:
K[C]
(VPeff P4_aq)
1+Kas[C](tA P4-aq) (1.8)
Cette équation est utilisée pour les régressions non-linéaires où [C] est connue et l1eff et JtAaq peuvent être mesurées. L’inverse de cette dernière donne
une relation linéaire qui a été utilisée afin de mieux détecter la présence d’équilibre d’ordre supérieur[25, 27].
1 = 1 •1 + 1
(1.9) PJ-aq PAc P4-aq Kas[C] PA-c P4-aq
Ce modèle décrit adéquatement les interactions entre les micelles cationiques ou anioniques et les peptides.
+c
A k1 AC(1)c+c
AC(2) - AC2 k21Figure 1.1 Équilibre entre un analyte (A) ayant deux sites de liaison et un agent micellant (C) ayant un site de liaison.
Dans le cas où des interactions analyte-agent micellant 1 :1 et 1 :2 seraient présentes simultanément (voir figure 1.1), les équations doivent être modifiées afin de refléter la présence d’équilibre d’ordre supérieur. Les nombres entre parenthèses dans la figure 1.1 représentent les sites de liaisons sur l’analyte qui interagissent avec l’agent micellant, et les constantes sont les constantes d’équilibre microscopiques, où j et
j
représentent les deux sites de liaisons différents. L’analyte peut donc être libre (A), lié à un agent micellant au site 1 (AC(1)), lié à un agent micellant au site 2 (AC(2)) ou doublement lié (AC2(1,2)). Si la cinétique de la réaction est grande, la mobilité électrophorétique effective,1eff, est alors déterminée par la fraction de l’analyte de chacune des espèces (J) et
par la mobilité électrophorétique de chacune de ces espèces (ji)
VPeff =fAPA-aq + fA-c(1)PA-c(1)+fAc(2)PA-c(2) + fA-C2(1,2)PA-C2(1,2) (1.10)
Les fractions de chaque espèce sont définies selon:
f
A = 1 (1.11) 1+k1[C]+k2[CJ+k1k17[C]2 k1[C] (112) f,lc(1 — 1+k1[C]+k,[C]+ k2[C] (113) fAc(2) — 1+k1 [C]+k2 [C]+k1k12 [C]2 1 1 ti’-’72 ç “1”12 “—“] 1 14 JAC2(1,2) — 1+k1[C]+k2[C]+k1k12[C]27
f
k2k21[C]2— AC2(2,1)
— 1 +k1 [C] +k2 [C] +k1 k12 [C]2
L’insertion des fractions de chacune des espèces (équations 1.11-1.14) dans l’équation 1.10 donne:
PA-aq + (klpAc(j) +k2p4c(2) )[C]+k1k12P/-C,[C]2
vpe = (1.15)
1+(k1 +k2)[C]+k1k2[C]2
En général, les constantes d’équilibre observées sont la somme des constantes d’équilibre microscopiques provenant d’interaction de même ordre de grandeur. Il est donc impossible d’obtenir les constantes microscopiques individuelles lorsque l’effet de [C] sur la mobilité de l’analyte est observé. Les constantes obtenues sont donc appelées constantes macroscopiques ou stoechiométriques, puisque toutes les interactions ayant la même stoechiométrie sont regroupées ensemble. L’équilibre présenté à la figure 1.1 peut être
simplifié
Kasi Ka52 1 16
A+2CAC+CAC2
où les constantes d’équilibre macroscopiques(Kasi etKas2)sont définies par: Kas zk1 +k2 [AC(1)]+[AC(2)j [AC] (1.17) [A][C] [A][C] K = k1k12 — k,k,1 [AC2(1,2)] [AC2] (118) as2 k +k2 — k1 +k2 ([AC(1)]+[AC(2)])[C] [AC][C]
Les constantes d’équilibre macroscopiques ne décrivent pas une interaction spécifique, mais la somme de chacune des interactions possibles entre l’analyte et l’agent micellant à une stoechiométrie particulière. AC a aussi une mobilité macroscopique
= klPAC(l) ‘2PA-C(2) = [ACU)]pAc(l) +[AC(2)]pAc(2)
(119)
JAC
k1 +k2 [AC(1)]+[AC(2)]
La mobilité macroscopique de AC est une moyenne des mobilités microscopiques. En ce qui concerne AC2, les mobilités macroscopiques et microscopiques sont les mêmes, puisqu’il n’existe qu’une espèce ayant la stoechiométrie 1 :2.
$ Le remplacement, dans l’équation 1.15, des constantes microscopiques par les constantes macroscopiques donne
PA—aq +PA_CKasl[C]+ PA—C2KaslKas2[C]2
Vpjj= (1.20)
1 +Kasi[C]+KasiKas7[C]2
qui peut être réarrangée selon:
(l’A-c—PA-aq )Kasi [C] +(l’A-c2 —PA-aq )KasiKas2 [C]2
(VPeJïPA_aq)= (1.21)
1+Kasi[C]+KasiKas2[C]2
Cette équation a été utilisée afin de décrire les interactions peptides copolymères(2$].
1.2.2 Spectrophotométrie d’absorption
Afin de comparer les constantes obtenues par CE, la spectrophotométrie d’absorption a été choisie. Le modèle d’association 1:1 (voir équation 1.1) est aussi utilisé, puisque les systèmes peptides-micelles ont été étudiés dans des conditions similaires. L’équation générale de la constante d’association présentée à l’équation 1.2 est donc aussi utilisée en spectrophotométrie. Le paramètre expérimental qui subit un déplacement, lorsque la concentration d’agent micellant est augmentée, est la longueur d’onde au maximum d’absorbance provenant de la transition rcrt* des cycles aromatiques présents dans le peptide. En effet, ces transitions sont sensibles à la polarité du milieu qui entoure le noyau aromatique. La position du maximum d’absorbance est donc décrite par[33]
2obs f%A-aq + (]-J)%Ac (1.22)
oùjest la fraction de l’analyte libre. Cette valeur est définie par: [A]
rAi
j aq = L 1
(1.23) [A]01 [A]+[ACJ
Après réarrangement et substitution du rapport [AC]/[A] par la valeur tirée de l’équation 1.2, on trouve:
f=
(1.24)1+K[C]
En combinant les équations 1.24 et 1.22 on obtient:
as[ ]
OS
9 La fonction inverse est utilisée de façon analogue à celle utilisée dans l’étude faite par CE et elle se présente sous la forme:
1 = 1 1 + 1
(1.26)
‘obs —‘A—iq 2A—C —‘A—aq [C] ‘A—C —2A—aq
Le graphique résultant de l’équation 1.26 est connu sous le nom de tracé Benesi-Hildebrand[34].
1.3
Objectifs du projet
Notre groupe de recherche s’intéresse depuis plusieurs années à la séparation de peptides par CE et par MEKC, dans le but de faire l’analyse de biofluides et de médicaments, ainsi que de la cartographie peptidique et de la simulation d’interaction récepteur-membrane. La MEKC possède la capacité de séparer des peptides de structures similaires, grâce à de subtiles différences au niveau des constantes d’association qui sont basées sur les différentes interactions hydrophobes et électrostatiques entre les peptides et l’agent micellant. Plusieurs méthodes analytiques incluant la MEKC ont été développées afin de déterminer les constantes d’association, Kas, entre des peptides et des micelles. Toutefois, la fiabilité de la MEKC dans ce type d’étude n’a jamais été investiguée en profondeur. Le chapitre 2 de ce mémoire compare donc la technique MEKC à la spectrophotométrie d’absorption pour la détermination des Kas d’une série de trois peptides en présence de micelles anioniques et cationiques. Nous tentons d’identifier les raisons pour lesquelles différentes valeurs de Kas décrivant exactement les mêmes systèmes chimiques, ont été obtenues à partir des deux techniques utilisées.
Au cours de la détermination des Kas par MEKC, nous avons obtenu des résultats étranges lorsque nous tentions de calculer la CMC du SDS. Le chapitre 3 décrit donc en détail comment l’évolution des solutions de SDS en fonction de leur âge et la variation de viscosité en fonction de la concentration en SDS affectent la mobilité des peptides et donc, la valeur des Kas. Dans le chapitre 4, un regard en profondeur de la détermination des Kas par spectrophotométrie
d’absorption est réalisé, afin d’expliquer les différences entre ces Kas et ceux obtenues par MEKC avec la Met-enképhaline.
À
l’aide de la 3e dérivée du spectre UV/vis, nous étions capables de séparer la contribution de chacun des résidus aromatiques (phénylalanine et tyrosine) lors de l’association entre la Met enképhaline et les micelles.Les micelles formées de surfactants classiques sont un bon exemple d’agents qui peuvent être utilisés dans la séparation de peptides analogues. Récemment, plusieurs articles sont toutefois apparus sur l’interaction entre des micelles polymériques et des protéines et nous voulions voir si de tels composés pouvaient être utilisés afin de séparer des peptides par EKC. Le chapitre 5 décrit donc les efforts faits pour déterminer les Kas entre les copolymêres formés de 2-(acrylamido)-2-methylpropanesulfonate de sodium (AMPS), de N-dodecyl méthacrylamide (Dod) et de N-(1-pyrènylmethyl)méthacrylamide (gracieuseté du Dr. F. Winnik, Pharmacie et Chimie, Université de Montréal) et de petits peptides par la même méthode analytique utilisée au chapitre 2.
2. A comparison between electrokinetic
capillary chromatography and absorption
spectroscopy for the analysis of peptide
micelle association by weak hydrophobic
interactions”2
Adapted from:
Cari Hérnond, Aiexandra Ftirt5s-Matei and Karen C. Waldron, EÏectrophoresis, 24, 816-823 (2003)
Des données complémentaires sont données en annexe à la section 2.5
2
Abstract
Capillary electrophoresis (CE) is one of many techniques that can be used to determine the equilibrium associationldissociation constants for interaction between peptides and micelles. Since the relative binding strengths of a series of peptides are normally sought after, the reliability of a given method to determine absolute association constants is rarely considered, particularly because experimental conditions vary widely. Nonetheless, it is important to know whether equilibrium association constants, Kas, obtained by CE-based methods are meaningful by comparing them to values obtained by another instrumental technique, keeping in mmd that each method interrogates a different property and can thus bias the Kas estimation. In this study, micellar electrokinetic capillary chromatography (MEKC) was compared to absorption spectroscopy to estimate Kas for peptide-micelle systems involving three peptides (lcucine-enkephalin, methionine-enkephalin and leucine-phenylalanine: Leu-Phe) and two surfactant micelles (SDS: sodium dodecylsulphate and CTAB: cetyltrimethylammonium bromide). Buffer pH was chosen to minimize purely electrostatic interactions between peptides and micelles that could flot be interrogated by absorption spectroscopy and buffer ionic strength (—100 mM) was kept the same for both techniques. Viscosity-corrected MEKC mobilities gave reasonably similar estimates of Kas between the two methods for ail three peptide-SDS micelle systems, with Kas values ranging from 12 ± 3 to 38,6 + 0,7 M’. For the CTAB,
estimates of Kas for Leu-Phe-CTAB micelle association were of the same order of magnitude as the SDS micelle by the two methods of estimation. On the other hand, enkephalin-CTAB micelle binding was about 10 times stronger (Kas= 122 + 3 M’ to 311 + 9 M’) than the enkephalin-SDS micelle binding. In addition,
MEKC underestimated the Kas values relative to spectroscopy by a factor of 2 to 3 for the enkephaÏin-CTAB system.
13
2.1
Introduction
Numerous studies in the biosciences concem the interactions between micellar agents and biological molecules, in part because micelles can be used to mimic ccli membranes [35, 36]’. Many types of interactions (e.g., hydrophobic, electrostatic, hydrogen bonding, dipole induced, etc.) may be implicated during binding with micelles, which bas led to the exploitation of several physico chemical techniques aimed at understanding and quantifying these associations. The detemiination of equilibrium association constants, Kas, also termed binding constants [37], can be made by a variety of experimental approaches including chromatography [38, 39], NMR [40, 41], molecular spectroscopy [42, 43] and capillary electrophoresis [25, 32, 44]. A large portion of thc literature on determining Kas deals with graphical and statistical approachcs for correctly intcrpreting data and transfonning the binding isotherm for convenient analysis. There is littie information on how well thcse approaches compare to each other. However, if such estimations are to be of general use, discrepancy between values obtained by different techniques should be smaii and care shouid be taken to choose conditions that interrogate the same properties. At least, the binding trends determined by diffcrent techniques should be the same. Certainly, some approaches require the substrate to have specialised properties that change upon binding, like fluorescence intensity, which may not be strongiy correlated with a chemical shifi in NMR. The aim of the present work was to determine whether Kas for peptide-micelle associations estimatcd by capillary clectrophoretic (CE) methods are reliable by comparing them to estimations obtained by absorption (UV-visible) spectroscopy under the same conditions.
The rapid, high resolution separations afforded by CE-based techniques have made them an attractive method for peptide analysis. When Tcrabe’s group demonstrated micellar electrokinetic capillary chromatography (MEKC) in the mid-19$Os [5, 45], it was expected to rival liquid chromatography (LC) for the
analysis of amino acids and peptides. In reality, MEKC using charged micelles can be problematic for the separation of micelle mixtures of peptides [46, 47]; their zwitterionic nature leads to strong, yet non-specific, electrostatic interactions with charged micelles masking weaker hydrophobie effects that make reversed phase LC selective. This underlines the importance of solution pH. If the interactions quantffied by Kas are to be probed in parallel by absorption spectroscopy, the peptide (analyte) needs to contain an aromatic chromophore and solvent conditions need to favour the change in either energy or intensity of thenit* transitions of the chromophore upon association with the micelle.
Several reviews have appeared over the last decade on using CE-based methods to determine association constants [1, 32, 39] as well as papers describing the need for viscosity correction factors [22, 44]. In affinity CE methods, an obvious shifi of electrophoretic mobility is observed as a function of binding agent (i.e., ligand) concentration. The double-reciprocal or other linear transformation of the binding isotherm is then plotted taking into account the variation in separation buffer viscosity upon addition ofbinding agent. A classical way to determine association constants using absorption spectroscopy is to monitor the change in molar absorptivity at a local absorbance maximum of the analyte as a function of the concentration of binding agent [34, 48, 49]. Essentially, the sensitivity of the 7t7t* transition to the polarity of the surrounding
environment is monitored. Similarly, a subtle wavelength shifi in the absorbance maximum for analyte chromophores that interact with the ligand can be used. Woolley and Deber [35] proposed that a 1-nm bathochromic (red) shifi in 2max of the phenyl residue in the spectrum of substance P in the presence of SDS micelles resulted from the local environment of the aromatic groups having changed from hydrophilic to hydrophobie. On the other hand, the phenomenon of a detectable wavelength shifi has flot been observed for all peptide-micelle systems. It has been noted that interactions ofpeptide with SDS micelles are mostly electrostatic in nature with hydrogen-bonding possibly implicated, particularly for peptides of 7 residues or larger [3$]. Nonetheless, when at least a slight shifi in 2’rnax occurs as a result of peptide-micelle association, this parameter can be precisely measured
15 using derivative spectroscopy (1st or 3rd order, where a zero-crossing corresponds to a local absorbance maximum [50, 51]) compared to measuring an absorption shift that is sensitive to small volume changes and thus less precise.
Using the general model of the binding isotherm [1, 27, 32, 34, 44] and assuming 1:1 peptide-micelle association for small peptides [40, 43, 52], we examine here the differences between Kas obtained using spectrophotometric and
electrophoretic data and identify the interactions that may explain the observed differences. The two surfactants used in this study are common additives for MEKC: SD$, which fomis anionic micelles and thus mimics phospholipid membranes, and cetyltrimethylammonium bromide (CTAB), which forms cationic micelles. The peptides included two small neuropeptides (Met enkephalin and Leu-enkephalin) and a dipeptide (Leu-Phe), ail chosen because of their apparent simplicity of interaction with micelles and the presence of an aromatic chromophore. To probe relatively weak hydrophobie interactions that wouid permit acquisition of spectral data to estimateKas, buffer pH was carefully chosen for each miceliar system.
2.2 Materials and methods
2.2.1 Materials
Leu-Phe (purity > 99 %) was purchased from Bachem (Torrance, CA,
USA). Leu-enkephalin (purity: 98 %), Met-enkephalin (purity: 98 %), SDS (purity> 99 %) and CTAB (purity 99 %) were obtained from Sigma-Aidrich Canada (Mississauga ON, Canada) and used without further purification. Monobasic and dibasic sodium phosphate were from Anachemia (Montreal, QC, Canada). Phosphoric acid was purchased from A&C Chemical (Montreai, QC, Canada). In-iaboratory distiiied water was passed through a four-cartridge Milli
Q
water purification system (Millipore Canada, Nepean, ON, Canada) and used to prepare ah buffer, sampie and rinse solutions. Fused-silica (f.s.) capillary tubing was purchased from Polymicro Technologies (Phoenix, AZ, USA). Nylon syringe2.2.2 Buffer and sample preparation
Stock peptide solutions (1 mg/ml) were prepared in water and stored at -20°C. Analyte mixtures were diluted in buffer (background electrolyte) to give a final concentration for each peptide of approximately 0.6 mM for MEKC studies and 0.2 mM for absorption spectroscopy measurements. Peptides were identified in electropherograms by spiking the mixture. Spectroscopic measurements were made with individual peptides.
Background electrolyte buffers at pH 4.1, 7.0 and 8.1 were prepared by mixing monobasic and dibasic sodium phosphate solutions then titrated to the desired pH with a few microliters of phosphoric acid or sodium hydroxide to give an ionic strength close to 100 mM (e.g., pH 4.1, I = 110 mM: 110 mM NaH2PO4,
24 iii H3P04; pH 7.0, I 94 mM: 19.5 mM NaH2PO4, 30.4 mM Na2HPO4; pH 8.1, I = 106 mM: 1.8 mM NaH2PO4, 36.1 mM Na2HPO4). Stock solutions of
CTAB and SDS were prepared in water and added to the appropriate background electrolyte to give final concentrations ranging from 10 to 50 mM. Estimation of the critical micelle concentration (CMC) for each surfactant is described in section 3.2.2.
2.2.3 Absorption spectroscopy methods
Absorbance spectra were acquired on a Cary-100 Bio UV-Visible spectrophotometer (Varian Instruments, Mississauga, ON, Canada) in double beam mode. Scans were made from2max — 10 fliTi to 7max + 10 fliTi (2rnax is 276 mTi for enkephalins and 25$ nm for Leu-Phe) at a scan rate of 15 nm/min) To deterrnine max accurately, either the 1st or 3rd derivative of the acquired spectral
data was used (standard deviation ranging from 0.01-0.05 nm was obtained on every single 7max determined), both of which correspond to an abscissa intercept
(zero-crossing) as a function of wavelength [50, 51]. The spectral data and
particularly the derivative spectra were so noisy that multiple zero-crossings occurred in the region of max• Therefore, many data smoothing routines were
investigated to improve the precision in the determination and Table 2.1 summarizes the best five of these. In the first scenario, Or” order spectra were exported to an Qrigin® spreadsheet (Microcal Software Inc., Northampton, MA, USA) and the 1st derivative with various smoothing routines ofthe spectrum was applied (first three rows of Table 2.1). In the second scenario, the Cary WinUV® software (Varian Instruments) was used to calculate and smooth the 15t
or 3td derivative spectra (last two rows of Table 2.1). Spectral noise was proportional to the order of derivatization, thus 1st derivative methods gave the best results. Adjacent averaging (13 points) of exported data using Origin either before or afier calculating the 1st derivative lcd to the same precision. Regardless of the routine, data smoothing produced a small shifi in 7max depending on the number of points used, as expected. However, because the relative change in 2max was
used to estimate the association constant (see Eq. (2.1) below), this systematic shift cancelled out.
To estimate the peptide-micelle equilibrium association constants from shifis in max as a function of binding agent (micellar surfactant) concentration, the general 1:1 binding isotherm was linearly transformed into the following double-reciprocal form: 1 1 1 1 ________ = _________ . + (2.1)
2obs —k4—aq aA_C —211—aq K [C] ‘A—C —‘A-aq
where 2Aaq is the wavelength of maximum absorption (2max) of the analyte A (the
peptide) in buffer in the absence of micelles, 2obs is the observed 2max in buffer solutions of varying binding agent, C, concentration ([C] = [surfactant] — CMC, [44]) and 2A-C is the truc 7’max of the analyte associated to micelles, whose value
does not need to be known. A plot of ]/( % —)4-aq) versus ]/[C] yielded Kas as the y-intercept/slope, determined using a weighted linear regression (values represented by errors bars were used as weight). Spectra were recorded on three portions of the same solution for each surfactant concentration studied and the
mean J/(Àobs — tA-aq) value was plotted with error bars representing the standard deviation of the three measurements.
2.2.4 Capillary electrophoresis mcthods
Electrophoretic experiments were performed using a Beckman Coulter PlACE MDQ CE system (Fullerton, CA, USA). Electropherograms were monitored at 2 = 200 nm for SD$ experirnents and 235 nm for CTAB.
Separations were carried out in a 50 jim ID f.s. capillary having a 40.1 cm effective length and 50.1 cm total length. Samples were injected by applying a pressure of 0.3 psi (2 kPa) for 5 s. The applied separation voltage was 25 kV (either positive or negative, depending on the surfactant used). The measured current (absolute value) ranged from 75.6 to 76.2 tA, in the absence of surfactant, for all three buffer pHs studied. The CMC for SDS and CTAB at each pH were determined by piotting the electrophoretic current as a function of surfactant concentration and extrapolating the linear regions below and above the CMC to their intersection. Resuits were as follows: for SDS in pH 7.0 buffer at 20°C, CMC 3.3 mM; for SDS in pH 8.1 buffer at 33°C1, CMC = 4.5 mM; for CTAB
in pH 4.1 buffer at 25°C, CMC = 0.8 mM. The micellar aggregation number was
not used to calculate the literai concentration of micelles as described in previous reports [38, 53] because the relative, not quantitative, values ofKas were desired.
The CMC and micelle structures were assumed unchanged upon association with the peptides, as shown for similar studies [38, 40].
Before daily use, the capillary was flushed with 0.1 M NaOH for 10 min followed by water for 5 min and buffer for 10 min. Before each nrn, the capillary was preconditioned for 1.5 min with 0.1 M NaOH and subsequently with the running buffer for 5 min. The only exception was the rinsing procedure for CTAB experiments, made as follows: 0.1 M NaOH for 1 mm, water for 1 mm, 0.1 M H2S04 for 2 min and then running buffer for 5 min. Buffer solutions were passed through a syringe filter just before use in the CE instrument. Dimethyl sulfoxide
19 (0.2 % v/v) or acetone (3 % v/v) was added to the samples to serve as the electroosmotic flow (EOF) marker.
for each surfactant concentration studied, electropherograms were run in triplicatet. The apparent mobffity was calculated by the 32 Karat® software (Beckman Coulter) using the actual capillary length and the average value of the applied voltage from the beginning of the run to the migration tirne (i.e., the voltage is ramped to 25 kV dunng the first 12 s of the run then held constant). Apparent mobilities were convertcd to effective mobility by subtracting the mobility of the EOF marker. To estirnate peptide-micelle Kas from the rnobility shifts as a function of micellar surfactant concentration, the following transformation, analogous to Eq. 2.1 was used:
1 = 1 1 + 1
(2.2)
VPeff P4-aq PAC —P K5[C] /1A-C PA-aq
where y is the viscosity correction factor [22] (values of y were from 1.019 to
1.07$ for increasing concentrations of SDS with relative errors ranging from 0.2-0.6 %, for CTAB solutions, values of y ranged from 1.013-1.096 with relative
errors ranging from 0.2-0.4 %), uAaq is the effective mobility of the peptide in
buffer in the absence of micelles, ieffis the observed effective mobility in buffer
solutions of varying surfactant concentration,,1A—Cis the true effective mobility of
the peptide associated to micelles, whose value does flot need to be known, and C is the binding agent (surfactant concentration in the micelles). Error on the left hand side of Eq. 2.2 was calculated according to the propagation of enor approach. In the case of Kas, the error was calculated based on the propagation of the errors on the siope and Y-intercept obtained from the linear regression.
The viscosity correction factor was calculated as follows. A plug of analyte was injected at the capillary inlet and a constant pressure applied. The CE system uscd in this study had a lag period of 0.15 min between the signal to apply a pressure and the moment when I psi (7 kPa) was fully reached. This time lag was subtracted from the rneasured analyte elution time [23]. The viscosity
Voir lafigure2.4 pour un exemple graphique du déplacement du temps de migration en fonction de la [SDS]
correction factor was then obtained by dividing the elution time of analyte at a given surfactant concentration by the elution time obtained in buffer without surfactant. A weighted (weight assigned by Origin® 6.0 based on the error caiculated for each surfactant concentration, [C], ran in triplicate) linear regression was used to caiculate Kas from the intercept and siope of a plot of
l/(VPeff iUAaq) versus J/[C], analogous to the case for absorption spectroscopy.
Temperature was carefuily thermostated in the two analytical techniques. It was assumed that association constants couid oniy be compared if the solution temperatures inside the capillary and cuvet were identical for the two methods. However, association constants estimated by MEKC increased by less than 20% in going from 30 to 15°C. Therefore, it was deemed unnecessary to determine the internai capillary temperature and record spectroscopy data at that value.
2.3
Resuits and discussion
As stated in the introduction, it is important to know whether one analytical method biases Kas relative to another (e.g., MEKC versus absorption spectroscopy) for a given peptide-micelle association. In addition, it is important that the data acquisition and treatment do flot prejudice Kas estimates. The wavelength shifi of the absorption maximum due to peptide-micelle association was typically less than 1 nrn so the position of 2max as a function of rniceiiar surfactant concentration had to be deterrnined as precisely as possible. From the resuits in Table 2.1, we decided that 13-point adjacent averaging of the 1st derivative absorbance spectrnm was one of the best method to obtain 2max of the
free peptide and peptide associated to micelles. An example of the double reciprocal transformation of the binding isothenn, given by Eq. 2.1, was piotted for Met-enkephaiin-CTAB micelle association (Fig. 2.1). The weighted linear regression gave an estimate ofKas= 213 + 9 M’. Data treatment by a non-iinear
fit to the binding isotherm using Eq. 1.7 or 1.25, gave Kas values in good agreement with the double-reciprocai method (data not shown), but the standard deviation Ofi Kas was siightly higher, particularly in the case of the enkephaiin
21 importance is given to data points that have high standard deviations, unlike the case of weighted linear regression)
Analogously, Fig. 2.2 shows the double-reciprocal plot of MEKC mobility data as a function ofCTAB concentration in the micelles, given by Eq. (2.2), used to estimate Kas. Even though effective mobilities were plotted, the increasing buffer viscosity with surfactant concentration was confirmed to be an important variable in Eq. (2.2). For example, without using the viscosity correction factor,
Kas was overestimated by a factor of 1.3 (same absolute error).
Table 2.1 Summary of different methods used for the derivative spectrum calculation and data smoothing to obtain‘ 2
rnax
Software Parameters max (nm) s (nm)a
Microcal jst
derivative, adjacent averaging of 13 pts 257.916 0.011 OriginV. 6.0 derivative, Savitzky-Golay
(2 order polynomial; 6 points to lefi and right) 257.901 0.016
1st
derivative, Differentiate/Smooth
(2d
order polynomial; 6 points to lefi and right) 257.910 0.013 Cary WinUV ]st
derivative, Savitzky-Golay
257.898 0.017 (Filter Size= 13; Interval = 0.1 nm)
3rd
derivative, Savitzky-Golay
(Filter Size= 27; Interval = 0.1
)
257.862 0.024a
Standard deviation of four measurements. Analyte is Leu-Phe, 0.2 mM.
Table 2.2 presents the equilibrium association constants for the three model peptides with the two surfactants as estimated using the MEKC and absorption spectroscopy techniques. f values calculated using variances of binding constant[54] are also presented. Kas values estimated by the two methods for SDS micelle binding were the same order of magnitude given the difference in physico chemical parameter measured by each method. Since the calculated values of F (table 2.2) in the two-tailed F-test (P=0.05) for the companson of
Voirfigure2.6 pourun exemple de régression non-linéaire
2
standard deviations are less than the critical value (f2,2 = 39.00), there is no
significant differences between the variances of the two techniques{54]. Therefore, it is appropriate to proceed with a comparison of the values of Kas obtained for the two analytical techniques. The relatively low binding constants indicate that there was little or no inclusion of aromatic side chains into the hydrophobie core of the SDS micelle. This observation is in agreement with the hypothesis made by Hicks et al. [4] that the hydroxyl group on tyrosine (Tyr) may be repelled from the hydrophobie core of the negatively charged SD$. They showed by NMR that in 50 mM SDS, Met-enkephalin adopts a -tum conformation that is stabilized by an intramolecular hydrophobie interaction of Tyr and phenylalanine (Phe), with little detectable insertion of either aromatic side chain into the hydrophobie core of the SDS micelles [3]. This conformation placed the N-terminal amine and all five carbonyl oxygens on an outer hydrophilic face and placed the amide protons on the inner hydrophobie face near the aromatic side chains. NMR diffusion coefficient studies of peptide-SDS micelle binding for Leu-enkephalin and its various composite peptides by Deaton et al. [40] also showed littie or no association of Tyr-containing dipeptides with SD$ micelles, supporting the observation of Hicks’ group. Association of the enkephalin peptides with $D$ micelles is thus primarily a result of hydrophilic and/or electrostatic interactions. In their study of peptide-micelle binding for slightly larger peptides, Lu and Lundahl[38] indicated that hydrogen bonding as well as hydrophobie and electrostatic interactions participate in the association. We previously observed behavior consistent with strong eleetrostatic interactions in MEKC studies of enkephalin analogs [47]. Binding to $DS micelles inereased (observed as shifis in the absolute electrophoretic mobility) as pH deereased from 8.9 to 5.4 (pI = 5.4) because the protonated N-terminal amine interacted with the
anionic micelle.
Interestingly, the enkephalin-SDS micelle Kas values estimated by the two techniques are very similar for different reasons. Hydrophilie interactions between enkephalin peptides and $DS micelles underlie the MEKC mobility shifts. On the other hand, a decrease in the n-.n energies of the Tyr and Phe
23 aromatic side chains due to intramolecular stacking as a consequence of hydrophilic association with SDS micelles led to the shifis j rnax The same
trend in peptide-SDS micelle binding was thus seen between electrophoretic and spectroscopic estimates of Kas. Higher Kas values (130 + $ M’) than our,
obtained at a more acidic pH (5.4) by Deaton et aÏ.[401 for Leu-enkephalin-SDS system, seem to suggest a strong pH dependence of peptide association constants. Table 2.2 Comparison of MEKC and absorption spectroscopy for the
estimation ofpeptide-rnicelle equilibrium association constants, Kas1 Ligand a Analyte Kas (M1) by MEKC Kas (M1) by
Spectroscopy LF 49±1 35±5 SDS micelle YGGFM 21.1±0.8 13.7±0.3 YGGFL 31.4±0.7 33±3 Lf 25.9±0.8 15±2 CTABmicelle YGGFM 122±3 213±9
from the MEKC estimate in Table 2.2, Leu-Phe appears to bind SDS micelles (Kas = 38,6 ± 0,7 M1) more strongly than the enkephalins. This is
probably caused in part by the different temperature used, but it seems to be also caused by the pH dependence rnentioned above, since pH 7.0 was used for Leu Phe-SDS micelle studies versus pH 8.1 for the enkephalin studies, giving the latter less cationic character. On the other hand, Kas estimated spectroscopically for Leu-Phe-SDS micelle association demonstrated the same binding strength as Leu-enkephalin-SDS micelle and was 1.4 times lower than the MEKC estimate. This discrepancy might be explained as follows. The Leu side chain of Leu-Phe is
YGGFL 155±7 311±9
Background electrolyte conditions: 20°C, pH 7.0 for LF (Leu-Phe)-SDS micelle studies; 33°C, pH 8.1 for YGGfM (Met-enkephalin) and YGGf L (Leu-enkephalin)-SDS micelle studies; 25°C, pH 4.1 for ail CTAB micelle smdies.
slightly more hydrophobie than Phe [55], and might preferentially interact with the hydrophobie core of the $DS micelle, aided by electrostatic attraction from the N-terminus to which it is attached. This type of association would lead to an electrophoretic mobility shifi but flot readily to a large wavelength shifi since the environment around Phe was flot significantly modified. This is a peptide sequence effect [38], supported by results from Deaton et al. [40] who estimated Kas = 69 ± 6 M’ for Phe-Leu-SD$ micelle association, twice the value we
obtained (26 ± 2 M’); the hydrophobie residue closest to the partially protonated
N terminus is the most likely to interact with the hydrophobie micelle core.
0.7
1 /[C] (M1)
Double-reciprocal plot and weighted linear regression for the estimation of Kas by absorption spectroscopy for Met-enkephalin association with CTAB micelles. The concentration of CTAB in the micelles (complexing agent) was calculated as follows: [C] = [CTAB]totaj - 0.8 mM. The CTAB concentration ranged from
10 to 50 mM in sodium phosphate background electrolyte with total buffer ionic strength of 110 mM, pH 4.1, at 25°C. Analyte (YGGFM) concentration was 0.2 mM. The value of 2max (i.e., 7obs)
was approximately 275 nm. Error bars represent the standard deviation of 3 replicate measurements. The correlation coefficient of the regression was R2 = 0.998 and Kas= 213 + 9 M1.
1.1 1.0-E C 0,9. 08 Figure 2.1 I ‘ I I I I I 20 40 60 80 100 120
25
To induce strong associations between peptides and SDS micelles, Wooley and Deber [35] showed that positively charged amino acids such as arginine (Arg) and lysine (Lys) need to be present. We also observed this in a previous study; association constants for Lys-Phe-SDS micelles were 160 M’ and 140 M’ determined by MEKC and absorption spectroscopy, respectively, in pH 7.0 sodium phosphate buffer [33]. Error in these resuits was not determined. According to Young et al. [36], substrate-ligand collision triggered by
(N E o V) > C. w s— 8500 -8000 -7500 -7000 -6500 -6000. 5500 -5000. 4500. 4000.
o
Figure 2.2 20 I I I I 60 80 100 120 40 1/[C] (M1)Double-reciprocal plot and weighted linear regression for the estimation of Kas by MEKC for Met-enkephalin association with CTAB micelles. The concentration of micellar CTAB and the background electrolyte were the same as in Fig. 2.1. Separations were carried out at 500 V/cm, 76.5 1iA, with detection at 235 nm. Analyte (Met-enkephalin) concentration was 0.3 mM. Error bars represent the standard deviation of 3 replicate electropherograms. The correlation coefficient ofthe regression was R2= 0.999 and Kas = 122 ± 3 M*
electrostatic attraction in addition to random molecular motion is necessary to facilitate hydrophobie interactions. Ironically, our desire was to eliminate electrostatic interactions that would bias Kas estimates determined by absorption spectroscopy.
Lu and Lundahl [38] have stated that the surface structure and charge of micelles are important for the interaction with peptides, which may explain why the enkephalin peptide-CTAB micelle apparent association constants determined in our study (Table 2.2) show large differences between the two measurement techniques and also in comparison to SD$ binding. For example, whereas Leu Phe was more strongly associated with SD$ micelles than the enkephalins by MEKC measurement, it was the weakest with CTAB micelles by a factor of five. On the other hand, Leu-Phe association with either SDS or CTAB micelles determined by MEKC or spectroscopy were similar, ranging from 15 to 39 M1. This suggests that a small hydrophobie peptide does not discnminate with respect to the surface or charge of the micelle. The opposite was observed for the enkephalins. By MEKC measurement, a five-fold stronger association of the two enkephalin peptides with CTAB versus SDS micelles was seen and, by spectroscopy, this difference was 9- and I 5-fold for Leu-enkephalin and Met enkephalin peptides, respectively.
In the case of the enkephalin-CTAB micelle systems, a 1-nm bathochromic (red) shifi in 2max centred around 275 nm was observed between O and 10 mM CTAB, corresponding to the tyrosine t-it transition and thus a
change ofthe chromophore to a more hydrophobie environment [35]. The higher Kas estimate observed for enkephalin-CTAB micelle binding versus $DS micelles imply that the former is a result of strong hydrophobie interactions as well as electrostatic and hydrophilic attractions at the micelle surface. At pH 4.1, the peptides and CTAB micelles are both net positively charged, although the enkephalin peptides still possess residual anionic character since more than 90% of the C-terminal carboxylate is deprotonated at pH 4.1 (pI 5.4 for Met enkephalin and Leu-enkephalin). This anionic character could provide enough initial electrostatic attraction between the enkephalin peptide and CTAB micelle
27 to facilitate inclusion of the aromatic side chain into the hydrophobic core of the micelle. Further experiments at a lower buffer pH would be necessary to confirm this. Induced-dipole interactions between the tyrosine OH group and CTAB surface may also contribute to the observed stronger association versus that with SD$ micelles. The observed two-fold increase in enkephalin peptide-CTAB micelle affinity measured by absorbance spectroscopy versus MEKC is, however, more difficult to explain.
The dynamic nature of the MEKC experiments may impede electrostatically-induced collision [36] between the peptide and micelle, which in turn would hinder inclusion of the Tyr side chain into the hydrophobic core of the micelle. It is also possible that CTAB monomer-micelle equilibrium is strongly affected by the electric field, disrupting micelles to some extent during MEKC. Peptide-micelle association is independent of the method used to quantify it. Therefore, it is equally justified to question whether the absorbance spectroscopy method overestimated Leu-enkephalin-CTAB micelle association (Kas = 311 ± 9
M’). The large 1-nm wavelength shifi for Leu-enkephalin absorption in going from no micelles (2A-aq) to the presence of CTAB micelles (?obs) might lead to
higher Kas estimates if inclusion of the Tyr side chain in the micelle was short lived yet led to a strong signal during that brief period. It is hard to see how MEKC might underestimate the association constants for the two enkephalin peptides with CTAB micelles because any chemical or physical association should lead to an electrophoretic mobility shifi, regardless of the nature of the association. It is possible that the surfactant concentrations studied should have been in the range of 1 to 20 mM given that CMCCTAB = 0.8 mM under the
experimental conditions. However, this modification would presumably affect MEKC estimates of Kas in more-or-less the same way. Studies on peptide-CTAB micelle associations using different concentration ranges and enkephalin peptide analogs as well as a study on the temperature dependence may help elucidate the discrepancies seen in Table 2.2. The possibility ofPhe side chain inclusions in the micelle or at least a change in its enviromnent upon association should also not be ruled out, although this wouÏd be difficult to monitor at