HAL Id: hal-03094941
https://hal.archives-ouvertes.fr/hal-03094941
Submitted on 7 Jan 2021HAL is a multi-disciplinary open access
archive for the deposit and dissemination of sci-entific research documents, whether they are pub-lished or not. The documents may come from teaching and research institutions in France or abroad, or from public or private research centers.
L’archive ouverte pluridisciplinaire HAL, est destinée au dépôt et à la diffusion de documents scientifiques de niveau recherche, publiés ou non, émanant des établissements d’enseignement et de recherche français ou étrangers, des laboratoires publics ou privés.
DFT-Based Cu(111)||Cu 2 O(111) Model for Copper
Metal Covered by Ultrathin Copper Oxide: Structure,
Electronic Properties, and Reactivity
Fatah Chiter, Dominique Costa, Vincent Maurice, Philippe Marcus
To cite this version:
Fatah Chiter, Dominique Costa, Vincent Maurice, Philippe Marcus. DFT-Based Cu(111)||Cu 2 O(111) Model for Copper Metal Covered by Ultrathin Copper Oxide: Structure, Electronic Properties, and Reactivity. Journal of Physical Chemistry C, American Chemical Society, 2020, 124 (31), pp.17048-17057. �10.1021/acs.jpcc.0c04453�. �hal-03094941�
A DFT-Based Cu(111)||Cu
2
O(111) Model for
Copper Metal Covered by Ultrathin Copper
Oxide: Structure, Electronic Properties and
Reactivity
Fatah Chiter,
∗Dominique Costa,
∗Vincent Maurice, and Philippe Marcus
PSL University, CNRS – Chimie ParisTech, Institut de Recherche de Chimie Paris/Physical Chemistry of Surfaces Group, 11 rue Pierre et Marie Curie, 75005 Paris,
France
E-mail: fatah.chiter@chimieparistech.psl.eu; dominique.costa@chimieparistech.psl.eu
Abstract
In many applications, metallic copper can be covered by an ultrathin native or a passive oxide film depending on the redox conditions of the interface formed with the environment, which governs its surface properties. In the present work, we con-structed and optimized through quantum chemical DFT calculations a model of this Cu(111)||Cu2O(111) stoichiometric oxide supported in parallel epitaxy on Cu(111) substrate. Energetic analysis of the metal-oxide interface shows the stable forma-tion of the interface between oxide film and metal substrate. The Cu2O(111) film binds to the Cu(111) surface via the unsaturated oxygen atoms bonded to copper metal atoms in top, bridge and hollow sites. Structural analysis of the Cu2O(111) film surface shows reconstruction with modifications of the distances between the unsatu-rated and the satuunsatu-rated copper atoms. The surface interlayer relaxation is inward for
Cu(111)||Cu2O(111), whereas it is outward for the non supported Cu2O(111) oxide, and converges to that of bulk oxide with increasing the Cu2O(111) thickness. The elec-tronic work function is not significantly modified with respect to the Cu(111) elecelec-tronic work function, whatever the oxide thickness. The hydration of the surface is energeti-cally favorable and water molecular adsorption is favored over dissociative adsorption. Water molecules chemisorb on top over unsaturated copper atoms. The hydroxylation of the surface shows two adsorption modes of the OH groups on top over unsaturated Cu atoms and on bridge site between unsaturated and saturated Cu atoms.
Introduction
The formation, chemical composition and structure of a surface oxide film is crucial in important technological processes based on surface properties, such as corrosion protection,1 energy conversion2 and catalysis.3,4 The presence, composition and structure of an oxide overlayer on metallic substrate is determined by the redox conditions of the interface formed with the environment. On copper in aqueous environmental conditions, the formation of a protective anodic oxide depends on the nature of the electrolyte, pH, potential of solid-liquid interface, immersion and polarization time.
For some decades theoretical works have been performed to better understand the struc-ture of metal surfaces and their electronic properties and reactivity for a variety of applica-tion domains,5–7 ranging from heterogeneous catalysis to corrosion protection. One of the prerequisite conditions for a relevant theoretical approach is that the modeled system is rep-resentative of the experimental conditions. For surfaces, the chemical and structural state of the surface layers plays a key role in the reactivity and it is mandatory to model properly the surface terminations.
In the case of copper, the surface has been shown to be in the metallic state in acidic solutions (pH < 5),8,9 due to the fast dissolution of the oxide, and also in alkaline solutions
alkaline solution of pH 8 or 10 at potential E < -0.90 V,10 in 0.1 M NaOH solution of
pH 13 at -0.675±0.02 V/SHE11 and at potential E < -0.75 V.12 Under these conditions, a
theoretical model composed of a Cu(hkl) metal slab is appropriate to investigate adsorbate-copper interactions at the atomic scale.12,13
In contrast, at pH > 5 and in the overpotential range of copper oxide formation, copper is covered by an anodic oxide film of Cu2O or Cu2O/CuO depending on potential. This
oxide film is generally ultrathin, ranging from 1 to 4 nm depending on the experimental conditions. The oxide thickness has been estimated experimentally to be < 4 nm in 0.1 M KOH alkaline solution,14 2.2±0.3 nm in 3 wt.% NaCl neutral solution15 and to not exceed
1.4 nm in 0.1 M phosphate buffer solution of pH 7 and 8 and in borax buffer solution of pH 9.2.16 In 0.1 M NaOH solution of pH 13, at potential E = 0.75,1,17 a duplex film is formed
on Cu(111), with an inner layer of Cu2O(111) oxide 1-1.6 nm thick and a mixed outer layer
of CuO/CuOH about 2-4 nm thick. At potential ≤ -0.25 V, the thickness of Cu2O is below
7 monolayers.1,5
In order to describe the available experimental data at the atomic scale with theoret-ical models of the oxidized surface, several groups used non supported Cu2O(111) oxide
surfaces,18–20 obtained by cleavage of the bulk Cu
2O oxide structure. This approach is
ade-quate when the oxide on top of the metal is thick enough to have the electronic properties of the bulk oxide. Therefore, one can neglect the underling metal part and only investigate the adsorbate-oxide surface interactions.
This theoretical modeling approach may not be appropriate to study the adsorbate-substrate interactions when copper is covered by an ultrathin oxide layer. Most of the theoretical models of oxidized copper found in the literature which are related to the for-mation of the oxide on the copper metal are focused on the adsorption of oxygen on the Cu(111) surface. Using a model consisting of a Cu(111) slab covered by a single CuOx oxide layer,21 Gharachorlou et al. have shown that TMA (trimethylaluminum) adsorption
the deposition of potassium impacts the surface electronic structure with a CuxO/Cu(111) (x≤2) model and the results agreed with STM measurements. The structural model for the “29”-structure of CuxO/Cu(111) was studied by DFT and STM techniques over a range of scanning biases.23,24 The “29” oxide acts as a precursor to bulk oxidation and the phase
diagram shows that when the O chemical potential is high enough, bulk Cu2O(111) oxide formation takes place and it is the preferred species.23 Park et al. studied the adsorption of molecular fragments of pyromellitic dianhydride oxydianiline (PMDA-ODA) on pristine and mildly oxidized Cu(111) surfaces.25 A model based on the mismatch-overlayer structure of the (111) faces of Cu2O and the Cu was proposed by Jensen et al.26 Yang et al.27 used
the structural model of the Cu2O(111)-like monolayer on Cu(111), with two types of
oxy-gen species, chemisorbed oxyoxy-gen and lattice oxyoxy-gen within Cu2O. Soon et al.28 studied the
chemisorption of oxygen and the thermodynamic stability of the surface oxide on Cu(111). Their phase diagram (P,T), shows that the oxygen proceeds directly to the formation of a surface oxide structure and to the bulk oxide phase, which is in the line with experimental observation.
The growth and surface properties of cuprous oxide films depend on the support used.29–32
The underlying metal layers can impose a strain to the oxide surface that can affect the surface reactivity of the ultrathin copper oxide film. The oxide thickness can affect the re-activity.33 In the presence of an adsorbate, the growth of the oxide layer can be limited. An
XPS surface analysis revealed that the chemical surface state of the copper surface is very different in the absence or presence of a self-assembled monolayer of 4-fluorobenzenethiol (4-F-BT) pre-adsorbed on copper.34 Without pre-adsorption the surface is typical of CuO and Cu(OH)2, whereas after 4-F-BT pre-adsorption, it shows the absence of Cu2+ and
sug-gests the possible presence of Cu2O traces as inferred from the analysis of the Cu Auger
spectra at 570.4 eV. Recently, the pre-adsorption of 2-mercaptobenzothiazole (MBT) and 2-mercaptobenzimidazole (MBI) corrosion inhibitors at ultra low pressure on Cu(111) has been shown to markedly retard the oxidation kinetics.35–37
The choice of the metal/oxide interface model is of outermost importance, as many prop-erties including corrosion resistance are related to the composition and electronic propprop-erties of this interface.29 So, it is very important to elaborate the most realistic interfacial model.
This is the reason why we have recently used a model of oxidized Cu consisting of Cu2O(111)
in parallel epitaxy on Cu(111), in order to study by Density Functional Theory (DFT) the adsorption of MBT, a known corrosion inhibitor, on the oxidized copper surface.38
Here we detail the construction of this epitaxial Cu(111)||Cu2O model. We discuss the
construction of the model, the oxide/metal interface, the oxide surface relaxation and the electronic properties. The reactivity with water and OH groups is also studied and compared to results obtained on non supported Cu2O(111) oxide surfaces from the literature.
Methods
DFT was used with the periodic plane-wave basis set code VASP (Vienna Ab initio Simula-tion Package).39–42 All results reported have been obtained with projector-augmented-wave
potentials using a 450 eV plane-wave cut-off.43,44 The Generalized Gradient Approximation
(GGA) of Perdew–Burke–Ernzehof (PBE) functional was used for the exchange-correlation term.45,46 We used a Methfessel–Paxton smearing.47 After preliminary calculations on the metal and oxide bulk structures, we opted for the Van der Waals contributions in the local van der Waals density functional scheme proposed by Dion et al48 and Klimeˆs et al49–51 and
calculations were carried out using OptB86b-vdw level.50 The Brillouin-zone sampling was
restricted to the Γ-point,52due to the large supercell size used in the calculations. The
super-cell consists of four layers of copper metal oriented (111) covered by two to six stoichiometric Cu2O(111) layers yielding a thickness varying from 5.89 to 16.24 ˚A. The vacuum region was
set at more than 18 ˚A to minimize the interactions in the z direction between periodic images of the system. Optimizations were performed with restricted spin. The molecules (H2O and OH◦ group) were adsorbed on top of the oxide layer. To calculate the energies of
the molecules in the gas phase, they were optimized in vacuum in a cell of 20˚A×20˚A×20˚A dimensions. The adsorbates, all layers of the oxide film and the two uppermost layers of the copper metal were allowed to move freely, and the two bottom layers of the metal were fixed. Atomic positions were relaxed with the conjugate gradient (CG) algorithm until forces on each moving atom were less than 0.02 eV˚A−1.
Energetic
The cohesion energy of the Cu2O(111) oxide on the Cu(111) metal was calculated as:
Ecohesion = (E(metal) + E(oxide) − E(metal/oxide))/A (1)
where E(metal/oxide) is the total energy of the relaxed Cu2O(111)||Cu(111) system.
E(oxide) and E(metal) are the total energies of the unrelaxed Cu2O(111) and Cu(111) parts,
respectively, as calculated after separation and A is the area of the slab. The adsorption energy of the water molecule was calculated as:
Eads = [E(slab/H2O)–E(slab)–nE(H2O)]/n (2)
where E(slab/H2O) is the total energy of the system with the water adsorbed on the slab
surface. E(slab) and E(H2O) are the energies of the clean relaxed slab and of one free water
molecule optimized in vacuum, respectively, and n is the number of the water molecules adsorbed on the surface.
The adsorption energy of the radical OH◦ was calculated as:
where E(slab/OH) is the total energy of the system with the OH◦ groups adsorbed on the slab surface. E(OH◦) is the energy of one free radical OH◦ optimized in vacuum and n is the number of OH adsorbed on the surface.
In order to compare the stabilities at low and full (i.e. saturation) coverage of the adsorption of H2O and OH◦, we normalized the adsorption energy per unit area as follows:
εnorm= Eads× θ (4)
where Eads is the adsorption energy per molecule and θ = An the coverage, defined as the
number of adsorbed molecules (n) per area (A) of the slab.
Electronic and charge analysis
The charge density difference analysis was plotted as:
∆ρ(r) = ρ(r)slab/mol− (ρ(r)slab+ ρ(r)mol) (5)
where ρ(r)slab/molis the charge density distribution on the system, and ρ(r)slaband ρ(r)mol
are the charge density distributions on the isolated substrate and molecule at the geometry after adsorption, respectively.
The net charge variation was determined on each atom as:
∆Q(x) = Qads(x) − Qvac(x) (6)
where the Qads(x) and Qvac(x) are the net charge on each atom (Bader population
The work function change induced by the formation of the oxide on the metallic surface was calculated by:
∆φ = φ‘− φ (7)
where φ‘ and φ are the work functions for the surface covered by the oxide and the bare
metallic surface, respectively. The work function was calculated by the difference between the Fermi energy (EF ) of the system and the average electrostatic potential energy (V∞) in
the middle of the vacuum region: φ = V∞− EF. The calculations were done with a dipole
correction in the z direction and the total local potential (vasp LOCPOT) contains only the electrostatic contributions (ionic and Hartree).
Results & Discussion
Construction and geometrical properties of the Cu(111)||Cu2
O(111)
model
In preliminary calculations, we characterized the bulk properties of Cu-metal and Cu2O-oxide
as a first step to build the Cu(111)||Cu2O(111) structure. The lattice parameters obtained
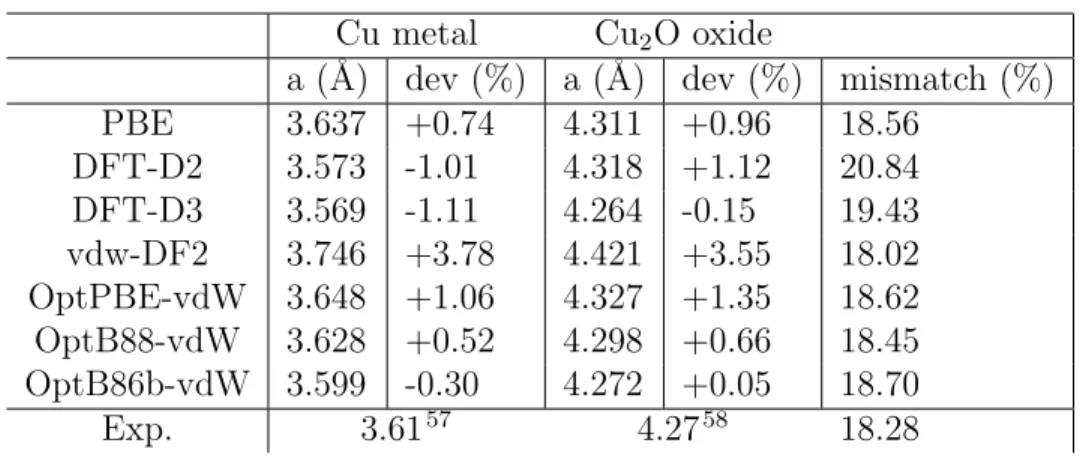
by PBE,45,46 corrected by the semi empirical methods (DFT-D2 and DFT-D3) proposed by Grimme54,55 and non local functionals vdw-DF48 are summarized in Table 1. We selected the optB86b functional optimized by Klimes et al,49,50 known for its ability to describe
structural properties of solids.56 We found that it allows a good compromise of the lattice
parameters of bulk Cu-metal and Cu2O-oxide with equilibrium lattice parameters of 3.599
(-0.30%) and 4.272 ˚A (+0.05%), respectively, which are in good agreement with experimen-tal values of 3.6157and 4.27 ˚A.58The bulk was then cleaved to generate the surface structure.
Table 1: Lattice parameter and lattice mismatch of copper and cuprite bulk structures calculated with PBE functional and different correction schemes of van der Waals forces.
Cu metal Cu2O oxide
a (˚A) dev (%) a (˚A) dev (%) mismatch (%) PBE 3.637 +0.74 4.311 +0.96 18.56 DFT-D2 3.573 -1.01 4.318 +1.12 20.84 DFT-D3 3.569 -1.11 4.264 -0.15 19.43 vdw-DF2 3.746 +3.78 4.421 +3.55 18.02 OptPBE-vdW 3.648 +1.06 4.327 +1.35 18.62 OptB88-vdW 3.628 +0.52 4.298 +0.66 18.45 OptB86b-vdW 3.599 -0.30 4.272 +0.05 18.70 Exp. 3.6157 4.2758 18.28
It has been shown that in the Cu(II) potential range, the Cu(111) metal substrate is fully covered by a well crystallized Cu2O(111) oxide film in parallel epitaxy,1,5 which thickness is
of 0.5 and 7 equivalent monolayers (ML) of Cu2O(111) after growth at -0.25 and -0.2 V/SHE,
respectively. Analysis of the observed structures showed a fit between oxide and substrate lattices over a coincidence length of 1.787 nm with a tilt angle of 5◦ assigned to epitaxial stress. This fit implies a contraction of 1% of the oxide lattice or an expansion of 1% of the substrate lattice with respect to the bulk values.
We thus built a supercell containing a (7×7) supercell of Cu(111) matching a (6×6) supercell of Cu2O(111) stoichiometric oxide, and having the lateral dimensions of 1.781 nm
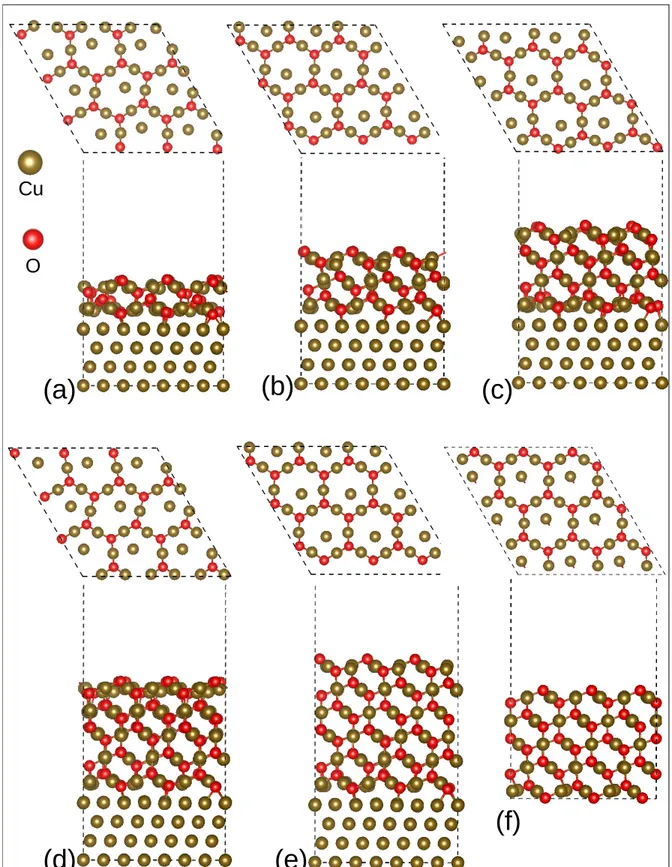
in both x and y directions as calculated with optB86b functional. No tilt angle between the oxide layers and the metal was introduced. This constructed fit leads to the contrac-tion of 1.7% of the oxide lattice relative to the bulk value, while the experimental value is 1%. It also leads to a higher mismatch (18.70 %) than the experimental one (18.28 %). We varied the oxide thickness by covering the Cu(111) metal by two to six stoichiometric Cu2O(111) layers, corresponding to thicknesses ranging from 5.89 to 16.24 ˚A, as shown in
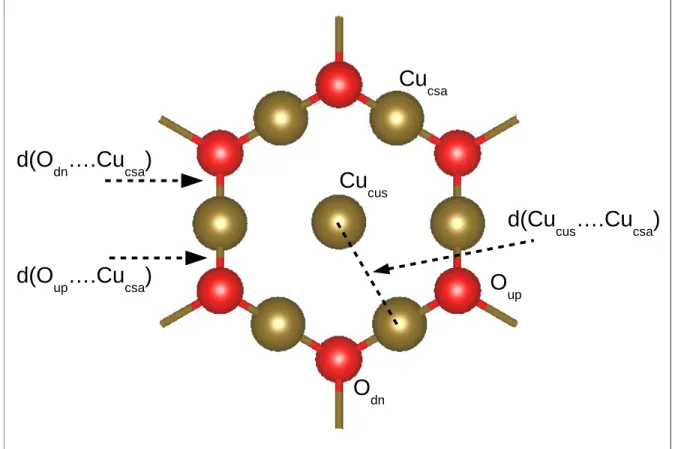
Figure 1. The unrelaxed bare Cu2O(111) surface shown in Figure 2 exhibits two distinct
copper sites corresponding to coordinatively saturated (csa) and coordinatively unsaturated (cus) Cu atoms, labeled as Cucsaand Cucus, respectively. It contains also two distinct oxygen
respectively, where the subscripts indicate that they are located below (dn) and above (up) the surface Cu layer.
Interface description
In order to understand the interaction of Cu2O with the Cu metal, we analyzed the interfacial
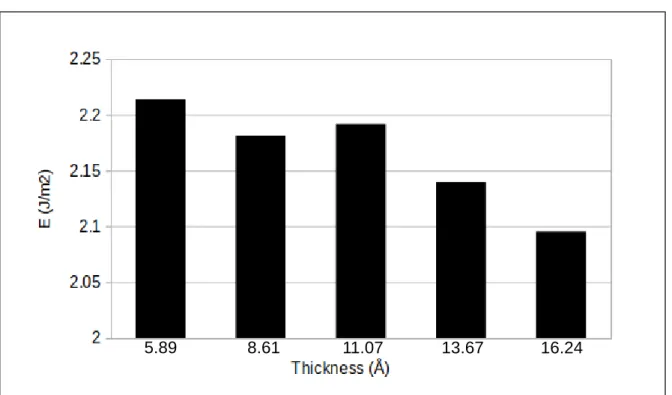
cohesion energy as calculated by rigidly cleaving the relaxed interface structure to produce two free surfaces and not allowing these two free surfaces to relax (Eq.1). Figure 3 shows the variation of this interfacial cohesion energy with increasing thickness of the oxide.
The cohesion energy is positive in the range between 2.09 and 2.21 J/m2, indicating the stable formation of the interface between the stoichiometric Cu2O(111) oxide and the
Cu(111) metal. The cohesion energy shows a slight decrease (about 5%) for a 3-fold increase of the oxide thickness (from 2 to 6 monolayers). The Cu2O(111) oxide binds to the Cu(111)
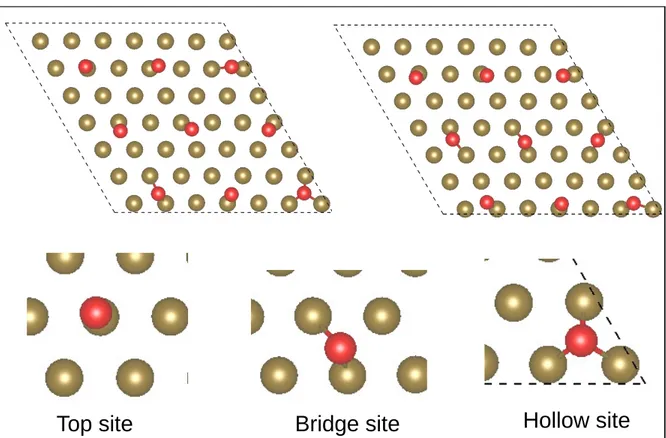
substrate surface through the bonding of the unsaturated oxygen atoms to the copper metal atoms. The oxygen atoms move laterally and are located on top, bridge and hollow sites on Cu(111) metal surface as illustrated in Figure 4. This result contrasts with that of Soon et al,28 who found that the bridge site is energetically less favorable as compared to the
fcc-hollow site for O adsorbed on Cu(111). The Cu-O distances at the interface between copper metal and oxygen of the oxide is between 1.97 and 2.08 ˚A on the top site, in the range between 2.06 and 2.40 ˚A on the bridge site and between 2.17 an 2.35 ˚A on the hollow site.
Surface description
It is known that the Cu2O(111) surface reconstructs after cleavage of the bulk structure.18,20,60,61
There are three symmetry equivalent directions along which Cucus ions may relax, with
slightly different relaxation energies.60 For Cu(111)||Cu
2O(111), we found the same
ten-dency, the reconstructed Cu2O(111) surface being more stable by about 4 meV/ ˚A2 than
unsaturated copper atoms is broken and the Cucus atoms relax laterally toward an adjacent
saturated Cucsa atom, as shown in Figure 1f for non supported Cu2O(111) model.
How-ever, for Cu(111)||Cu2O(111) model the Cucus ions relax toward Cucsa ions without any
preferential direction, except for the 6-layer thick oxide.
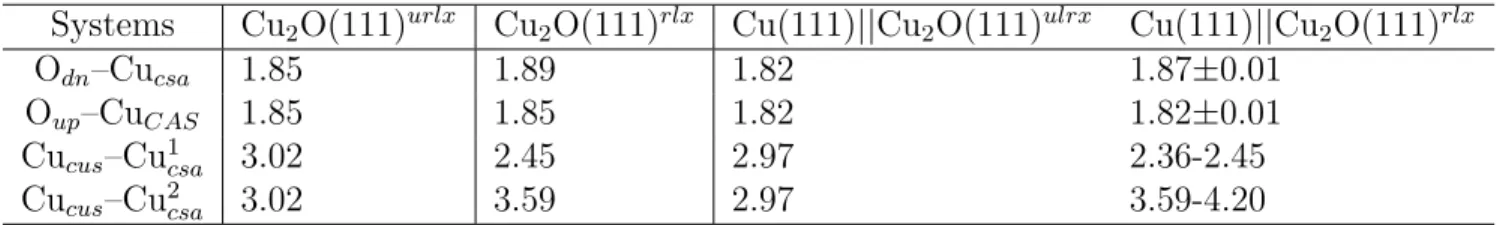
Table 2: Comparison of distances and bond lengths (˚A) at the oxide surface before and after relaxation, for non supported Cu2O(111) and supported Cu(111)||Cu2O(111) with oxide
thickness ranging from 2 to 6 monolayers (ML). Distances and bond lengths are illustrated in Figure 2. Cucus–Cu1csa and Cucus–Cu2csa correspond to the contraction and elongation
Cucus–Cucsa distances
Systems Cu2O(111)urlx Cu2O(111)rlx Cu(111)||Cu2O(111)ulrx Cu(111)||Cu2O(111)rlx
Odn–Cucsa 1.85 1.89 1.82 1.87±0.01
Oup–CuCAS 1.85 1.85 1.82 1.82±0.01
Cucus–Cu1csa 3.02 2.45 2.97 2.36-2.45
Cucus–Cu2csa 3.02 3.59 2.97 3.59-4.20
Table 2 shows the O-Cu and Cucsa-Cucusdistances (Figure 2) measured at the Cu2O(111)
surface before and after relaxation for the non supported oxide and supported oxide. On the unrelaxed clean surface without lateral compression (Cu2O(111)urlx), the Oup-Cucsaand Odn
-Cucsa distances are 1.85 ˚A and the Cucsa-Cucus distance is 3.02 ˚A, while they are shorter
by 0.03 and 0.05 ˚A respectively, with lateral compression (Cu(111)||Cu2O(111)urlx). For
the supported oxide after relaxation and independently of the oxide thickness, the Odn
-Cucsa distance is longer (1.87±0.01 ˚A) and the Oup-Cucsa distance is shorter (1.82±0.01)
compared to the ideal oxide surface (Cu2O(111)urlx). These results are in line with that
of Soon et al.,28 who reported a compression by 2.1% of O-Cu distance compared to that in the ideal oxide surface structure, due to the strong lateral constraint imposed to the supported oxide by using a supercell of 4×4. Because the high-symmetry of Cucus is broken
after relaxation, the Cucsa-Cucus distance is significantly changed. As mentioned previously,
the Cucus atoms move toward the Cucsa sites, without preferential direction, because it has
six Cucsa neighboring sites, which leads to the elongation of some Cucsa-Cucus distances and
contraction of others. According to the relaxation direction of the Cucusatoms and the oxide
between 3.59 and 4.20 ˚A.
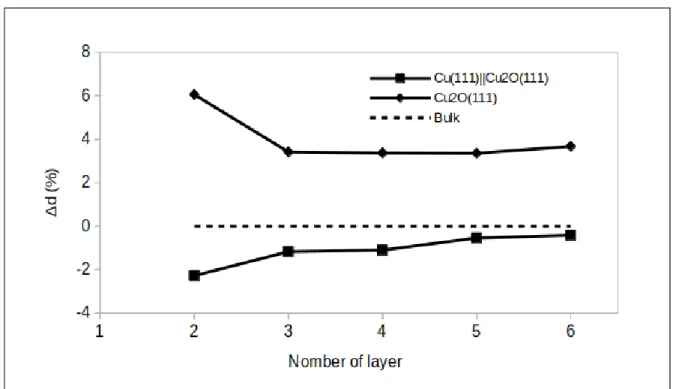
The relaxation of the surface was also attested by the surface interlayer distance variation, shown in Figure 5 and calculated by the following equation:
∆d = ds− dbulk dbulk
× 100 (8)
where ds is the distance between the surface and the subsurface layers and dbulk is the
equivalent distance in the Cu2O bulk oxide.
It is interesting to notice that the direction of relaxation is opposite for the supported and non supported Cu2O oxides. For the Cu2O(111)||Cu(111), the surface interlayer relaxation
is inward, i.e. the distance between the two topmost layer decreases compared to that in the bulk (2.47 ˚A). In contrast, the surface interlayer relaxation is outward in the non supported Cu2O(111) oxide. The interlayer distance converges toward the bulk value and reaches
-0.42% and +3.67% for the supported Cu2O(111)||Cu(111) and non supported Cu2O(111)
oxides, respectively, with the 6 monolayer model.
These results show an opposite relaxation deviation of the interlayer distance induced by the underlying copper metal, and a slight effect of the constraint imposed to the oxide on the distance between the Cucus and Cucsa atoms.
Electrons distribution
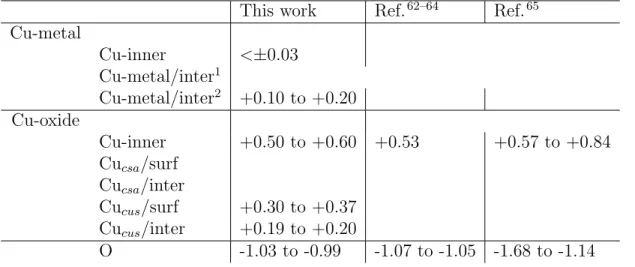
We used Bader charge analysis to identify the electrons distribution in the metal-oxide system and the results are compared to experimental and theoretical literature data. The results are presented in Table 3. In the oxide, the results show that the electrons distribution is independent of the oxide thickness. We found the presence of oxidized copper atoms and oxygen anions in the inner layers (i.e. bulk) of the oxide, on the surface and at the interface. We also found the expected metallic character of the metal support. In the bulk oxide, the
copper cations have a Bader charge in the range between +0.5 and +0.6 electron, while oxygen anions exhibit typical charge of about -1 electron. The Bader charge analysis of the electrons distribution in the oxide is in good agreement with other theoretical charge distributions62–64 and also in line with the results of a high-energy synchrotron experimental
investigation.65 The surface and the interface of the oxide contain saturated (Cu
csa) and
unsaturated (Cucus) copper cations. The Cucsa cations exhibit a charge like in Cu cations
in the bulk oxide, whereas the Cucus exhibit a lower charge in the range between +0.30 and
+0.37 electron on the surface and of +0.19 and +0.20 electron at the interface with the metal. In the metal, Bader charge analyses shows the absence of charge (Cu+0) in the bulk
(∆Q < ±0.03 electron) and two types of copper atoms at the interface. The copper atoms bear charges varying from +0.10 to +0.20 electrons when involved in the interaction with oxygen atoms of the oxide, whereas the other copper atoms remain of metallic character (∆Q < ±0.03 electrons). This evidences a local electron transfer for the copper atoms involved in the interaction with oxygen atoms at the metal-oxide interface. The low charge transfer observed agrees with the more covalent than ionic nature of Cu2O.66The covalent character
of Cu2O might explain the strong cohesion energy calculated, as it has been proposed that
increasing the oxide covalency increases the metal/oxide interface strength.67
Table 3: Bader charge analysis of the electrons distribution (electron) on the Cu(111)||Cu2O(111) model with oxide thickness ranging from 2 to 6 monolayers.
This work Ref.62–64 Ref.65 Cu-metal Cu-inner <±0.03 Cu-metal/inter1 Cu-metal/inter2 +0.10 to +0.20 Cu-oxide Cu-inner +0.50 to +0.60 +0.53 +0.57 to +0.84 Cucsa/surf Cucsa/inter Cucus/surf +0.30 to +0.37 Cucus/inter +0.19 to +0.20 O -1.03 to -0.99 -1.07 to -1.05 -1.68 to -1.14
Work function change and electrons transfer
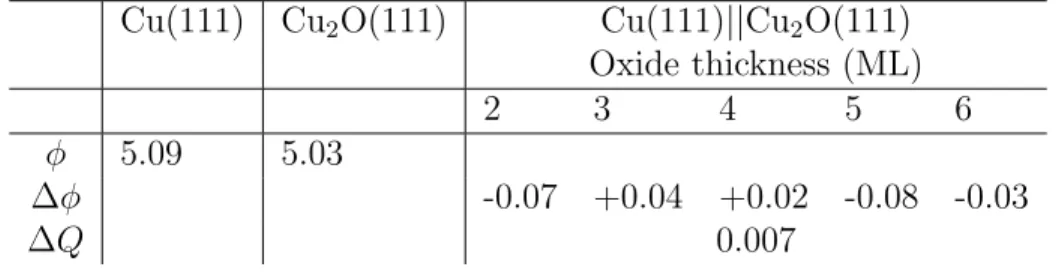
Table 4: Work function (φ in eV) for the Cu(111) and Cu2O(111) surface and work function
change with respect to the metal work function (∆φ in eV) and electrons transfer (∆Q in e/˚A2) as function of the oxide thickness for the Cu2O(111)||Cu(111) model.
Cu(111) Cu2O(111) Cu(111)||Cu2O(111)
Oxide thickness (ML)
2 3 4 5 6
φ 5.09 5.03
∆φ -0.07 +0.04 +0.02 -0.08 -0.03
∆Q 0.007
Table 4 shows the work function (φ) of the Cu(111) and Cu2O(111) surfaces and the
work function change (∆φ) and electrons transfer (∆Q) as a function of the oxide thickness for the Cu2O(111)||Cu(111) model. The formation of the Cu2O(111) stoichiometric oxide
on the Cu(111) metal induces no significant change on the metal work function, which can be explained by the low charge transfer calculated after interaction and by the close work functions of the metal and the oxide. The work function change is related to the electrons transfer and, indeed, the Bader charge analysis reveals electrons transfer from the metal to the oxide of only 0.007 e/˚A2. We calculated work functions of the Cu metal and the Cu2O oxide of 5.09 and 5.03 eV, respectively. These results contrast with those obtained for
structures of oxygen adsorbed on the Cu surface, for which a work function change of 1.17 eV at 0.25 ML O coverage was calculated.28
Reactivity toward water molecules and OH groups
In order to model the experimental conditions of the copper surface in contact with an aque-ous solution, we investigated the molecular and dissociative adsorption of water molecules and compared our results with literature data of water adsorbed on non supported Cu2O(111)
oxide. We also hydroxylated the surface with OH groups placed on Cucus. Two oxide
thick-nesses were considered, corresponding to 2 and 4 stoichiometric Cu2O(111) layers.
the starting and the most stable optimized configurations of molecular and dissociative adsorption of water molecules at low and high coverage, respectively. Figures 8 and 9 show snapshots of OH adsorption at low and high coverage, respectively. Table 5 summarizes the adsorption energies of molecular water and OH at low and high coverage compared to the literature data. More details on the water-surface and OH-surface binding for two oxide thicknesses ( 2 and 4 stoichiometric Cu2O layers) are given by the charge density difference
analysis (∆ρ(r)) calculated by Eq.5 and plotted in Figure 10, with isosurface of ±0.0004 e/˚A3.
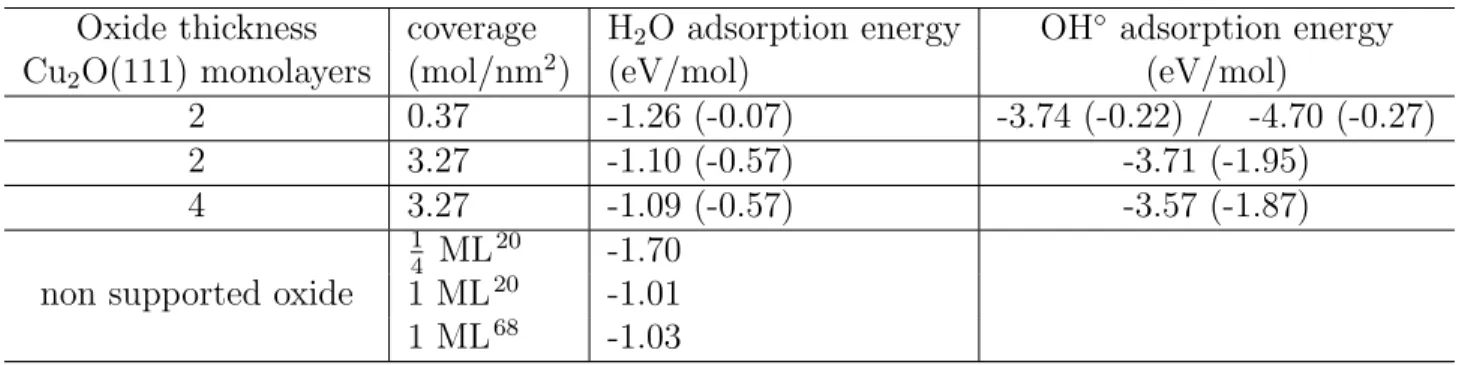
Table 5: Adsorption energies (eV/mol) of water molecule and radical OH◦ at low and full coverage as calculated with Eq.2 and Eq.3, respectively. Values in brackets correspond to the adsorption energy normalized per unit area (J/m2), calculated with Eq.4.
Oxide thickness coverage H2O adsorption energy OH◦ adsorption energy
Cu2O(111) monolayers (mol/nm2) (eV/mol) (eV/mol)
2 0.37 -1.26 (-0.07) -3.74 (-0.22) / -4.70 (-0.27) 2 3.27 -1.10 (-0.57) -3.71 (-1.95) 4 3.27 -1.09 (-0.57) -3.57 (-1.87) 1 4 ML 20 -1.70
non supported oxide 1 ML20 -1.01
1 ML68 -1.03
We found that independently of the oxide thickness, the water molecular adsorption (as shown in Figures 6 and 7) is favored over dissociative adsorption. The adsorption en-ergy of the water molecule on Cu(111) covered by two Cu2O(111) layers is -1.26 and -1.10
eV/molecule at low and full coverage, respectively. On Cu(111) covered by four Cu2O(111)
layers, the value is -1.09 eV/molecule at full coverage. The water molecules prefer to bind on top of unsaturated copper sites via the oxygen atom, with a bond length Cu...O of 1.96±0.01 ˚
A. The Cu...O bond is confirmed by the charge density difference analysis in Figure 10, that shows the accumulation of electron charge (blue color) between the oxygen atom of the water molecules and the unsaturated copper atoms of the oxide surface. We also observed the formation of a H-O-H....O hydrogen bond with an adjacent unsaturated oxygen with a H...O distance of 1.69±0.01 ˚A and 1.74±0.04 ˚A, on the two and four Cu2O layer thick
models, respectively. The orientation of the hydrogen atom of the water molecule toward the unsaturated oxygen atom of the oxide surface and also the deficit and accumulation of electrons charge on the hydrogen (positive charge) and the unsaturated oxygen (negative charge) atoms (Figure 10), respectively, are typical features of H-bonding. Note that even when starting the calculations in the dissociative adsorption mode (Figure 7), we observed the reformation of intact water molecules at the end of the optimization process, which con-firms preferential molecular adsorption of water on Cu(111)||Cu2O(111) surface. The water
molecules were again adsorbed on unsaturated copper sites with the formation of H-bond. However at full coverage, one water molecules remains in the dissociative adsorption mode, with the OH group adsorbed atop on unsaturated copper and the H atom bounded to an un-saturated oxygen atom (Figure 7). This configuration allows us to estimate the dissociative energy of water molecule on the substrate surface. We calculated the value of 0.17 eV.
It is now interesting to compare our results of H2O adsorption on the supported Cu(111)||Cu2O(111)
oxide with literature data of H2O adsorption on non supported Cu2O(111) oxide. Our
re-sults of favored molecular over dissociative adsorption are in agreement with literature data on the non supported oxide surface, showing that the oxide acid-base reactivity does not depend on the oxide layer thickness neither on the presence of the underlying Cu metal. The adsorption at high coverage is favored over that at low coverage, the gain in the adsorption is εnorm = 0.50 J/m2 (Table 5). The adsorption energy is also in accordance with previous
theoretical results.20,68 Independently of coverage, the water molecule prefers molecular
ad-sorption like observed on Cu2O(111) surfaces built with periodic20,68,69 or cluster19 models
and also on Cu2O(111) surface with Cu-vacancy.68 In the latter case, the water molecule
binds via H-bonding to oxygen in the sub layer, in the Cu-vacancy and with the oxygen atom of the molecule is tilted toward Cucsa site. However the dissociative adsorption mode
of H2O molecule can be preferential if the Cu2O(111) surface contains O-vacancies20,69 and
also on the polar surfaces like the Cu-terminated, Cu-rich and O-rich Cu2O(111) surfaces.64
Figures 8 and 9 show the results obtained at low and high coverage, respectively. The interaction mechanism of the OH groups with the surface is different from that of the water molecules. It does not show the formation of H-bonding and can involve both saturated and unsaturated copper surface atoms.
At low coverage, two optimized configurations were analyzed, due to their difference in the interaction mechanism. The first configuration has an adsorption energy of -3.74 eV, and corresponds to the adsorption of OH on top of an unsaturated copper atom with a bond length Cu...OH of 1.78 ˚A and without the formation of H-bonding between the OH group and the unsaturated oxygen surface atoms. The adsorption of OH in this configuration does not affect the structural environment of the neighboring atoms as compared to the bare Cu2O(111) surface.
The second configuration presents an adsorption energy of -4.69 eV and is more stable by -0.95 eV. The OH group binds in a bridge mode with bond lengths Cucus...O of 1.88 ˚A
and Cucsa. . . O of 1.89 ˚A. There is no H-bonding like in the first described configuration but
there is a change in the structural environment of the neighboring surface atoms: i) broken bonding of an adjacent saturated copper with an unsaturated oxygen with a Cucsa-Oupbond
length increase from 1.83 ˚A to 2.97 ˚A, the Cucsa atom relaxes to bind to the OH group with
a bond length of 1.89 ˚A; ii) the neighbor Cucusatom becomes a Cucsa atom, it moves to bind
with an unsaturated oxygen (Cu-O distance changes from 2.9 to 1.88 ˚A) that looses a bond with a saturated copper atom.
At high coverage, all unsaturated copper atoms of the Cu2O surface are bounded to
OH groups. After relaxation, we observed two types of OH bonding. 29 of OH groups in the supercell are µ1-OH groups, i.e. with OH adsorbed on top of unsaturated copper atoms, with
bond length of 1.78 ˚A. This adsorption mode corresponds to that found at low coverage for the less stable configuration. 79 of the OH groups in the supercell are µ2-OH groups, i.e. with
each OH bonded in bridge mode to two copper atoms. The Cu...O bond lengths are 1.84 ˚A and 2.12 ˚A with unsaturated and adjacent saturated copper atoms, respectively. Both types
of OH bonds show bond-making without bond-breaking. The reason is that all unsaturated copper atoms become saturated after bonding with OH groups. More details about the Cu...O bond formation are given by ∆ρ(r) analysis in Figure 10 that shows electrons charge accumulation on the oxygen of the OH groups and local redistribution of electrons charge on copper surface atoms. We calculate a low deficit of the electrons charge on the unsaturated copper and higher deficit of the electrons charge on the saturated copper atoms particularly for those bonded to the µ2-OH groups.
The adsorption energy is -3.72 eV/molecule. The adsorption energy per OH at full coverage is lower than at low coverage, however, when the adsorption energy is normalized to a unit area (Table 5), the full coverage is more favorable, because more OH groups are adsorbed per unit area. The results also show that the adsorption of OH groups is more stable than the intact water molecule (energy difference of 2.62 eV). The energetic trend suggests that surface saturation by OH groups of the Cu(111)||Cu2O(111) supported oxide
is, in principal, favored in conditions where OH group adsorption can compete with water molecular adsorption, but that it would not likely happen by direct dissociation of water molecules.
Conclusions
In this paper, we presented a DFT-based construction and optimization of Cu2O(111) oxide
supported in parallel epitaxy on the Cu(111) as model for metallic copper covered by an ultrathin Cu(II) oxide. Hydration and hydroxylation of the topmost surface of the supported Cu(111)||Cu2O(111) model was discussed. We provided results for structural, energetic and
electronic properties of dry, hydrated and hydroxylated systems. The results were compared to equivalent data on non supported Cu2O(111) oxide.
We found the stable formation of stoichiometric Cu2O(111) oxide in parallel epitaxy on
thickness. We showed that the surface relaxation is independent of the oxide thickness, and similar to that of the non supported Cu2O(111) oxide with slight effect on Cucus-Cucsa
distance imposed by the lateral constraint in the supported oxide. The underlying copper metal was found to modify the relaxation changes in the deviation of the surface interlayer distance as compared to the non supported oxide, and converges to that of bulk oxide with increasing the Cu2O(111) thickness.
Bader charge analyses revealed the metallic and oxide character of the copper metal atoms at the metal and oxide planes forming the interface. The close values of the work function of the metal and the oxide combined to the weak electron exchange at the interface causes non significant variation of the metal work function, whatever the thickness of the supported oxide.
Independently of the oxide thickness, water molecules prefer molecular adsorption rather than dissociative adsorption. The adsorption at high coverage is favored over that at low coverage. The electronic analysis confirms that the water molecules bind covalently via O to Cucus atoms and form also H-bonds with Oup surface atoms.
The hydroxylation of the surface shows two types of bonding for the adsorbed OH groups; OH-µ1 and OH-µ2, with predominance of OH-µ2 mode. In OH-µ1 mode, the OH group is
chemisorbed via the O atom on top of a Cucus atom, whereas in the OH-µ2 mode, the
OH is chemisorbed via the O atom bridging the Cucus and Cucsa atoms. The energetic
trend suggests that the complete surface hydroxylation of the Cu(111)||Cu2O(111) supported
oxide is favored in conditions where OH group adsorption can compete with water molecular adsorption.
Acknowledgement
This project has received funding from the European Research Council (ERC) under the European Union’s Horizon 2020 research and innovation program (ERC Advanced Grant No.
741123, Corrosion Initiation Mechanisms at the Nanometric and Atomic Scales : CIMNAS).
References
(1) Kunze, J.; Maurice, V.; Klein, L. H.; Strehlowa, H.-H.; Marcus, P. In Situ Scanning Tunneling Microscopy Study of the Anodic Oxidation of Cu(111) in 0.1 M NaOH. J. Phys. Chem. B 2001, 105, 4263–4269.
(2) Poizot, P.; Laruelle, S.; Grugeon, S.; Dupont, L.; Tarascon, J. M. Nano-Sized Transition-Metal Oxides as Negative-Electrode Materials for Lithium-Ion Batteries. Nature 2000, 407, 496.
(3) Hara, M.; Kondo, T.; Komoda, M.; Ikeda, S.; Shinohara, K.; Tanaka, A.; Kondo, J.; Domen, K. Cu2O as a Photocatalyst for Overall Water Splitting Under Visible Light
Irradiation. Chem. Commum. 1998, 357.
(4) Zhou, R.; Yu, T.; Jiang, X.; Chen, F.; Zheng, X.
(5) Marcus, P.; Maurice, V. Atomic Level Characterization in Corrosion Studies. Phil. Trans. R. Soc. 2017, A375, 20160414.
(6) Henderson, M. A. The Interaction of Water with Solid Surfaces: Fundamental Aspects Revisited. Surf. Sci. Rep. 2002, 46, 1–308.
(7) Thiel, P. A.; Madey, T. E. The Interaction of Water with Solid Surfaces: Fundamental Aspects. Surf. Sci. Rep. 1987, 7, 211–385.
(8) Gr¨under, Y.; Dr¨unkler, A.; Golks, F.; Wijts, G.; Stettner, J.; Zegenhagen, J.; Mag-nussen, O. M. Structure and Electrocompression of Chloride Adlayers on Cu(111). Surf. Sci. 2011, 605, 1732–1737.
(9) Gr¨under, Y.; Dr¨unkler, A.; Golks, F.; Wijts, G.; Stettner, J.; Zegenhagen, J.; Mag-nussen, O. M. Cu(111) in Chloride Containing Acidic Electrolytes: Coadsorption of an Oxygenated Species. J. Electroanal. Chem. 2014, 712, 74–81.
(10) Baricuatro, J. H.; Ehlers, C. B.; Cummins, K. D.; Soriaga, M. P.; Stickney, J. L.; Kim, Y.-G. Structure and Composition of Cu(hkl) Surfaces Exposed to O2 and Emersed
from Alkaline Solutions: Prelude to UHV-EC Studies of CO2Reduction at Well-Defined
Copper Catalysts. J. Electroanal. Chem. 2014, 716, 101–105.
(11) Maurice, V.; Strehlowa, H.-H.; Marcus, P. In Situ STM Study of the Initial Stages of Oxidation of Cu(111) in Aqueous Solution. Surf. Sci. 2000, 458, 185–194.
(12) Abrahami, S. T.; Chiter, F.; Klein, L. H.; Maurice, V.; Terryn, H.; Costa, D.; Marcus, P. In Situ EC-STM Study and DFT Modeling of the Adsorption of Glycerol on Cu(111) in NaOH Solution. J. Phys. Chem. C 2019, 123, 22228–22238.
(13) Lahti, M.; Chaudhuri, A.; Pussi, K.; Hesp, D.; McLeod, I. M.; Dhanak, V. R.; King, M. O.; Kadodwala, M.; MacLaren, D. A. The Structure Analysis of Cu(111)-Te(√3 ×√3)R30◦ and (2√3 × 2√3)R30◦ Surface Phases by Quantitative LEED and DFT. Surf. Sci. 2014, 622, 35–43.
(14) Sander, U.; Strehblow, H.-H.; Dohrmann, J. K. In Situ Photoacoustic Spectroscopy of Thin Oxide Layers on Metal Electrodes. Copper in Alkaline Solution. J. Phys. Chem. 1981, 85, 447–450.
(15) Finˇsgar, M.; Peljhan, S.; Kokalj, A.; Kovacc, J.; Miloˇsev, I. Determination of the Cu2O
Thickness on BTAH-Inhibited Copper by Reconstruction of Auger Electron Spectra. J. Electrochem. Soc. 2010, 157, C295–C301.
(16) Strehblow, H.-H.; Titze, B. The Investigation of the Passive Behaviour of Copper in Weakly Acid and Alkaline Solutions and the Examination of the Passive Film by esca and ISS. Electrochim. Acta. 1979, 25, 839–850.
(17) Kunze, J.; Maurice, V.; Klein, L. H.; Strehlowa, H.-H.; Marcus, P. In Situ STM Study of the Duplex Passive Films Formed on Cu(111) and Cu(001) in 0.1 M NaOH. Corros. Sci. 2004, 46, 245–264.
(18) Kokalj, A.; Peljhan, S. Density Functional Theory Study of Adsorption of Benzotriazole on Cu2O Surfaces. J. Phys. Chem. C 2015, 119, 11625–11635.
(19) Casarin, M.; Maccato, C.; Vigato, N.; Vittadini, A. A Theoretical Study of the H2O
and H2S Chemisorption on Cu2O(111). Appl. Surf. Sci. 1999, 142, 164–168.
(20) Yu, X.; Zhang, X.; Wang, S.; Feng, G. A Computational Study on Water Adsorption on Cu2O(111) Surfaces: The Effects of Coverage and Oxygen Defect. Appl. Surf. Sci.
2015, 343, 33–40.
(21) Gharachorlou, A.; Detwiler, M. D.; Gu, X.-K.; Mayr, L.; Kl¨otzer, B.; Greeley, J.; Reifen-berger, R. G.; Delgass, W. N.; Ribeiro, F. H.; Zemlyanov, D. Y. Trimethylaluminum and Oxygen Atomic Layer Deposition on Hydroxyl-Free Cu(111). ACS Appl. Mater. Interfaces 2015, 7, 16428–16439.
(22) An, D. W.; Xu, F.; Stacchiola, D. D.; Liu, P. Potassium-Induced Effect on Structure and Chemical Activity of CuxO/Cu(111) (x≤2) Surface: A Combined Scanning Tunneling Microscopy and Density Functional Theory Study. ChemCatChem 2015, 7, 23.
(23) Therrien, A. J.; Zhang, R.; Lucci, F. R.; Marcinkowski, M. D.; Hensley, A.; McEwen, J.-S.; Sykes, E. C. H. Structurally Accurate Model for the “29”-Structure of CuxO/Cu(111): A DFT and STM Study. J. Phys. Chem. C 2016, 120, 10879–10886.
(24) Hensley, A. J. R.; Therrien, A. J.; Zhang, R.; Marcinkowski, M. D.; Lucci, F. R.; Sykes, E. C. H.; McEwen, J.-S. CO Adsorption on the “29” CuxO/Cu(111) Surface: An Integrated DFT, STM, and TPD Study. J. Phys. Chem. C 2016, 120, 25387–25394.
(25) Park, J.-H.; Lee, J.-H.; Soon, A. Organics on Oxidic Metal Surfaces: a First-Principles DFT Study of PMDA and ODA Fragments on the Pristine and Mildly Oxidized Surfaces of Cu(111). Phys. Chem. Chem. Phys. 2016, 18, 21893.
(26) Jensen, F.; Besenbacher, F.; Lægsgaard, E.; Stensgaard, I. Surf. Sci. 1991, 1259 .
(27) Yang, F.; Choi, Y.; Liu, P.; Hrbek, J.; Rodriguez, J. A. Autocatalytic Reduction of a Cu2O/Cu(111) Surface by CO: STM, XPS, and DFT Studies. J. Phys. Chem. C 2010,
114, 17042–17050.
(28) Soon, A.; Todorova, M.; Delley, B.; Stampfl, C. Oxygen Adsorption and Stability of Surface Oxides on Cu(111): A First-Principles Investigation. Phys. rev. B 2006, 73, 165424.
(29) xiang Yu, X.; Marks, L. D. Combining the Physics of Metal/Oxide Heterostructure, Interface Dipole, Band Bending, Crystallography, and Surface State to Understand Heterogeneity Contrast in Oxidation and Corrosion. Corrosion 2019, 75, 152–166.
(30) M¨oller, C.; Nilius, N. Water Adsorption on Cu2O(111) Surfaces: A Scanning Tunneling
Microscopy Study. J. Phys. Chem. C 2017, 121, 20877–20881.
(31) Str¨ater, H.; Fedderwitz, H.; Groß, B.; Nilius, N. Growth and Surface Properties of Cuprous Oxide Films on Au(111). J. Phys. Chem. C 2015, 119, 5975–5981.
(32) Brandt, I. S.; Martins, C. A.; Zoldan, V. C.; Viegas, A. D. C.; da Silva, J. H. D.; Pasa, A. A. Structural and Optical Properties of Cu2O Crystalline Electrodeposited
Films. Thin Solid Films 2014, 562, 144–151.
(33) Costa, D.; Ribeiro, T.; Mercuri, F.; Pacchioni, G.; Marcus, P. Atomistic Modeling of Corrosion Resistance: A First Principles Study of O2 Reduction on the Al(111) Surface
Covered with a Thin Hydroxylated Alumina Film. Adv. Mater. Interfaces 2014, 1, 1300072.
(34) Tan, Y. S.; Srinivasan, M.; Pehkonen, S. O.; Chooi, S. Y. M. Effects of Ring Substituents on the Protective Properties of Self-Assembled Benzenethiols on Copper. Corros. Sci. 2006, 48, 840–862.
(35) Wu, X.; Wiame, F.; Maurice, V.; Marcus, P. Adsorption and Thermal Stability of 2-Mercaptobenzothiazole Corrosion Inhibitor on Metallic and pre-Oxidized Cu(111) Model Surfaces. Appl. Surf. Sci. 2020, 508, 145132.
(36) Wu, X.; Wiame, F.; Maurice, V.; Marcus, P. 2-Mercaptobenzothiazole Corrosion In-hibitor Deposited at Ultra-Low Pressure on Model Copper Surfaces. Corros. Sci. 2020, 166, 108464.
(37) Wu, X.; Wiame, F.; Maurice, V.; Marcus, P. 2-Marcaptobenzimidazole Films Formed at Ultra-Low Pressure on Copper: Adsorption, Thermal Stability and Corrosion Inhibition Performance. Appl. Surf. Sci. 2020, 527, 146814.
(38) Chiter, F.; Costa, D.; Maurice, V.; Marcus, P. DFT Investigation of 2-Mercaptobenzothiazole Adsorption on Model Oxidized Copper Surfaces and Relation-ship with Corrosion Inhibition. submitted to Appl. Surf. Sci. 2020,
(39) Sun, G.; K¨urti, J.; Rajczy, P.; Kertesz, M.; Hafner, J.; Kresse, G. Performance of the Vienna ab Initio Simulation Package (VASP) in Chemical Applications. J. Mol. Struct. THEOCHEM 2003, 624, 37–45.
(40) Kresse, G.; Hafner, J. Phys. rev. B 1993, 47, 558.
(41) Kresse, G.; Furthm¨uller, J. Efficiency of ab-Initio Total Energy Calculations for Metals and Semiconductors Using a Plane-Wave Basis Set. Comput. Mater. Sci 1996, 6, 15–50.
(42) Kresse, G.; Furthm¨uller, J. Efficient Iterative Schemes for ab Initio Total-Energy Cal-culations Using a Plane-Wave Basis Set. Phys. Rev. B 1996, 54, 11169–11186.
(43) Kresse, G.; Joubert, D. From Ultrasoft Pseudopotentials to the Projector Augmented-Wave Method. Phys. Rev. B 1999, 59, 1758–1775.
(44) Bl¨ochl, P. E. Projector augmented-wave method. Phys. Rev. B 1994, 50 .
(45) Perdew, J. P.; Chevary, J. A.; Vosko, S. H.; Jackson, K. A.; Pederson, M. R.; Singh, D. J.; Fiolhais, C. Atoms , Molecules , Solids , and Surfaces: Applications of the Generalized Gradient Approximation for Exchange and Correlation. Phys. Rev. B 1992, 46 .
(46) Perdew, J. P.; Burke, K.; Ernzerhof, M. Generalized Gradient Approximation Made Simple. Phys. Rev. Lett. 1996, 77 .
(47) Methfessel, M.; Paxton, A. T. High-Precision Sampling for Brillouin-Zone Integration in Metals. Phys. Rev. B 1989, 40 .
(48) Dion, M.; Rydberg, H.; Schr¨oder, E.; Langreth, D. C.; Lundqvist, B. I. Van der Waals Density Functional for General Geometries. Phys. Rev. Lett. 2004, 92, 246401.
(49) Klimeˆs, J.; Bowler, D. R.; Michaelides, A. Chemical Accuracy for the Van der Waals Density Functional. J. Phys.: Condens. 2010, 22, 022201.
(50) Klimeˇs, J.; Bowler, D. R.; Michaelides, A. Van der Waals Density Functionals Applied to Solids. Phys. rev. B 2011, 83, 195131.
(51) Klimeˇs, J.; Michaelides, A. Perspective: Advances and Challenges in Treating Van der Waals Dispersion Forces in Density Functional Theory. J. Chem. Phys.s 2012, 137, 120901.
(52) Monkhorst, H. J.; Pack, J. D. Special Points for Brillonin-Zone Integrations. Phys. Rev. B 1976, 13 .
(53) Tang, W.; Sanville, E.; Henkelman, G. A Grid-Based Bader Analysis Algorithm without Lattice Bias. J. Phys.: Condens. Matter 2009, 21, 084204.
(54) Grimme, S. Semiempirical GGA-Type Density Functional Constructed with a Long-Range Dispersion Correction. J. Comput. Chem. 2006, 27 .
(55) Grimme, S.; Antony, J.; Ehrlich, S.; Krieg, H. A Consistent and Accurat ab Initio Parametrization of Density Functional Dispersion Correction (DFT-D) for the 94 Ele-ments H-Pu. J. Chem. Phys. 2010, 132, 154104–154119.
(56) Chiter, F.; Nguyen, V. B.; Tarrat, N.; Benoit, M.; Tang, H.; Lacaze-Dufaure, C. Effect of Van der Waals Corrections on DFT-Computed Metallic Surface Properties. Mater. Res. Express 2016, 3, 046501.
(57) Kittel, C. Introduction to Solid State Physics, 7th ed.; Wiley Sons, New York, 1996.
(58) Werner, A.; Hochheimer, H. D. High-pressure X-ray Study of Cu20 and Ag20. Phys.
rev. B 1982, 25, 5929.
(59) Kunze, J.; Maurice, V.; Klein, L. H.; Strehlowa, H.-H.; Marcus, P. In Situ STM Study of the Effect of Chlorides on the Initial Stages of Anodic Oxidation of Cu(111) in Alkaline Solutions. Electrochim. Acta. 2003, 48, 1157–1167.
(60) Gustincic, D.; Kokalj, A. DFT Study of Azole Corrosion Inhibitors on Cu2O Model of
Oxidized Copper Surfaces: I. Molecule–Surface and Cl–Surface Bonding. Metals 2018, 8, 310.
(61) Yu, X.; Zhang, X.; Wang, H.; Wang, Z.; Feng, G. High-Coverage H2 Adsorption on the
Reconstructed Cu2O(111) Surface. J. Phys. Chem. C 2017, 121, 22081–22091.
(62) Laskowski, R.; Blaha, P.; Schwarz, K. Charge Distribution and Chemical Bonding in Cu2O. Phys. rev. B 2003, 67, 075102.
(63) Islam, M. M.; Diawara, B.; Maurice, V.; Marcus, P. Bulk and Surface Properties of Cu2O: A First-Principles Investigation. J. Mol. Struc-THEOCHEM 2009, 903, 41–48.
(64) Islam, M. M.; Diawara, B.; Maurice, V.; Marcus, P. First Principles Investigation on the Stabilization Mechanisms of the Polar Copper Terminated Cu2O(111) Surface. Surf.
Sci. 2009, 603, 2087–2095.
(65) Lippmann, T.; Schneider, J. R. Topological Analyses of Cuprite, Cu2O, Using
High-Energy Synchrotron-Radiation Data. Acta Cryst. 2000, A56, 575–584.
(66) Evarestov, R. A.; Tupitsin, I. I.; Veryazov, V. A.
(67) Jarvis, E. A. A.; Carter, E. A. Exploiting Covalency to Enhance Metal–Oxide and Oxide–Oxide Adhesion at Heterogeneous Interfaces.
(68) Riplinger, C.; Carter, E. A. Cooperative Effects in Water Binding to Cuprous Oxide Surfaces. J. Phys. Chem. C 2015, 119, 9311–9323.
(69) Zhang, R.; Li, J.; Wang, B.; Ling, L. Fundamental Studies about the Interaction of Water with Perfect, Oxygen-Vacancy and pre-Covered Oxygen Cu2O(111) Surfaces:
Figure 1: Snapshots (top and side views) of Cu(111) covered by stoichiometric Cu2O(111)
in parallel epitaxy with thickness from two (a) to six (e) layers. (f) is the non supported 5-layer thick Cu2O(111) oxide.
Figure 2: Surface sites, bond lengths and distances of Cu2O(111). Cucus and Cucsa
corre-spond to unsaturated and saturated copper surface sites, respectively. Oup and Odn
cor-respond to unsaturated and saturated oxygen surface sites, respectively. d(Odn...Cucsa)
and d(Oup...Cucsa) are the bond length of Odn and Oup to Cucsa atoms, respectively.
Figure 3: Cohesion energy of Cu(111)||Cu2O(111) interface as calculated with Eq. 1 as a
Figure 4: Details of the O to metallic Cu bonding at the oxide-metal interface in Cu(111)||Cu2O(111) model. For visualization we kept only the last metallic layer of copper
Figure 5: Deviation of the calculated surface interlayer distance with respect to bulk for the supported Cu(111)||Cu2O(111) and non supported Cu2O(111) oxides.
Figure 6: Top view of water molecular adsorption on Cu(111)||Cu2O(111) at low coverage
Figure 7: Starting and optimized configurations of molecular and dissociative adsorption of water on Cu(111)||Cu2O(111) at high coverage (3.27 mol/nm2).
Figure 8: Top view of OH◦ group adsorbed on Cu(111)||Cu2O(111) at low coverage (0.37
mol/nm2). Top row corresponds to OH◦ adsorbed on a top Cu site. Bottom row corresponds
to OH◦ adsorbed on a bridge Cu site. Circles in zoom area correspond to the Cu position before adsorption.
Figure 9: Adsorption of OH◦group on Cu(111)||Cu2O(111) at high coverage (3.27 mol/nm2).
Mixed adsorption mode on a top and bridge sites.
Figure 10: Charge density difference analysis for H2O and OH group adsorbed on
Cu(111)||Cu2O(111) at high coverage (3.27 mol/nm2). Blue and green color correspond