Structural stability regardless of membership turnover?
The added value of blockmodelling in the analysis of network evolution
Emmanuel LAZEGA (corresponding author) University of Paris-Dauphine
IRISSO-CNRS
Place du Maréchal de Lattre de Tassigny 75775 Paris Cedex 16, France [email protected]
Saraï SAPULETE
Utrecht University School of Economics.
Faculteit Recht, Economie, Bestuur en Organisatie (REBO) Janskerkhof 12 3512 BL Utrecht T The Netherlands [email protected] Lise MOUNIER CMH-CNRS, Paris Ecole Normale Supérieure
48 boulevard Jourdan 75014 Paris
France [email protected]
Paper submitted for presentation at DIME Conference Paris June 25, 2009
Structural stability regardless of membership turnover?
The added value of blockmodelling in the analysis of network evolution
Abstract
The extent to which the emergent structure of an organization remains the same, regardless of the turnover of the members is one of the most interesting questions raised by the analyses of their evolution. This paper uses longitudinal network analysis to provide an answer to this question. Its shows the usefulness of combining both dynamics and comparative statics (here, blockmodelling) in the study of this evolution. An empirical study examines the evolution of the structure of the advice network among judges of the Commercial Court in Paris. The combination of dynamics and comparative statics answers the initial question: Radical structuralism turns out to be wrong. An answer depends on the dimensions of the structure on which observers focus. The pecking order in the advice network remains relatively stable, regardless of members’ turnover. However, social differentiation measured in terms of role relationships and division of work shows that the relational structure does not remain the same regardless of members’ turnover. Specifically, relational processes within the organization, such as collective learning, impose varying constraints on different kinds of members over time and the overall relational structure reflects these members’ changing reactions and responses to these constraints. Since the former vary, so do the latter, and so does the resulting emergent overall structure.
Keywords: Network dynamics, advice networks, comparative statics, membership turnover, relational turnover, blockmodelling
Structural stability regardless of membership turnover?
The added value of blockmodelling in the analysis of network evolution
Introduction
The extent to which the emergent relational structure in an organization remains the same, regardless of the turnover of its members is one of the most interesting questions raised by structural analyses applied in organized settings. This kind of question can be addressed by the analysis of the evolution of the social networks in an organization. In terms of network analysis, the evolution of the network can be studied at least in two ways: dynamics proper, and comparative statics. Dynamic analyses look at the endogenous and exogenous effects driving changes in relationships (i.e. relational turnover) at the local, i.e. dyadic, triadic or sometimes higher order level sub-structures (Snijders, 2001, 2005). From significant effects at the local level, such analyses infer characteristics of changes at the global level; such inferences are sometimes quite speculative. Comparative statics captures the extent to which the overall, global relational structure of the organization changes over time; the speculative dimension of this approach is in explanations of why such changes have occurred, i.e. identification of social processes driving the evolution of the overall structure. Our purpose in this paper is to show that both dynamics and comparative statics are needed to address the issue of the extent to which the emergent relational structure in an organization remains the same, regardless of the turnover of its members.
This research paper addresses this issue by showing the usefulness of combining the two approaches. We rely on previously published dynamic analyses of the evolution of an intra-organizational social network and provide comparative statics at the structural level by analyzing the evolution of the same network in an organization in which the turnover of members is close to 60 percent over six years. We do this using a stochastic blockmodelling approach developed by Snijders and Nowicki (1997). In our view, blockmodelling identifies and tests at the structural level the outcome of relational processes that must be previously examined at the sub-structural level with different methods that tease out the determinants and effects of relational turnover in the network. Both methods are indispensible together to make the most of repeated (longitudinal) network data and its use to bridge the sub-structural (actor-oriented) and structural (collective-(actor-oriented) levels of analysis.
The site of our empirical study is the Commercial Court in Paris. We analyze the structure of the advice network among the judges of this court, the network was observed at
three points in time. We first summarize the processes that were reconstituted by previously carried out dynamic analyses, mainly a cyclical centralization–decentralization process. We then present the ‘best’ possible, i.e. clearest, blockmodel for each measurement of the network. The first wave shows three blocks, presenting a clear core–semi-periphery– periphery structure. The core block includes the most central actors in the network, i.e. judges who are presidents of chamber in all three waves. Over time the overall structure changes. The second wave shows four blocks with the periphery subdivided into two semi-peripheries. The third wave divides the network into two blocks, back to a simpler core– periphery structure, but with an expanded core.
This view of the evolution of the structure confirms the existence of a relatively stable hierarchical pecking-order of judges in the courthouse, but also that of the cyclical process of centralization–decentralization of the advice network. This view also shows the usefulness of combining the dynamics and comparative statics in the study of network evolution. The combination of the two approaches answers the initial question, i.e. whether the emergent structure of an organization remains the same, regardless of relational turnover: Radical structuralism turns out to be wrong. An answer depends on the dimensions of the structure on which observers focus. The pecking order in itself remains relatively stable, regardless of members’ turnover. However, social differentiation measured in terms of role relationships and division of work shows that the relational structure does not remain the same regardless of members’ turnover. Specifically, relational processes within the organization, such as collective learning, impose varying constraints on different kinds of members over time and the overall relational structure reflects these members’ changing reactions and responses to these constraints. Since the former vary, so do the latter, and so does the resulting emergent overall structure.
Between overload and conflict: dynamics of advice networks
Static analysis of advice networks
We begin by summarizing our knowledge about advice networks. An advice network represents a set of paths through which appropriate information circulates among members of an organized setting (Lazega, 1992). The allocation of this resource through informal ties and interactions reduces the costs of its acquisition during the process of making decisions to solve problems. Members of organizations see expertise and experience as accumulated by
the organization, and they rely constantly on advice from others. However, intra-organizational learning through advice seeking does not simply result from the accumulation of individually and informally acquired information. The process is socially organized in a sophisticated way.
In organizations examined by researchers, advice seeking usually converges towards senior and recognized members with status (Blau, 1964). It reflects a process of cognitive alignment on such members who gained the “authority to know”, who provide social approval for specific decisions, and who contribute to the integration of the organization because they link the individual, group and organizational levels. We think of this alignment as a key ingredient of intra-organizational learning (Lazega et al., 2008). A status hierarchy provides a social incentive for actors to share their knowledge and experience with others, thus helping in explaining the social organization of the learning process. 1
Because advice networks are shaped by such status games, they are usually highly centralized. They exhibit a pecking order that often closely follows the hierarchical structure of the organization2. Members of formal organizations rarely declare that they seek advice from “people below” in this pecking order. In addition to the existence of a core set of central advisors, the periphery of the network can be complex and characterized by homophilous (Lazega and Van Duijn, 1997; McPherson et al., 2001) horizontal ties (i.e. ties among peers). Members use such ties to mitigate the potentially negative effects of this strong rule for intra-organizational action and learning (negative effects resulting, for example, from not being willing to show that one does not know). Thus advice networks tend to be both hierarchical and cohesive (at least within subsets of peers), with the hierarchical dimension usually stronger than the cohesive one. In some firms, advice ties are so important that they also play an important role in facilitating the flows of other kinds of resources in co-work and friendship ties (Lazega and Pattison, 1999; Skerlavaj and Dimovski, 2006).
The generation of a cyclical process
A first, static look at the structure of advice networks thus shows the existence of a pecking order reflecting cognitive status games and cognitive status competition among members. To further explore the link between advice networks and intra-organizational learning, it is important to focus on the temporal and dynamic dimension of this process (Crossan et al., 1999; Bapuji and Crossan, 2004; Easterby-Smith et al., 2000). Learning occurs over time and across levels, if only because members can ‘unlearn’ and because they must combine what they already know to new knowledge that they build in order to make
new decisions. Stable, unchanging advice networks reduce the cost of acquiring timely information, but also increase the risk of acquiring obsolete and inappropriate information. The quality of intra-organizational learning thus depends on changes in these networks. Previous work on the evolution of advice networks has shown that this evolution is characterized by at least two interrelated processes.
First, the number of members with cognitive status varies over time. We can think of several reasons for which this number oscillates, i.e. increases and decreases over time. One reason is that members tend to choose advisors that they perceive to be the most popular (i.e. already chosen by a large number of colleagues). Members sought out by many other members tend to build a reputation; selecting them is perceived to be safe and legitimate. As stressed by a micro-political perspective, everyone seeks status and believes that they will reach a higher status; access to advisors higher up in the ladder becomes in itself a sign of relative status. This implies that a member highly sought out in time t1 becomes even more intensively sought out in time t2 (Lazega et al., 2006).
Second, this behavior creates an overload of requests for advice from a small number of highly central advisors with high cognitive status. Highly sought out advisors often manage this overload by delegating, i.e. referring the advice seeker to other advisors.3 This management of overload threatens the stability of the pecking order in the sense that it brings in new central advisors and requires coordination among the elites in order to avoid destructive status competition and conflicts of definition of the situation between “too many chefs” (Lazega, 2001). In turn, this strategy triggers either formal efforts of coordination among the elites or a new reduction in the number of advisors with high cognitive status through withdrawal of central advisors who become unavailable (due to retirement or delegitimation). This oscillation threatens the stability of the pecking order, with both positive and negative effects on intra-organizational learning.
These are not simple processes. Centralization of advice networks can either remain stable, or increase over time, or decrease over time to reach a balance between elite overload and conflicts of interpretation among them.
Thus, although previous work has shown that there is always a pecking order in advice networks, the pecking order is not necessarily stable over time. Stability of the pecking order is not automatic; it is fragile and threatened, over time, by expansion, turnover, or conflicts among the elite themselves. Centralization of advice networks oscillates, i.e. increases and decreases over time as members of the elite of advisors either leave (and are “replaced” by new members) or try to reach a balance between high individual status and overload on the one hand, and consensus on the definition of the situation on the other hand. Periods of
centralization of advice networks are followed by periods of decline in this centralization, then by periods of recentralization.
Evidence for these processes has been provided by dynamic analyses explaining relational turnover at the local level (Lazega et al., 2006). In this paper, we provide further knowledge about this process by looking at its outcome at the structural level, i.e. by examining blockmodels of these networks. Thus we predict that the structure of the advice network provided by blockmodelling should be more centralized at time t2 than at time t1 of the evolution of this network, and that the blockmodel of this network at time t3 should reflect a less centralized structure. This shows that depending on the stage at which observers measure the network, the structure of the following networks will be different. Thus, we expect that the relational structure does not remain the same regardless of membership turnover.
In order to test this hypothesis and illustrate the usefulness of a combined dynamic and comparative statics approach in the study of the evolution of intra-organizational advice networks, we provide a case study of the evolution of the advice network in a first-level judicial organization, the Commercial Court of Paris (CCP).
A case study: the evolution of the advice network among judges
In this court, the judges perform tasks are that multifaceted and that require multiple skills, for example legal, economic, and managerial. Further, conflict resolution often depends on detailed knowledge of the business and specific industry in which the conflict takes place. In order to cope with such needs for specific knowledge, judges tap into the expertise and experience of their very diverse set of colleagues, by seeking each other for advice intensely.
We collected data of interest at the Commercial Court of Paris to test? the argument of this paper at three points in time (fall 2000, fall 2002, and fall 2005). We interviewed judges at this courthouse about their advice ties to one another and we were therefore able to reconstitute, at each point in time, the complete network of advice ties among the judges.4
To obtain the advice network of the judges the following name generator was used: “Here is the list of all your colleagues at this Tribunal, including the President and
Vice-Presidents of the Tribunal, the Vice-Presidents of the Chambers, the judges, and ‘wise-men’. Using this list, could you check the names of colleagues to whom you have asked advice during the last two years concerning a complex case, or with whom you have had basic discussions, outside formal deliberations, in order to get a different point of view on this case.” An
extensive report on the data gathering and a more in-depth description of the organization of the CCP can be found in Lazega and Mounier (2003).
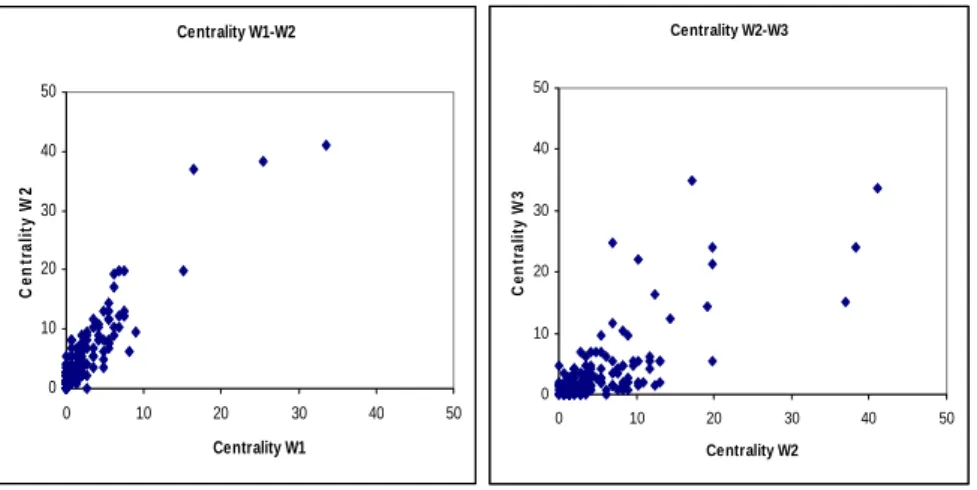
The first wave contains 147 actors, wave 2 contains 156 actors, and the last wave contains 151 actors. The density of the network increases over time, indicating that judges seek more advice from each other over time. In wave 1, the density is 0.03, and in wave 2 and 3 the density is 0.05. The average density over the three waves is 0.04. The simple plots in Figure 1 show high correlations between indegree centralities of the members in the first period (wave 1 and 2) and in the second (wave 2 and 3), which shows that the pecking order is only relatively stable, as predicted. Correlations are respectively 0.9 and 0.7.
-Figure 1 about here-
Dynamics: centralization and decentralization process
Previous work (Lazega et al., 2006) shows that the difference between the two plots actually indicates that centralization of the advice network increases then decreases over time, as members with cognitive status try to avoid overload at the risk of accepting conflicts with other elite advisors. The existence of this oscillation was established using dynamic analyses of the evolution of this network. Table 1 provides a dynamic analysis of the evolution of this network, adapted from our previous work in which we look at the dynamics of advice networks as an oscillation in the centralization of the network. In other words this centralization increases then decreases over time as members with cognitive status try to avoid overload at the risk of accepting conflicts of definition of the situation. Dynamic analyses allowed us to test for the existence of this oscillation. This meant looking more closely at the structural factors that explain relational turnover in the network, i.e. the creation of new ties and the dropping of previously existing ones.
Statistical confirmation for this process is provided by ‘actor-oriented’ network models developed by Snijders et al. (2001, 2004, 2005). The analyses were done by means of SIENA software, available in the StOCNET package (Boer et al., 2006), which is specifically designed to model the evolution of networks over time. The model specification strategy included testing each independent variable on its own and providing a final model that was estimated by including only the significant parameters –with one exception– from the
previous models. Table 1 presents the best (most parsimonious) SIENA models achieved with this dataset.
-Table 1 about here-
These tests confirm that judges show a preference for advice seeking from advisors who are already sought out for advice by others: the ‘Popularity of alter’ effect is strong. During the first period, as shown by a strong ‘Activity of alter’ effect, they do not seek out advice from other judges who themselves seek out advice frequently. As suggested in our descriptive claims, senior judges –who are already central– become even more central. Increasing centrality of already central judges is the main effect produced by the formal dynamic force behind relational turnover in this organization between 2000 and 2002.
Although smaller by comparison with popularity and activity of alter effects, effects captured by a few structural variables are also significant. Reciprocal and transitive relationships also drive relational changes in the advice network in the first period. Judges seek out as advisors members to whom they previously gave advice directly; they also seek out advisors of their advisors. This trend suggests that new ties are established within social sub-groups already identified by actors, reinforcing homophilous evolution. 3-cycles within such groups are associated with a negative parameter, suggesting that generalized exchange is unlikely over time in this fairly hierarchical network. One can also observe that there is a limit to the number of advisors that each judge can seek (a “ceiling effect” in advice seeking, for example for fear of looking incompetent), and that within this limit the concentration of new demands on those who were already important advisors is confirmed. These effects are consistent with Blau’s social exchange theory of advice for status (Blau, 1964).
The second model of Table 1, measuring the evolution of the network for the second period of the study, captures the oscillation between increasing and decreasing centralization of the advice network. In effect, the relational turnover between wave 1 (in 2000) and wave 2 (in 2002) accounted for a phase of increasing centralization. In turn, the subsequent relational turnover between wave 2 (in 2002) and wave 3 (in 2005) accounts for a decreasing centralization of the network. The ‘Popularity of alter’ parameter remains strong: central members still attract new demands for advice and the more central they are the more central they tend to become. However, the fact that a judge seeks advice frequently no longer prevents (during the second period) other judges from seeking advice from him/her: the ‘Activity of alter’ parameter is no longer significant in the second period. This second effect, combined with the first effect and with the drop in the correlation between indegree centrality
in wave 2 and indegree centrality in wave 3, indicates a downward tendency in the second period that did not exist during the first period: many central members lose some of their centrality in this downturn and, as a result, new members become more central than they were before, thus joining this elite of judges with cognitive status.
These results show very clearly that intra-organizational learning, as an informal process, depends on three factors at least. First, the way in which members manage their advice ties in the context of this formal organization. Second, the ways in which central advisors handle overload and conflicts of definition of the situation. Third, the ways in which formal structure can help in dealing with this oscillation of centralization and decentralization of the advice network. In effect, changing levels of centralization over time suggest that this oscillation can weaken collective learning as driven by formal structure.
Comparative statics: the outcomes at the structural level
As outlined above, we now use comparative statics based on blockmodelling to look at the outcome of this dynamic process at the structural level. This provides an illustration of the usefulness of blockmodelling in the study of network evolution. Blockmodelling identifies and tests at the structural level the outcome of relational processes (influence and selection) examined at the sub-structural level with methods that examine the determinants and effects of relational turnover in the network. We argue that both methods are indispensible together to make the most of repeated (longitudinal) network data and its use to bridge the sub-structural (actor-oriented) and sub-structural (collective oriented) levels of analysis.
The blockmodelling approach used here was developed by Snijders and Nowicki (1997) and implemented in software called BLOCKS. Our empirical case examines the overall structure of the advice network among the judges of the same court as above, at each of the three points in time. BLOCKS helps find the ‘best’ possible, i.e. clearest, blockmodel for each measurement of the network.
Stochastic equivalence in BLOCKS
Since the early beginning of social network analysis, positions and roles have played an important part in this field. Blockmodelling is a useful way to obtain clusters of structurally equivalent actors in a network. Blockmodelling was introduced by White, Boorman, and Breiger (1976). Criteria to examine whether actors are equivalent or not from a
relational perspective are for example structural equivalence, regular equivalence and stochastic equivalence. This study uses the criterion of stochastic equivalence to examine the positions of the actors. Stochastically equivalent actors have the same probability distribution of their relations to other classes of actors (Snijders & Nowicki, 2004). Stochastic equivalence considers latent classes, meaning that the data have an underlying class structure of equivalence classes. Stochastic blockmodelling assumes latent blocks, meaning that the network is treated as an observation of a latent partition that is affected by measurement error. The process of stochastic blockmodelling tries to identify the right class structure, the right partition into blocks. The groups that are identified by the criteria for equivalence are referred to as positions or blocks. We will refer to the identified clusters as blocks.
BLOCKS (version 1.8; Snijders & Nowicki, 1997; Nowicki & Snijders, 2001; Snijders & Nowicki, 2004) is a program for stochastic blockmodelling , implemented in StOCNET (Boer et al., 2006). Stochastic blockmodelling assumes latent blocks, meaning that the network is treated as an observation of a latent partition, that is affected by measurement error.
The dyad is the basic relational unit in BLOCKS. Therefore, the data need to be recoded in a so-called ‘new alphabet’: Symmetric relations are coded 1 when there is no relation and 2 when there is a relation. Asymmetric relations receive the value 3 for relations from actor i to j, and a value 4 for a relation from actor j to i. BLOCKS uses a random simulation method to find the blocks, namely Gibbs sampling (see for more information Gelfand (2000) and Casella and George (1992)). A Gibbs sequence leads to convergence at a certain point, after which an after convergence run is carried out, in which the posterior means are calculated. It is not certain after how many iterations a sequence reaches convergence. Snijders and Nowicki (2004) propose to choose the default value of 10,000 for the before and after convergence phase. Because Gibbs sampling is a random simulation method, the results will be different every time one runs an analysis. Therefore, it is best to perform two or three Gibbs sequences to compare the results and decide upon the best blockmodel. If the Gibbs sequences give approximately the same results, the results can be considered reliable.
Since no partition is known beforehand, a decision has to be made about the number of blocks. The best way to do this is to ask for a different number of blocks, for example two to five blocks. BLOCKS will provide three Gibbs sequences for each number of blocks (so if you asked for two to five, the output contains twelve blockmodels). Choosing the best block is “a matter of fit and interpretability” (Snijders & Nowicki, 2004, p. 7). As fit statistics, an information parameter (Iy) and a clarity parameter (Hx) are provided. Both need to be close to
the information parameter indicates that the relation between the vertices is determined by the classes in which they are. The clarity parameter indicates whether or not there is a clear block structure. The model with the lowest fit parameters shows the clearest block structure and thus is the best to choose for interpretation. There is no threshold value to indicate when a model is acceptable or not. To decide whether the model can be accepted or not, the fit parameters must show similar values. The best model can be chosen from several models by looking at which model shows the lowest fit parameters5.
An extensive description of the output and its interpretation can be found in the manual of BLOCKS (Snijders & Nowicki, 2004). The information parameter is presented, together with the new partition. After the reordered matrix, the clarity parameter is provided. In the section ‘Finding strictly separated classes’, vertices that do not fit into the model are “thrown out”. If the model still does not fit well enough, this process is repeated a second time. The “thrown out” actors are put together in a null block, and their relations to both other classes are given at the end of the output. Furthermore, the actors that are thrown out might not fit optimally in a block regarding their equivalence, but they fit in terms of other attributes, which are shown in the analyses. This measure is much weaker than the information and clarity parameter. Therefore, we choose to leave the ‘outliers’ in the initial partition in the following analyses, meaning that we choose not to leave actors out of the analyses. The measures of fit given in the output correspond to the initial partition, and they are acceptable given the criteria mentioned above.
Successive outcomes of the cyclical process
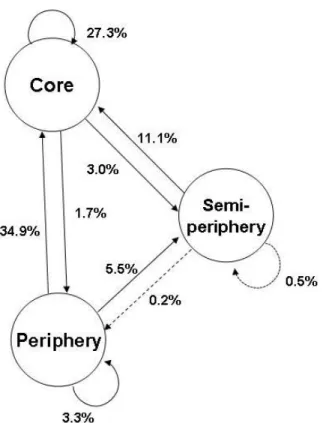
Applied to Wave 1 data, BLOCKS divides the data in three blocks consisting of 4, 67, and 60 actors, respectively. The model fit is good (0.23 for the Iy and 0.18 for the Hx), at least
better than that of the analysis with a division into two blocks (0.25 and 0.25 respectively). The model fit for a model with four blocks was less good than the model with three blocks (Iy
was 0.22 and Hx was 0.30).
The density within the overall network and within the blocks is used to generate an image matrix from the data. An image matrix is a simplification of the blocked matrix, in which the rows and columns refer to positions in case of individual actors (Wasserman & Faust, 1994). The blocks, filled with a 1 or a 0, are called oneblocks or zeroblocks. Because actors are almost never perfectly structurally equivalent, blockmodelling searches for approximately structurally equivalent actors (Wasserman & Faust, 1994). Using a threshold value is a good way to define the positions, since searching for complete one or zeroblocks is
difficult and most often too strict. A threshold value often used is the average density in the network; values below this average become zeroblocks, values above this average become oneblocks.
-Figures 2a and 2b about here-
Figure 2a shows the reduced graph6 of the relations between the positions and their probabilities of having a tie to each other. Block 1 is referred to as the core, block 2 the semi-periphery, and block 3 the periphery. The core receives most requests for advice from the periphery, the semi-periphery, and from itself; average indegree centrality of its super-central members is 33. The core seeks advice from semi-periphery and periphery, but much lower probability than to its own members. Average indegree centrality of semi-periphery members is 3.82; for periphery members this value is 2.58.
The actors within the core seek advice from all other blocks. The same holds for the periphery. The semi-periphery only seeks the core for advice, and is sought out by the core and periphery. The periphery is sought out by the core and by members of its own block. The core is sought out for advice by all other blocks. Members in the core are characterized by high indegree centrality and share attributes such as status of being president of chamber in the court.
The solid lines in figure 2a indicate that there is a tie defined by the image matrix, whereas the dotted lines refer to zeros in the image matrix. The probabilities therefore clarify the relations between and within the blocks, and indicate the probability with which members of a group ask members of another group (e.g. Flandreau & Jobst, 2005).
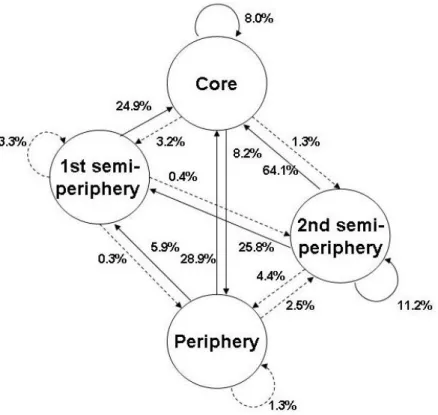
Applied to Wave 2 data, BLOCKS divides the network into four blocks, as shown in Figures 3a and 3b, with an information parameter of 0.31, and a clarity parameter of 0.11. These measures of fit are lower than those of the blockmodel of three blocks and than that of two blocks, indicating that this model is better. The blocks consist of 83, 42, 28, and 3 actors, respectively. The core block consists of three actors, who are most central, most senior, and more often presidents of chamber. The second block (the 1st semi-periphery) consists of actors who work in the service sector, and a number of presidents of chamber. The third block (2nd semi-periphery) has the highest outdegree and the periphery is the most punitive.
The density in the network is 0.05. Figure 3a shows the reduced graph of the relations between the positions and their probabilities of having a tie to each other. On the basis of their position in the network the labels are defined: the 1st and 2nd semi-periphery are both in between the core and the periphery. In the core, average indegree centrality of its super-central members increases to 56.33. The number of core members is still the same but their average centrality has increased. Average indegree centrality of the members of the first semi-periphery is now 14.62; for the second semi-semi-periphery members this value is 8.71; for periphery members, it is 2,69. As expected, this shows a more centralized structure than that reconstituted in Figures 2a and 2b.
Applied to Wave 3 data, BLOCKS divides the data into two blocks of N= 134, and N= 17, as shown in Figures 4a and 4b, with a clear core and periphery structure. The model fit is good, an information parameter of 0.36, and a clarity parameter very close to zero (0.04). The overall density is 0.05 (5.17 percent) The periphery is not sought out for advice by any of the other groups. The core is sought out by both blocks. In the core, average indegree centrality of its super-central members decreases to 30.12. Average indegree centrality of the members of the periphery is now 4.93.
-Figures 4a and 4b about here-
The core consists again of the most central actors. Further, actors in the core more often work in the bank and finance sector with a law degree, are more senior, are often president of chamber and possess a law degree. The periphery contains most actors working in the bank and finance sector, without a law degree. The periphery has a high outdegree, but the core itself has a high outdegree as well. The core seeks advice within the own block, and the periphery seeks advice from the core. Figure 4a shows the reduced graph.
In sum, the first wave shows three blocks, presenting a clear core-semi-periphery-periphery structure. The core block includes the most central actors in the network, i.e. members who are presidents of chamber in all three waves. Over time the structure changes. The second wave shows four blocks with the periphery subdivided into two semi-peripheries, and the third wave divides the network into two blocks, back to a simpler core-periphery structure, but with an expanded core. This structure confirms the existence of a hierarchical pecking-order in the organization.
Relative structural stability regardless of membership turnover
This analysis shows an evolution of the overall structure from three to four to two positions. It confirms our expectations based on the cyclical process characterizing the evolution of the advice network. The four-position structure of the second wave shows a more centralized structure (with more members in the core than in the previous measurement), although more fragmented, than the initial three-position structure. The picture of the two-position structure of the third wave shows a less centralized structure (although less fragmented) than the previous three-position or four-position structures: there are many more central members in the core block). Increased centralization with fewer members in the core also means higher fragmentation. As illustrated by the figures, this is confirmed by the fact that the core in the third structure contains more members than the core in the first two structures.
This analysis shows the added value of comparative statics based on blockmodelling, i.e. the usefulness of computing and visualizing, at each stage of the evolution of the network, the outcome of the underlying relational turnover using positional analysis. Verification of the overlap in the composition of Wave 1, 2 and 3 block members over time shows that the structure does remain stable to some extent over time, but that this stability is quite relative to the moment of the underlying process (driving the evolution of the structure) at which the observer looks at this structure.
Table 2 shows that none of the three blocks in wave 1 neatly disintegrates into two separate blocks. In the period from wave 1 to wave 2 the block structure changes; the number of blocks changes, and the composition as well. The only group that stays rather stable over time is the core. The only group that shows a clear result is the elite. Two of the three elite judges in wave 1 are in the elite in wave 2. A new actor climbed up to the core group between the two measurements. Another judge, who was in the core in wave 1, moved “down” the pecking order to the 1st semi-periphery in wave 2.
-Table 2 about here-
Since the number of judges and the actors in the data differ over time, it is not striking that the composition of the blocks changes. Among newcomers (actors who were not present in wave 1, but are newcomers in wave 2), for example, 93 percent cluster together in the periphery in wave 2. This means that almost all newcomers seek advice from the same group of elite judges. Among the newcomers, three actors (7 percent) can be found in the 2nd
semi-periphery. None of the newcomers end up in the elite core. As seen in the dynamics analysis, the more junior the judges the less they are sought out for advice.
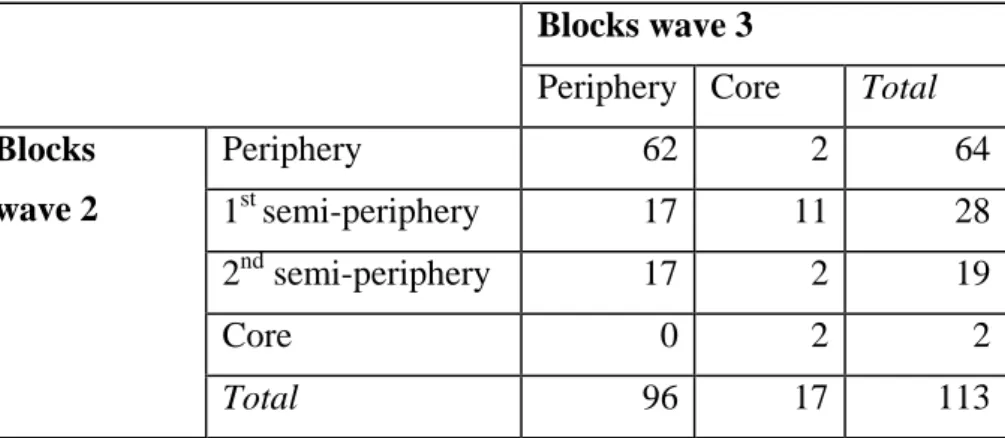
Table 3 shows that, in the change from wave 2 to wave 3, the judges from the 1st semi-periphery end up mostly in the semi-periphery, but a large share of these judges (65 percent), compared to the other blocks, ends up in the core group. Furthermore, all actors who were in the core block in wave 2, are in the core in wave 3.
-Table 3 about here-
Thus, the blocks are not stable over time. Positions do not disintegrate and integrate again. The formed blocks are different in their composition, if only because there are newcomers in each wave. Thus, we cannot identify a strictly stable structure over time, regardless of who the actors in the blocks are. The only true stability comes from the composition of core blocks which contain actors with high seniority. From the first to the second wave actors who end up in the most central groups are present in both waves, and from the second to the third wave the core is formed by actors who have been around in all three waves. Looking at the evolution of the peripheral groups from wave 1 to wave 2 shows that a large share (42 percent) of the actors in the periphery also ends up in the periphery in wave 2. However, the two semi-peripheries that are found in wave 2 are not composed of the one in wave 1. The semi-periphery in wave 1 is for the largest part split into the periphery and 1st semi-periphery. Both the structure and the composition of its elements at the overall level change over time.
Conclusion
Our conclusion is that the emergent relational structure in an organization does not remain the same, regardless of the turnover of its members. Radical structuralism is shown to be wrong in organized settings. Illustration is provided by comparative statics in the analysis of the evolution of network structure over time. We use blockmodelling to identify and test at the structural level the outcome of endogenous relational processes previously examined at the sub-structural level. Results confirm our cyclical model for the evolution of the advice network in an organization, the Commercial Court of Paris. The centrality scores of members with cognitive status increase, then tend to decrease over time. The composition of the core block changes, and the number of members in it increases after a period of centralization of
the network. In sum, the underlying social process, collective learning through networks, is driven by relational turnover, centralization then decentralization of the advice network, strategies of stabilization and creation of consensus among the elite, and the central place of a subgroup of senior actors. Both dynamics and comparative statics are jointly combined to address the issue of the extent to which the emergent relational structure in an organization remains the same, regardless of the turnover of its members. The answer to the overall question of the stability of the structure regardless of the turnover of its members is that it depends on the stage of the process driving the evolution of the structure at which observation takes place.
Acknowledgments
We would like to thank Germain Barré, Marijtje van Duijn, Frédéric Godart, Gijs Huitsing, Anke Munniksma, Tom Snijders, and Christian Steglich for help and advice.
References
Bapuji, Hari, Crossan, Mary M. 2004. "From Questions to Answers: Reviewing Organizational Learning Research". Management Learning, 35:397-417.
Blau, Peter M. 1964. Exchange and Power in Social Life. New York: John Wiley.
Boer, P., Huisman, M., Snijders, T. A. B., Steglich, C. E. G., Wichers, L. H. Y., & Zeggelink, E. P. H. (2006). StOCNET: An open software system for the advanced statistical analysis of social networks (Version 1.7). Groningen: ICS / SciencePlus.
Borgatti, Stephen P. and Cross, Rob. 2003. "A Relational View of Information Seeking and Learning in Social Networks". Management Science, 49:432-45.
Brass, Daniel J. 1984. "Being in the Right Place: A Structural Analysis of Individual Influence in an Organization". Administrative Science Quarterly, 29:518-539.
Casella, G., & George, E.I. (1992). Explaining the Gibbs sampler. The American Statistician,
46, 167-174.
Cross, Rob, Borgatti, Stephen P., Parker, Andrew. 2001. "Beyond answers: dimensions of the advice network". Social Networks, 23: 215–235.
Crossan, Mary M., Lane, Henry W., and White, Roderick E. 1999. "An Organizational Learning Framework; From Intuition to Institution". Academy of Management Review, 24:522-37.
Easterby-Smith, Mark, Crossan, Mary and Nicolini, Davide. 2000. "Organizational Learning: Debates Past, Present and Future". Journal of Management Studies, 37: 783-96.
Flandreau, M., & Jobst, C. (2005). The ties that divide: A network analysis of the international monetary system, 1890-1910. The Journal of Economic History, 65, 977-1007).
Gelfand, A.E. (2000). Gibbs sampling. Journal of the American Statistical Association, 95, 1300-1304.
Kilduff, Martin and Tsai, Wenpin. 2003. Social networks and organizations. Thousand Oaks, CA: Sage.
Krackhardt, David. 1987. "Cognitive Social Structures". Social Networks, 9 :109-134.
Krackhardt, David. 1990. "Assessing the Political Landscape: Structure, Cognition, and Power in Organizations". Administrative Science Quarterly, 35:342-369.
Lazega, Emmanuel (1992), Micropolitics of Knowledge: Communication and Indirect
Control in Workgroups, New York, Aldine-de Gruyter.
Lazega, Emmanuel (1995), "Concurrence, coopération et flux de conseil dans un cabinet américain d'avocats d'affaires: Les échanges d'idées entre collègues", Revue Suisse de
Sociologie, 21:61-85.
Lazega, Emmanuel (2001), The Collegial Phenomenon: The Social Mechanisms of
Cooperation Among Peers in a Corporate Law Partnership, Oxford, Oxford
University Press
Lazega, Emmanuel and Van Duijn, Marijtje (1997), "Position in formal structure, personal characteristics and choices of advisors in a law firm: A logistic regression model for dyadic network data", Social Networks, 19:375-397.
Lazega, Emmanuel and Pattison, Philippa (1999), "Multiplexity, Generalized Exchange and Cooperation in Organizations", Social Networks, 21:67-90.
Lazega, Emmanuel and Mounier, Lise (2003), "Interlocking Judges: On Joint External and Self-Governance of Markets", in Vincent Buskens, Werner Raub and Chris Snijders (eds), Research in the Sociology of Organizations, 20: 267-296, Elsevier.
Lazega, Emmanuel, Lemercier, Claire et Mounier Lise (2006), "A spinning top model of formal structure and informal behaviour: Dynamics of advice networks in a commercial court", European Management Review, 3:113-122
Lazega, Emmanuel, Lise Mounier, Tom Snijders et Paola Tubaro (2008), "Réseaux et controverses: De l’effet des normes sur la dynamique des structures", Revue
française de sociologie, 49 : 467-498
McDonald, Michael L. and Westphal, James D. 2003. "Getting by with the advice of their friends: CEOs’ advice networks and firms’ strategic responses to poor performance".
Administrative Science Quarterly, 48: 1–32.
McPherson, J.Miller, Smith-Lovin, Lynn and Cook, James M. 2001. "Birds of a Feather: Homophily in Social Networks". Annual Review of Sociology 27, 415-444.
Nowicki, K., & Snijders, T.A.B. (2001). Estimation and prediction for stochastic blockstructures. Journal of the American Statistical Association, 96, 1077-1087.
Snijders, Tom A.B. 2001. "The statistical evaluation of social network dynamics". In Michael E. Sobel & Mark P.Becker (eds.), Sociological Methodology, pages 361-395. London: Basil Blackwell.
Snijders, Tom A.B. 2004. "Simulation-based statistical inference for evolution of social networks". Paper presented at the Sunbelt conference, Slovenia.
Snijders, Tom A.B. 2005. "Models for Longitudinal Network Data". Chapter 11 in Peter Carrington, John Scott and Stanley Wasserman (eds.). Models and Methods in Social
Network Analysis. New York: Cambridge University Press.
Snijders, Tom A.B. and Huisman, Michael. 2002. Manual for SIENA version 1.95. Groningen: ICS/Dept. of Statistics & Measurement Theory, University of Groningen. SNIJDERS, T.A.B., STEGLICH, C.E.G., SCHWEINBERGER, M., HUISMAN, M. Manual for SIENA
version 3.11. Groningen: University of Groningen, ICS. Oxford: University of Oxford,
Department of Statistics, 2007. http://stat.gamma.rug.nl/stocnet.
Snijders, T.A.B., & Nowicki, K. (1997). Estimation and prediction for stochastic blockmodels for graphs with latent block structure. Journal of Classification, 14, 75-100.
Snijders, T.A.B., & Nowicki, K. (2004). Manual for BLOCKS version 1.6. Groningen: ICS/Dept. of Statistics & Measurement Theory, University of Groningen.
Škerlavaj, Miha and Dimovski, Vlado (2006). Social network approach to organizational learning. Journal of Applied Business Research, 22: 89-97.
Tsaï, Wenpin. 2002. "Social structure of coopetition within a multiunit organization: coordination, competition, and intra-organizational knowledge sharing".
Organisation Science, 13:179-190.
Tubaro, Paola, Lazega, Emmanuel and Mounier, Lise (2008), "Further explorations of the spinning top model for de dynamics of advice networks and collective learning", in Marc Lecoutre et Pascal Lièvre (eds.), Management et réseaux sociaux, Londres, Hermès-Lavoisier
Wasserman, S., & Faust, K. (1994). Social network analysis: methods and applications, New York: Cambridge University Press.
White, H.C., Boorman, S.A., & Breiger, R.L. (1976). Social structure from multiple networks I. Blockmodels of roles and positions. American Journal of Sociology, 81, 730-779.
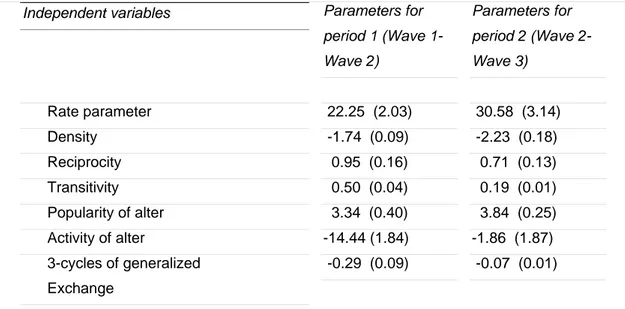
Table 1 Collective learning as a cyclical process: Increasing, then decreasing, centralization of an advice network over time
Independent variables Parameters for
period 1 (Wave 1-Wave 2) Parameters for period 2 (Wave 2-Wave 3) Rate parameter 22.25 (2.03) 30.58 (3.14) Density -1.74 (0.09) -2.23 (0.18) Reciprocity 0.95 (0.16) 0.71 (0.13) Transitivity 0.50 (0.04) 0.19 (0.01) Popularity of alter 3.34 (0.40) 3.84 (0.25) Activity of alter -14.44 (1.84) -1.86 (1.87) 3-cycles of generalized Exchange -0.29 (0.09) -0.07 (0.01)
This table presents two SIENA models analyzing the evolution, over five years, of the advice network among judges at the Commercial court of Paris (2000-2005). The rate parameter models the amount of change between two observations of the network, i.e. the speed by which the dependent variable changes. The ‘density’ effect accounts for the observed network density (based on the outdegree of each actor) and can be interpreted as an intercept. The positive reciprocity effect indicates that the tendency to reciprocate an advice relationship drives the evolution of the network. The positive transitivity effect indicates that the tendency to seek advice from one’s advisor’s advisor also drives the evolution of the network. The negative ‘3-cycle of generalized exchange’ effect indicates that the tendency to seek advice from an advisee of an advisee does not drive the evolution of the network; this effect shows that status differences do matter in advice seeking among judges, since they do not seek advice from judges “below” them in the pecking order. The ‘Popularity alter effect’ measures the extent to which members tend to select as advisors other members who are already sought out for advice, and that this tendency drives changes in the network. The strength and positive value of this parameter indicates that this is the main effect explaining changes in the network: central advisors become even more central over time. The ‘Activity of alter’ effect measures the extent to which members who seek out many advisors tend to be sought out themselves as advisors. The negative parameter means that this tendency does not drive the evolution of the network. However, this parameter is not significant for the second period, which indicates that during this period network centralization decreases. N=91 for period 1 and N=113 for period 2. Standard errors in parentheses. MCMC (Markov Chain Monte Carlo) estimation procedure.
Figure 1. A stable pecking order in the advice network among judges Centrality W2-W3 0 10 20 30 40 50 0 10 20 30 40 50 Centrality W2 C e n tra li ty W 3 Centrality W1-W2 0 10 20 30 40 50 0 10 20 30 40 50 Centrality W1 C e n tra lit y W 2
Figure 2a Reduced graph three blocks, wave 1, with intra- and inter-block densities
Figure 2b Network wave 1, 3 blocks: ‘Core’ (in red), ‘semi-periphery’ (green), and
Figure 3a Reduced graph, four blocks, wave 2, with intra- and inter-block densities
Figure 3b Network wave 2, four blocks, ‘core’ (red), ‘first periphery’ (yellow), ‘second
Table 2 Overlap in composition of Wave 1 block members with Wave 2 block members Blocks wave 2 Periphery 1st semi-periphery 2nd semi-periphery Core Total Core 0 1 0 2 3 Semi-periphery 22 29 8 1 60 Periphery 21 12 17 0 50 Blocks wave 1 Total 43 42 25 3 113
Table 3 Overlap in composition of Wave 2 block members with Wave 3 block members Blocks wave 3
Periphery Core Total
Periphery 62 2 64 1st semi-periphery 17 11 28 2nd semi-periphery 17 2 19 Core 0 2 2 Blocks wave 2 Total 96 17 113
Endnotes
1
For example, social exchange and status help solve a learning dilemma in which it is rational for individuals to pursue the maximum organizational share of joint learning by taking more knowledge than they give; at the same time, the relative withholding of knowledge reduces the total amount of joint learning from which they attempt to appropriate their individual share (Larson et al., 1998)..
2
See for example Borgatti and Cross, 2003; Brass, 1984; Cross et al., 2001; Hansen, 2002; Kilduff and Tsaï, 2003; Krackhardt, 1987, 1990; Lazega, 1992, 1995, 2001; McDonald and Westphal, 2003; Tsaï, 2002.
3
Even when they do not delegate, the equilibrium remains fragile. As concentration of cognitive authority increases with centralization of the advice network, learning becomes dependent upon a decreasing number of sources of authoritative knowledge. As advice provided by this small number of sources starts becoming inaccessible or inappropriate (irrelevant, inaccurate, untimely), members tend to turn to other sources of advice and create new “stars” in the learning process. This increases the number of central advisors and reduces the centralization of the network until some of the old stars exit the system.
4
The number of judges varied between 147 and 156 between 2000 and 2005, with an 87.1% average response rate over the three measurements.
5
One of the advanced options worth mentioning here is the concentration parameter. The higher this parameter, the higher the tendency of BLOCKS to generate blocks of equal size (Snijders & Nowicki, 2004). The default value of the concentration parameter is 100, meaning that the risk to obtain groups with very few actors is diminished. However, obtaining blocks of for example three actors can yield very meaningful results, for instance when these three actors are highly central and similar in their attributes. If one does not wish equally sized groups, one can choose a concentration parameter of 0.
6