HAL Id: tel-01258289
https://tel.archives-ouvertes.fr/tel-01258289
Submitted on 18 Jan 2016HAL is a multi-disciplinary open access archive for the deposit and dissemination of sci-entific research documents, whether they are pub-lished or not. The documents may come from teaching and research institutions in France or abroad, or from public or private research centers.
L’archive ouverte pluridisciplinaire HAL, est destinée au dépôt et à la diffusion de documents scientifiques de niveau recherche, publiés ou non, émanant des établissements d’enseignement et de recherche français ou étrangers, des laboratoires publics ou privés.
Pavement-Watering in Cities for Urban Heat Island
Mitigation and Climate Change Adaptation
Martin Hendel
To cite this version:
Martin Hendel. Pavement-Watering in Cities for Urban Heat Island Mitigation and Climate Change Adaptation : A Study of its Cooling Effects and Water Consumption in Paris. Engineering Sciences [physics]. Univeristé Paris Diderot Paris 7, 2015. English. �tel-01258289�
Université Paris.Diderot (Paris 7) Sorbonne Paris Cité
Ecole Doctorale de Physique en Ile-de-France ED 564
Laboratoire Matière et Systèmes Complexes UMR 7057
Doctorat
Sciences Pour l’Ingénieur
Pavement-Watering in Cities for Urban Heat
Island Mitigation and Climate Change
Adaptation
A Study of its Cooling Effects and Water Consumption
in Paris
L’arrosage urbain comme moyen de limitation des îlots
de chaleur urbains et d’adaptation au changement
climatique
Etude de ses effets rafraîchissants et de sa consommation
d’eau à Paris
Thèse dirigée par Laurent ROYON
Soutenue par Martin HENDEL
le vendredi 16 octobre 2015
Jury
M. Hassan Peerhossaini Président
M. Mat Santamouris Rapporteur
M. Valéry Masson Rapporteur
M. Hervé Andrieu Examinateur
Mme Morgane Colombert Invitée, Encadrante
M. Dominique Coutart Invité, Encadrant
M. Youssef Diab Invité, Co-directeur
i
Abstract
This dissertation examines pavement-watering as a cooling strategy for cities seek-ing to reduce the intensity of their urban heat island (UHI) and/or as an adaptation tool against increasing heat wave frequency and intensity resulting from climate change. This research is based on measurements obtained from a field experiment of pavement-watering conducted at two sites in Paris, France over the summers of 2013 and 2014.
First, an analysis method was developed to determine the method’s micro-climatic effects in the field. Air temperature, relative humidity and mean radiant temperature effects were investigated as well as pedestrian thermal comfort using the Universal Thermal Climate Index and UHI-mitigation. Second, the thermal effects of pavement-watering were determined, including surface temperature as well as pavement heat flux and temperature 5 cm deep. Finally, the water footprint of pavement-watering was determined based on a linear relationship found between pavement heat flux and solar irradiance. In addition, possible improvements for the watering method were determined and discussed.
The research provides useful information for decision-makers considering pavement-watering as part of their heat-wave adaptation and/or UHI-mitigation strategy. Future work should focus on the effects of different materials and street config-urations on pavement-watering cooling as well as cumulative effects arising from watering large areas rather than a single street portion. Certain methodological aspects also require further investigation and may be improved.
Keywords: Pavement-watering; urban heat island; urban cooling; climate change adaptation; urban field measurements; evaporative cooling
ii
Résumé
Ce manuscrit s’intéresse à l’arrosage urbain en tant que stratégie de rafraîchisse-ment pour les villes souhaitant réduire l’intensité de leur îlot de chaleur urbain (ICU) et/ou en tant qu’outil d’adaptation aux canicules, amenées à devenir plus fréquentes et intenses en raison du changement climatique. Cette recherche s’appuie sur une expérimentation d’arrosage réalisée à Paris (France) sur deux sites pendant les étés 2013 et 2014.
D’abord, une méthode d’analyse a été mise au point afin de déterminer les effets micro-climatiques de l’arrosage sur le terrain. La température de l’air, l’humidité relative et la température moyenne de rayonnement ont été examinées ainsi que le confort thermique du piéton grâce au Universal Thermal Climate Index et le pouvoir d’atténuation de l’ICU. Ensuite, les effets thermiques ont été quantifiés, comprenant les effets sur la température de surface ainsi que le flux de chaleur et la température à 5 cm de profondeur. Enfin, la consommation d’eau de l’arrosage a été estimée à partir d’une relation linéaire trouvée entre le flux de chaleur à 5 cm de profondeur et le rayonnement solaire incident pendant la période d’ensoleillement direct. Par ailleurs, des améliorations de la méthode d’arrosage ont été déterminées et discutées.
Les analyses conduites ici fournissent des informations essentielles pour les décideurs intéressés par l’arrosage urbain comme volet de leur stratégie de réduc-tion des ICUs et/ou d’adaptaréduc-tion aux canicules. Les recherches à venir devraient s’orienter sur l’impact d’autres matériaux et configurations urbaines sur l’arrosage ainsi que les effets cumulés atteints lorsqu’un quartier entier est arrosé plutôt qu’une portion de rue. Certaines modifications de la méthode méritent également d’être étudiées.
Mots-clés : Arrosage urbain; îlot de chaleur urbain; rafraîchissement urbain; adaptation; changement climatique; mesures de terrain; rafraîchissement évapo-ratif
iii
Remerciements
Je commencerai ces remerciements par quelques mots sur le long parcours de genèse de cette thèse. Je me suis efforcé de le résumer tout en veillant à remercier tous ceux qui m’auront accompagné et demande pardon à ceux que j’aurais oublié. Au commencement, il a fallu imaginer qu’une thèse était un choix de carrière possible. Je dois cette idée à Olivier Mirgaux que je remercie pour ses conseils donnés un vendredi matin fin 2008 pendant un cour d’introduction à l’analyse de cycle de vie aux Mines de Nancy. Malgré ses très bons conseils, il aura fallu atten-dre mon retour à Paris début 2011 pour que j’envoie mes premières candidatures. En attendant d’être retenu par une équipe, j’ai été recruté à La Caféothèque en tant que barista-sommelier en café, période rebaptisée plus tard ”Pause Café” par Gloria Montenegro Chirouze. Je tiens à remercier ici Bernard, Gloria et Christina Chirouze pour leur accueil chaleureux et le temps passé ensemble à la Caféothèque ainsi qu’à mes collègues devenus très bons amis Gérald, Laura et Pierre-Jacques. En parallèle, je candidatais à des offres de thèse et c’est ainsi que j’ai pris contact avec Morgane Colombert pour la première fois. Ma première candidature n’ayant pas été retenue (merci Etienne !), elle m’a invité à répondre à une deux-ième offre, une thèse CIFRE avec la Ville de Paris sur le rôle de l’eau en ville. Très sceptique initialement, j’ai suivi son conseil. En sortant de l’entretien quelques jours plus tard, j’étais entièrement convaincu par ce sujet qui était non seulement passionnant, mais correspondait parfaitement à mes attentes.
Je remercie ici Morgane de m’avoir suggéré cet autre sujet qui s’est révélé infiniment plus intéressant que ce j’ai pu imaginer au départ. Je la remercie à nouveau ainsi que Laurent Royon, Youssef Diab et Dominique Coutart de m’avoir suivi et surtout soutenu pendant la longue période d’incertitude qui a suivi.
En effet, il aura fallu 18 mois de plus pour que toutes les conditions soient réunies pour démarrer mon contrat CIFRE : candidature ANRT, validation par celle-ci puis vote final par le Conseil de Paris. Pendant ce temps, j’ai prolongé mon séjour à La Caféothèque, rejoint les rangs de l’EIVP en tant qu’ingénieur d’études puis ceux de la Ville de Paris en tant que saisonnier. Début janvier 2013, ma thèse a enfin pu démarrer.
Je souhaite faire part de ma reconnaissance profonde envers l’équipe qui m’a encadré pendant ce travail. Merci à mon directeur, Laurent Royon, pour ces trois années de collaboration et de réflexion communes très riches. Merci de tes conseils et commentaires qui m’ont aidé à améliorer la qualité de mes travaux et merci pour ton soutien au-delà de la thèse (vacations d’enseignement, poste d’ATER, etc.). J’adresse également mes remerciements à Dominique Coutart pour son soutien aussi bien logistique et administratif que managérial qui s’est révélé extrêmement précieux dans le cadre des nombreuses négociations et discussions nécessaires pour préparer les expérimentations in situ décrites dans ces pages. Merci aussi à Youssef et Morgane pour leur confiance et leur accompagnement tout au long de ce projet.
iv
que mes examinateurs Hervé Andrieu et Hassan Peerhossaini pour leur travail de lecture et de critique constructive. Merci d’avoir accepté de faire partie de mon jury de thèse et pour les échanges très intéressants que nous avons pu avoir.
J’adresse également mes remerciements aux nombreuses équipes de la Mairie de Paris qui se sont mobilisées pour m’aider à mener ce projet à bien : SPE qui m’a accueilli tout d’abord, mais aussi la SAP, notamment les circonscriptions Ouest et Est ainsi que l’atelier Deleusseux, DSR, DEI, DII, STPP, SCGIQ, AEU, DVD... Je tiens aussi à saluer les participants du groupe de travail ”Expérimentation de rafraîchissement de l’espace public par arrosage” que j’ai piloté à la Ville pendant mes trois années de thèse. Un très grand merci à Jérôme et à Damien du LEM pour notre étroite collaboration qui se poursuit, ainsi qu’à Anne, Jean-Marc et Claude sans qui mes essais au LEM n’auraient pas pu se dérouler dans d’aussi bonnes conditions. Merci à Julien de l’APUR pour notre collaboration qui se poursuit au-delà de la thèse.
Je tiens à remercier mes anciens et nouveaux collègues de l’EIVP pour le temps passé ensemble, pour les nombreuses et longues discussions scientifiques ou non, les dîners, godets, craquages, fous rires et dégustations en tout genre : Char-lotte, Etienne, Marie T, Angel, Fatiha, Alberto, Claire, Brice, Jeanne, Samuel, Marie B, Joffrey, Serge et Antoine. Je souhaite bon courage à ceux qui pour-suivent ou démarrent à peine leur thèse. Merci encore à Etienne pour sa mise en page amplement exploitée dans ce mémoire, dommage qu’elle ne t’ait finalement pas servi. Merci également aux collègues de la Ville de Paris pour leur accueil chaleureux et les bons moments passés ensemble au 5e, 4e et 1er étages. Merci à Maxime, Arnaud et Mathieu du laboratoire MSC pour nos discussions et échanges également.
Je salue également Carolina, Noushig, Abood, Karina et Florine pour nos collaborations et échanges, ainsi que Brice Tréméac et Mathieu Guilhot pour leur accueil chaleureux au CNAM et à l’IUT de Marne-la-Vallée en tant que vacataire. Je souhaite également remercier tous mes amis, tout particulièrement ceux qui ont participé de près ou de loin à certains projets ou discussions : soirée thermographique avec Marie et Julien, analyses statistiques avec Guti, déjeuners Chez Prune avec Simon(s), Alex, JB, Jérém’, Guti et Manon. Je remercie Char-lotte, Olivier et Thomas pour leur aide précieuse pendant la préparation de la soutenance. Merci à celles et à ceux qui ont participé au buffet.
Merci à l’ensemble de ma famille pour leur soutien et nos discussions, à Isa, Fifi et Zab pour leurs relectures très utiles et à Antoine pour sa participation à une des balades thermographiques. Merci à Marc V de m’avoir soutenu et encouragé pendant le montage, long et stressant, de ce projet. Je suis bien triste de ne pas pouvoir partagé son aboutissement avec toi. Je pense que tu en serais fier.
Enfin, je dédie ce mémoire à Sophie que je remercie du fond du cœur pour son soutien sans faille depuis plus de 10 ans. Ensemble, nous aurons réussi à mener à bien plusieurs projets en parallèle : voyages, achat et travaux d’appartement, thèse de doctorat, etc. J’espère que nous continuerons encore longtemps à réaliser nos projets ensemble. Je t’aime.
Contents
Contents v
List of Figures ix
List of Tables xii
Acronyms and Abbreviations xv
List of Symbols xvii
1 Introduction 1
2 Scientific Background 5
2.1 Urban Climate and the urban heat island (UHI) Effect . . . 5
2.2 UHI Countermeasures . . . 7
Reflective Materials. . . 8
Urban Greening. . . 9
Other Materials . . . 9
2.3 Expected Cooling Effects . . . 10
2.4 Conclusion . . . 11
3 Literature Review of Pavement-watering 13 3.1 Brief Description and Methodology . . . 14
Brief Description . . . 14
Watering Method. . . 15
Analysis Method . . . 18
3.2 Cooling Effects of Pavement-Watering . . . 19
Micro-climatic Indicators . . . 19
Thermal Indicators . . . 24
3.3 Conclusion . . . 26 4 Knowledge Gaps and Remaining Research Questions 29
vi CONTENTS
1 Micro-climatic Effects of Pavement-Watering 31
5 Introduction to Part 1 33
6 Methodology 35
6.1 Location . . . 35
6.2 Watering Method . . . 37
Weather conditions . . . 38
Water Sprinkling Technique . . . 39
6.3 Instruments . . . 40
6.4 UHI Mitigation Potential . . . 42
6.5 Thermal Comfort Evaluation . . . 42
6.6 Heat Transfer Analysis . . . 42
6.7 Data Series . . . 43
6.8 Interpretation of Micro-climatic Effects . . . 44
7 Direct Case-Control Comparison 45 7.1 Results . . . 45
7.2 Interstation Profile on Reference Days . . . 48
7.3 24-hour Average Differences. . . 49
7.4 Conclusion . . . 50
8 Interstation Behavior on Reference and Watered Days 51 8.1 Statistical Analysis Method . . . 51
8.2 Results . . . 52
8.3 Discussion . . . 56
8.4 Conclusion . . . 61
9 Conclusion of Part 1 63 2 Thermal Effects of Pavement-Watering 67 10 Introduction to Part 2 69 11 Methodology 71 11.1 Instruments . . . 71
11.2 Pavement Zones . . . 73
11.3 Pavement Heat Balance . . . 75
11.4 Data Analysis . . . 76
Pavement Heat Flux . . . 77
Surface Temperature . . . 77
Pavement Temperature . . . 77
CONTENTS vii
12 Pavement Heat Flux Effects 79
12.1 Results . . . 79
Reference days . . . 79
Watered days. . . 80
12.2 Discussion . . . 82
12.3 Conclusion . . . 83
13 Surface Temperature Effects 85 13.1 Results . . . 85
13.2 Discussion . . . 88
13.3 Conclusion . . . 88
14 Pavement Temperature Effects 89 14.1 Results . . . 89
14.2 Discussion . . . 91
14.3 Conclusion . . . 92
15 Conclusion of Part 2 93 3 Improving the Water Use of Pavement-Watering 95 16 Introduction to Part 3 97 17 Methodology 101 17.1 Heat Transfer Analysis . . . 101
17.2 Optimization Goals . . . 104
18 Cooling Flux Φ: Determining the Evaporation Rate 107 18.1 Results . . . 107
18.2 Confrontation with Mass Convection Transport Problem . . . 111
18.3 Discussion . . . 112
18.4 Conclusion . . . 113
19 Watering Frequency Optimization 115 19.1 Results . . . 115
Pavement Heat Flux . . . 115
Surface Temperatures. . . 116
5 cm Pavement Temperatures . . . 118
19.2 Discussion . . . 118
Pavement Heat Flux . . . 119
Surface Temperatures. . . 120
5 cm Pavement Temperatures . . . 121
viii CONTENTS
20 Watering Rate Optimization 123
20.1 Pavement Cooling Flux Φ . . . 123 20.2 Pavement Surface Temperatures . . . 125 20.3 Conclusion . . . 125 21 Conclusion of Part 3 127 22 Conclusion 131 22.1 Results . . . 131 22.2 Future Research . . . 133 Bibliography 137
A Congrès Français de Thermique 2015 : Thermique de l’Habitat
et de la Ville 145
B XIIème Colloque Interuniversitaire Franco-Québécois sur la
Ther-mique des Systèmes 155
C 9th International Conference on Urban Climate jointly with 12th
Symposium on the Urban Environment 163
List of Figures
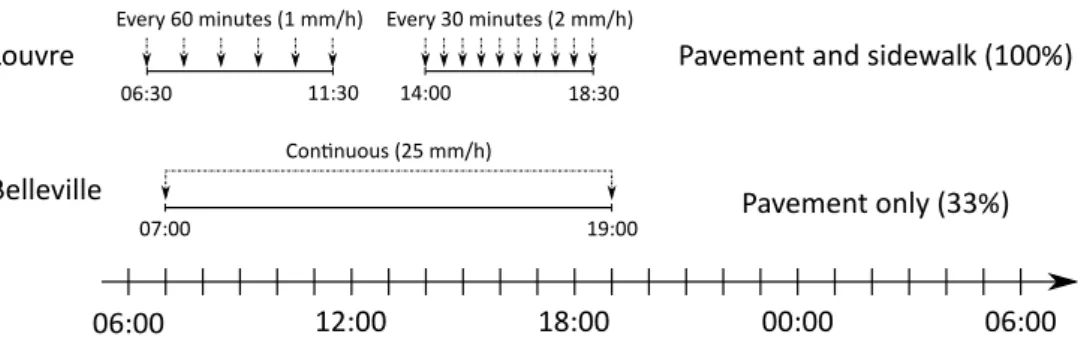
2.1 Heat budget of a pavement surface (Hendel et al., 2015).. . . 7 3.1 Diagram of the watering methods used in the surveyed articles.. . . . 16 6.1 Position of Experimental Sites in Paris . . . 36 6.2 Station Positions at the Louvre (left) and Belleville (right) Sites . . . 37 6.3 Solar irradiance at Louvre (left) and Belleville (right) on July 14th 2013 38
6.4 Diagram describing the applied watering method at both sites. . . 39 6.5 Watering on rue du Louvre (left, from Hendel et al. (2014)) and rue
Lesage (right) . . . 39 6.6 Weather station design and instrumentation (rue du Louvre). . . 40 6.7 Photographs of watered and control weather stations in situ. From
left to right: watered and control Louvre stations, watered and control Belleville stations (Hendel et al., 2015). . . 41 6.8 Diagram of pavement heat budget at surface (Hendel et al., 2015). . 42 7.1 Differences between Louvre case and control stations from July 2nd to
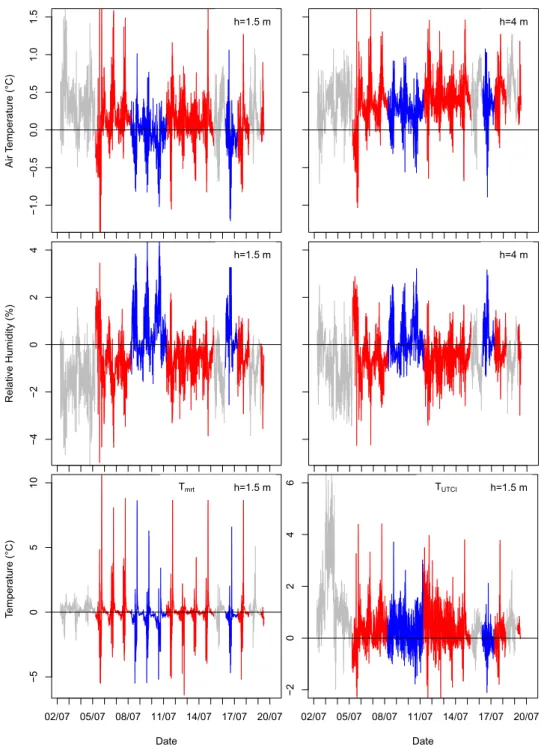
19th, 2013 (top to bottom) for T
a and relative humidity (RH) at 1.5
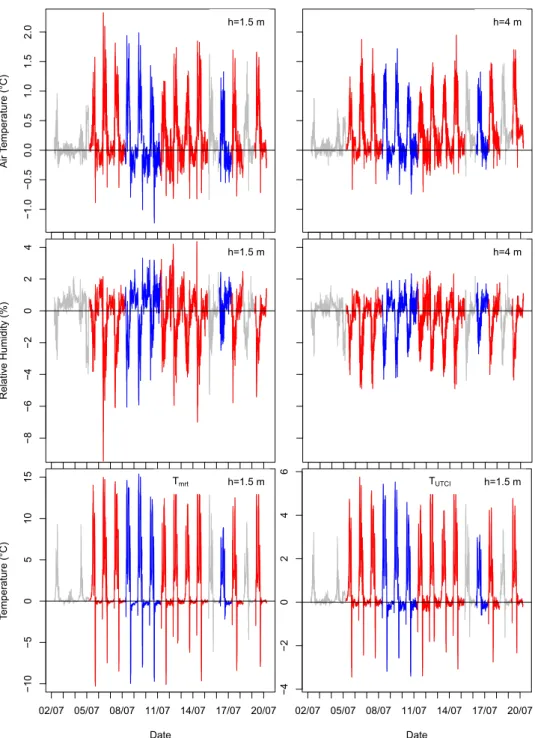
m (left) and 4 m (right) height and mean radiant temperature (MRT) (bottom left) and Universal Thermal Climate Index (UTCI) (bottom right). Watered days are in blue, reference days are in red. Days with uncomparable weather conditions are in grey (Hendel et al., 2015).. . 46 7.2 Differences between Belleville case and control stations from July 2nd
to 19th, 2013 (top to bottom) for Ta and RH at 1.5 m (left) and 4
m (right) height and MRT (bottom left) and UTCI (bottom right). Watered days are in blue, reference days are in red. Days with un-comparable weather conditions are in grey. . . 47 8.1 Average watering effect at Louvre over the summers of 2013 and 2014
(top to bottom) for Ta and RH at 1.5 m (left) and 4 m (right) above
ground level (a.g.l.) and MRT (bottom left) and UTCI (bottom right). Average effects are solid blue, confidence intervals are dashed red (Hendel et al., 2015). . . 53
x LIST OF FIGURES
8.2 Average watering effect at Belleville over the summers of 2013 and 2014 (top to bottom) for Ta and RH at 1.5 m (left) and 4 m (right)
a.g.l. and MRT (bottom left) and UTCI (bottom right). Average effects are solid blue, confidence intervals are dashed red (Hendel et al., 2015). . . 54 8.3 Average watering effect at Louvre detected using the Belleville control
stations over the summers of 2013 and 2014 (top to bottom) for Ta and RH at 1.5 m (left) and 4 m (right) height and MRT (bottom left) and UTCI (bottom right). Average effects are solid blue, confidence intervals are dashed red (Hendel et al., 2015). . . 59 11.1 Top view of pavement sensor (Hendel et al., 2015a). . . 72 11.2 Cross-section detail of pavement sensor filling materials (Hendel et al.,
2015a). . . 73 11.3 Surface temperature measurement zones (left) and corresponding
night-time corrected infrared photograph on July 22nd at 3:20 am (right). Temperature scale is in degrees Celsius. Sp2: pavement zone 1; Sp1: pavement zone 2; Sp3: sidewalk zone (Hendel et al., 2014). . . 74 11.4 Diagram of pavement heat budget at surface (Hendel et al., 2015a). . 76 11.5 Solar irradiance measured on July 8th and 22nd (Hendel et al., 2014). 76 11.6 G (left) and S′ (right) measured on July 11th (Hendel et al., 2014) . 78 12.1 Pavement heat flux G (left) and shortwave (0.3-3 µm) (SW) radiation
S (right) on control days (Hendel et al., 2014). . . . 80 12.2 Pavement heat flux G and SW radiation S on watered days: a) and
d) July 8th; b) and e) July 22nd; c) and f) July 10th (Hendel et al.,
2015a). . . 81 13.1 Pavement directional radiometric temperature on reference days: a) July 20th
and b) July 21st; and on watered days: c) July 8th and d) July 22nd (Hendel et al., 2014). . . 86 14.1 Pavement temperature on reference days: a) July 7th, b) July 20th
and c) July 11th; and on watered days : d) July 8th, e) July 22nd and
f) July 10th (Hendel and Royon, 2015). . . 90 17.1 Diagram of pavement heat budget at surface (Hendel et al., 2015a). . 101 18.1 G as a function of S on control and watered days. a) July 11th, b)
July 14th, c) July 20th, d) July 8th, e) July 22nd, f) July 10th, 2013
(Hendel et al., 2015a). . . 108 19.1 Watering cycles and pavement heat flux on a) July 8th, b) July 10th
LIST OF FIGURES xi
19.2 Surface temperature and watering cycles on watered days: a) July 8th and b) July 22nd. . . . 117
20.1 Pavement cooling Φ (left) and watering rate to pavement cooling ratio VS
Φt0
(right) according to the applied watering rate (Hendel et al., 2015a).124 1 Diagram of the watering methods used in the surveyed articles.. . . . 176 2 Plan des stations des sites de Louvre (gauche) et de Belleville (droite).177 3 Schéma et instrumentation des stations météorologiques (rue du
Lou-vre). . . 178 4 Méthode d’arrosage pour Louvre et Belleville. . . 178
List of Tables
3.1 Reported air temperature effects. . . 19
3.2 Reported air humidity effects. . . 20
3.3 Reported effects on the radiative environment.. . . 21
3.4 UHI-mitigation effects. . . 22
3.5 Reported thermal comfort effects. . . 23
3.6 Reported pavement surface temperature effects. . . 24
3.7 Reported pavement temperature effects. . . 25
3.8 Reported latent heat flows. . . 25
3.9 Reported pavement heat flux effects. . . 26
3.10 Literature review summary. . . 28
6.1 Weather conditions required for pavement-watering and heat-wave warnings (Hendel et al., 2015a) . . . 38
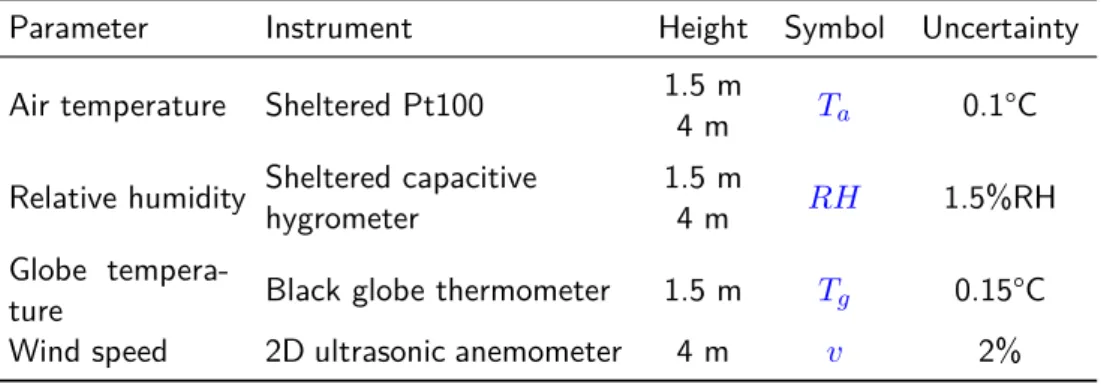
6.2 Type, height and uncertainty of meteorological instruments. Adapted from Hendel et al. (2015). . . 41
7.1 Average case-control difference on reference days over the summers of 2013 and 2014 (Hendel et al., 2015). . . 48
7.2 Daily interstation difference on watered days and variation from refer-ence days over the summers of 2013 and 2014. Adapted from Hendel et al. (2015). . . 49
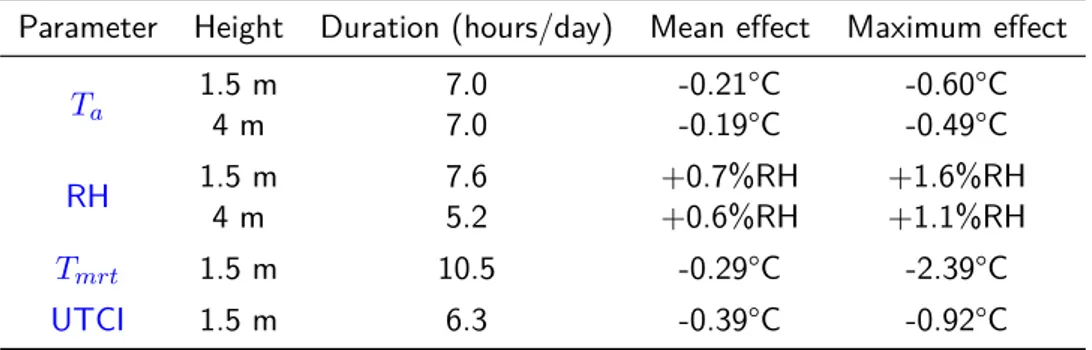
8.1 Duration, mean and maximum values of statistically significant (stat. sign.) effects for Louvre over the summers of 2013 and 2014 (Hendel et al., 2015).. . . 55
8.2 Duration, mean and maximum values of stat. sign. effects for Belleville over the summers of 2013 and 2014 (Hendel et al., 2015). . . 55
8.3 p-value and average stat. sign. (CI: 0.95) effect at Louvre and Belleville over the summers of 2013 and 2014 (Hendel et al., 2015). . 57
8.4 p-value and average stat. sign. (CI: 0.95) effect at Louvre using the Belleville control station over the summers of 2013 and 2014 (Hendel et al., 2015).. . . 60
8.5 Duration, mean and maximum values of stat. sign. effects for Louvre, using the Belleville control station (Hendel et al., 2015). . . 60
LIST OF TABLES xiii
11.1 Type, height and uncertainty of thermal instruments. Adapted from Hendel et al. (2014, 2015a,b). . . 71 11.2 Parameters used to correct apparent surface temperature (Hendel
et al., 2014) . . . 73 11.3 Pavement structure in each zone (Hendel et al., 2014). . . 75 12.1 Actual watering method on considered watered days (Hendel et al.,
2015a). . . 80 12.2 Average heat flux density reduction in W/m² on watered days (Hendel
et al., 2015a). . . 82 13.1 Average temperature reductions observed on July 22nd(watered)
com-pared to average control day temperatures (July 20th and 21st) (Hen-del et al., 2014).. . . 87 14.1 Daily low, high, and temperature amplitude on July 7th, 8th, 10th,
11th, 20th and 22nd, 2013 (Hendel and Royon, 2015). . . 91 18.1 β and R² on reference days (Hendel et al., 2015a). . . . 109 18.2 β, R² and G0 (W/m²) on watered days. The value of G0 was input
by the user (Hendel et al., 2015a). . . 109 18.3 Average value of meteorological parameters on July 22nd, and 10th,
2013 between 3 pm and 6:30 pm and corresponding solutions to equa-tion 17.18 (Hendel et al., 2015a). . . 111 18.4 Solutions to equation 17.18 obtained with h = 3.5 W/m2.K (Hendel
et al., 2015a). . . 112 1 Résumé de l’état de l’art. . . 175 2 Conditions météorologiques nécessaires pour le déclenchement de l’arrosage
Acronyms and Abbreviations
a.g.l. above ground level. exp. experimental.
HIP heat island potential. IR infrared.
LW longwave (3-100 µm). MRT mean radiant temperature. NA not available.
NiR near infrared (1-3 µm). NR not relevant.
num. numeric.
PCM phase change material.
PET Physiological Equivalent Temperature. PM particulate matter.
PT Perceived Temperature. RH relative humidity.
stat. sign. statistically significant. SW shortwave (0.3-3 µm).
TEB Town Energy Balance. UHI urban heat island.
UHII urban heat island intensity. UTCI Universal Thermal Climate Index. WBGT Wet-Bulb Globe Temperature.
List of Symbols
α Albedo and/or shortwave reflectivity, [−].
β Conversion coefficient of solar irradiance to 5 cm pavement heat flux density,
[−].
BM IM ax Three-day averaged maximum daily air temperature, [oC].
BM IM in Three-day averaged minimum daily air temperature, [oC].
cp Specific heat of water, 1, 000 [J.g−1.K−1]. ∆Q Sensible heat absorption flux, [W.m−2].
E Evaporation rate, [g.s−1].
ϵ Material emissivity, [−].
G Pavement heat flux 5 cm deep, [W.m−2].
H Upwards convective heat flux, [W.m−2].
h Convective heat transfer coefficient, [W.m−2.K−1].
H/W Canyon aspect ratio, [−]. L Longwave radiation, [W.m−2].
l Water latent heat of vaporization, 2, 260 [J.kg−1].
p0 Total air pressure, [P a].
Φ Pavement-watering cooling flux, [W.m−2].
Φadv Pavement-watering advective cooling flux, [W.m−2]. Φlat Pavement-watering latent cooling flux, [W.m−2].
ps Saturation vapor pressure at water film temperature, [P a].
pv Partial vapor pressure at water film temperature, [P a].
ρ Volumetric mass, [kg.m−3].
Rn Net radiation, [W.m−2].
S Shortwave radiation, [W.m−2].
S′ Shortwave radiation, measured by station pyranometer 4 ma.g.l., [W.m−2].
xviii LIST OF SYMBOLS
T Temperature, [oC].
Ta Air temperature, [oC].
t0 Time between two watering cycles, [s].
Tg Globe temperature, [oC].
Tmrt Mean radiant temperature, [oC].
Tn Minimum daily air temperature, [oC].
Tx Maximum daily air temperature, [oC].
V Downwards conductive heat flux, [W.m−2].
v Wind speed, [m.s−1].
CHAPTER
1
Introduction
The maharajas of the Thar Desert in Rajasthan ruled over one of the driest and hottest areas in the Indian sub-continent. In the sweltering hot summer, no means were spared to improve thermal comfort, including sprinkling rose-perfumed water on the palace walls. Many other areas across the globe have developed similar practices such as ”Uchimizu” in Japan. Indeed, watering ground surfaces during the hot and humid Japanese summers has been a local tradition for centuries and continues up to this day (Japan Water Forum,2015).
Paris’ strong hygienist movement during the 19th Century led to the develop-ment of its dual water supply. Originally designed to supply Paris with potable water, the Ourcq Canal quickly became the main source for the city’s non-potable water network, the Seine currently providing approximately 20% of its water. Street cleaning has since relied on the use of non-potable water. Until the mid-20th Century, streets could be watered up to five times on hot summer days to prevent dust clouds from forming, as described byGirard(1923). According to the author’s reports, many inhabitants at the time also believed the watering provided cooling to the city. As mechanized cleaning was generalized and dust clouds were no longer a problem, these practices were lost and nearly forgotten over time.
Today, pavement-watering is seen as a potential tool to improve thermal com-fort in cities during periods of intense heat. Scientific work in Japan began in the 1990’s with the use of preexisting pavement-watering installations in Nagaoka City (Kinouchi and Kanda, 1997, 1998; Takahashi et al., 2010) or block-scale demonstrators in Tokyo (Yamagata et al., 2008) as well as simulations applied to Kawasaki City (Nakayama and Fujita, 2010; Nakayama et al., 2012). More recently, the city services of Paris or Lyon have conducted their own field stud-ies with the use of cleaning trucks or watering infrastructure prototypes (Bouvier et al., 2013; Maillard et al., 2014) (see Chapter 3 for details). In France and especially in Paris, the predicted increases in heat-wave intensity and frequency due to climate change (Lemonsu et al.,2013), combined with the high
sensitiv-2 Introduction
ity of dense cities to such episodes (Robine et al.,2008;Li and Bou-Zeid,2013), have focused efforts on the development of appropriate adaptation tools, including urban greening, reflective materials and pavement-watering.
Paris’ interest in pavement-watering was marked with the unanimous passing of its Blue Paper in 2012 by the City Council (Paris City Council,2012a). The Pa-per defined the city’s strategy for the development and improvement of its water and sanitation utilities. After more than two decades of semi-abandonment, the Blue Paper officially recognized the potential of the non-potable water network for sustainable urban water use. To initiate its redevelopment, three tasks were as-signed to the relevant city services. The first consisted of replacing municipal uses of potable water with non-potable water where feasible, e.g. for park irrigation. A study of solutions to diversify the network’s water supply with other sustainable sources was also requested to reduce the network’s environmental footprint fur-ther. Finally, the services were tasked with studying the potential of the network to be used as the backbone of a pavement-watering infrastructure to cool the city in the event of heat-waves and to tackle its worseningUHI.
The Water and Sanitation Department of Paris therefore set out to determine what the feasability of a city-wide pavement-watering strategy might be in a city such as Paris, by first identifying the method’s costs and benefits.
This dissertation aims to provide answers to this question, however the words ”cost” and ”benefit” are not very specific and can refer to a large number of different aspects.
To help downsize the number of possibilities, we turn to the language associ-ated with pavement-watering in the city’s Blue Paper. The Paper lists several aims for pavement-watering such as to: ”reduce air temperatures during intense heat events”, ”fight urban heat islands”, ”[improve] urban thermoregulation” and ”pro-vide cooling [...] during heat events” (Paris City Council, 2012a). The benefits therefore clearly refer to the method’s measurable cooling effects, with a spe-cial focus on air temperature and UHI-mitigation, particularly during heat-wave events. The special importance given to heat-wave events echoes the impact that the 2003 heat-wave has had on public awareness in France. This facet should therefore not be overlooked.
The Blue Paper identifies only one cost associated with pavement-watering: its water footprint. Indeed, ”to limit the impact on the Seine and Ourcq Canal which supply the non-potable water network, alternative water sources could be used [...]” While efforts are being made to diversify the non-potable networks supply, the water consumption of pavement-watering is of special importance.
This brings a close to the costs and benefits identified by the Blue Paper, how-ever many other ones are overlooked by this list. Other positive effects include improved air quality or street cleanliness as a side-effect of pavement-watering (Amato et al.,2010), reduced sewer obstruction as a consequence of pavement-watering runoff or, as mentioned by Girard (1923), the positive social effects of perceived cooling by pedestrians. Other potential costs are economic or environ-mental in nature, including the financial cost of a pavement-watering
infrastruc-Introduction 3
ture or environmental impacts other than the water footprint, such as greenhouse gas emissions or energy use. While these aspects are all important, we choose to limit ourselves to those identified in the Blue Paper.
Our research problem can therefore be summarized with the following question: what cooling effects, including air temperature and UHI-mitigation effects, can be expected of pavement-watering during heat-wave events and in exchange for what water footprint in dense urban areas?
Before attempting to answer the question on our own, we first conduct a literature review on the topic of pavement-watering. Beforehand, a brief scientific background of urban climate, the UHI effect and its countermeasures will be provided.
CHAPTER
2
Scientific Background
Having provided some historical and political perspective on the motivations be-hind our research topic, we now present the scientific background and context that pavement-watering falls into as a potential UHI and heat-wave mitigation tool. We begin by describing the urban climate and the UHI effect.
2.1 Urban Climate and the
UHI
Effect
Urban areas, through a combination of radiative trapping, increased heat storage, wind obstruction, low vegetation presence, low surface permeability, as well as high concentrations of human activity, create a localized warming effect known as the UHI effect (Oke,1982;Grimmond,2007). TheUHI effect takes the form of increased urban air and surface temperatures with regards to surrounding rural areas, in the order of 1°-3°C on average (Akbari et al., 2001). The resulting air temperature difference, measured as that of the urban area minus that of the rural area, is known as the urban heat island intensity (UHII).
For millennia, urban climatology has been taken into account in urban design, but published scientific work remained scarce until the 1950’s (Yoshino, 1990). The mid-20th Century marks a turning point with a significant increase in the number of publications over the following decades and studies gradually more dedicated to the UHI effect and its possible countermeasures.
Since then, knowledge and understanding of the UHI phenomenon has grad-ually shifted from empirical descriptions and predictions (Oke, 1973), towards a finer understanding of the physical processes involved (Oke,1982). In short, sky and wind obstruction by urban morphology reduce radiative and convective ex-changes and the absence of vegetation reduces latent exex-changes at the city-scale, while strong heat gains occur within cities due to anthropogenic heat release.
During this period, the positive relation between city size and UHII was ob-served by Oke(1973). In addition, several studies identified links between
radia-6 Scientific Background
tive trapping and street geometry, synthesized by the canyon aspect ratioH/W (building height-to-street width), with the help of scale models and computer simulations (Oke, 1973, 1981; Arnfield, 1990; Spronken-Smith and Oke, 1999). Indeed, a decreasing linear relationship was found by Oke (1981) between max-imum UHII and sky view factor, in other words open urban designs experience lower UHII. Oke (1988) confirmed this by identifying an empirical relationship linking high aspect ratios (H/W) with higher maximumUHII from observations in European, North American and Australasian cities. More recently, investiga-tions have helped better quantify the importance of anthropogenic heat releases (Pigeon et al.,2007), or the creation of climate-vulnerability maps of cities
By the end of the 20th and beginning of the 21st Centuries, several urban canopy models had been developed such as the Noah land surface model developed by Kusaka et al. (2001), the Town Energy Balance (TEB) model by Masson (2000), or the University of Athens (NKUA) model byDandou et al.(2005). Over the years, some of these were refined to be able to include low-level vegetation (Lemonsu et al., 2012), green roofs (De Munck et al., 2013) and trees (Redon et al.,2014).
In 2011, the results of an international urban energy balance model comparison study (PILPS-urban) benchmarking 32 of these models against one another were published (Grimmond et al.,2011). Some of these models have since been used for sensitivity analyses of urban climate to the different urban parameters (Colombert et al., 2011), thus helping urban planners and designers target their anti-UHI measures more efficiently, depending on the urban configuration. In the past few years, urban canopy models have even been combined with other social or economic models capable for example of simulating future urban development (Masson et al.,2014).
In parallel to this work on the fundamentals of theUHIeffect and its modelling and simulation, studies have also been carried out on ways of reducingUHII.UHII varies with time and local weather conditions. Typically, high wind speeds and cloud cover tend to lower it, while clear skies and low winds amplify it (Cantat, 2004). On nights with clear skies and calm winds, UHII can reach as much as 12°C (Oke, 1973). These conditions are typically reached during heat-waves. For example, during the 2003 heat-wave in Paris, UHII reached 8°C (Paris City Council,2007).
While UHI may reduce building energy consumption during winter, the op-posite is true in the summer during which cooling demand is increased (Hassid et al., 2000). For Athens, Greece for example, building cooling energy has been found to double when UHII reaches 10°C, while peak cooling electricity demand is tripled (Santamouris et al.,2001).
In addition to negative effects on energy use, UHIs also tend to exacerbate ozone and smog pollution (Rosenfeld et al.,1998) as well as the intensity of heat-waves (Li and Bou-Zeid, 2013). As a result, their health impacts are increased, making heat-waves of particular concern for dense urban areas with intenseUHIs. This helps explain that the Île-de-France region was one of the worst hit in Europe
2.2. UHI Countermeasures 7
during the 2003 heat-wave which caused a two-fold increase in mortality over the first two weeks of August 2003 (Robine et al.,2008). This event created strong heat-wave awareness in France. As a result, predicted increases in heat-wave frequency and intensity (Lemonsu et al.,2013) are at the heart of climate change adaptation efforts for Paris under its 2007 Climate Plan (Paris City Council,2007). In 2012, the Plan was updated and now includes measures addressing the UHI effect (Paris City Council,2012b).
We now present some of the UHIcountermeasures that have been studied to this day.
2.2
UHI
Countermeasures
UHIcountermeasures aim to reduce or compensate for the phenomena responsible for urban warming. Among these radiative trapping and low vegetation presence are often addressed.
The role of radiative trapping on UHII is based on the higher absorption of solar energy by urban surfaces. Indeed, the generally low SW reflectivity (a.k.a. albedo) of roofs, walls and pavements combined with the multiple intra-canyon reflections and emissions which occur result in increased solar absorption by urban canyons. As solar energy is absorbed in the form of sensible heat, material tem-peratures increase, consequently increasing convection, thus raising the ambient air temperature. Figure2.1illustrates the heat budget of a pavement surface but can be generalized to building walls and roofs.
Figure 2.1 – Heat budget of a pavement surface (Hendel et al.,2015).
S and Ldown respectfully designate incident SW and longwave (3-100 µm) (LW)radiation, whileSref andLuprepresent upwardsSW(reflected only) andLW (reflected and emitted) radiation. HandlE respectfully represent the convective and latent heat fluxes towards the atmosphere, while V is the conductive heat flux into the pavement.
Therefore, two approaches can be proposed to reduce radiative trapping. The first consists of favoring open urban designs with lowH/W. By increasing the sky view factor of canyon surfaces, intra-canyon reflection and emission is reduced, resulting in more energy being radiated out of the street canyon (Oke, 1988). However, this approach is only applicable to new developments and is incompatible
8 Scientific Background
with dense urban designs which help limit transportation energy and urban sprawl (Newman and Kenworthy,1989).
The second approach consists of so-called ”cool materials”, which can be used in new buildings and developments or to retrofit existing ones.
Reflective Materials
Cool materials have modified properties compared to standard ones in order to lower their surface temperature. As the convective flux at an urban surface de-pends on the surface-air temperature difference, reduced surface temperatures result in lower atmospheric warming.
Depending on the technology used, more or less feedback is available on the application of these materials. Several recent literature reviews on their use are available in the literature (Santamouris et al.,2011;Santamouris,2013).
Originally, cool materials mostly consisted of white-coatings or materials. Their goal is to reflect SW solar radiation out of the urban canyon and back into space. As SW reflectivity is referred to as albedo, such materials are also called high-albedo. The potential for high-albedo roofing materials to reduce UHII has been studied for decades (Akbari and Taha,1992; Taha,1997; Akbari et al., 2001). More recently, cool-colored materials have been developed which are highly reflective in the near infrared (1-3 µm) (NiR) band. This allows for a wide variety of colors while still providing cooling performance (Santamouris et al., 2011). In addition to reducing urban temperatures,SWreflective materials create a negative radiative forcing that effectively counters the effects of increasing green house gas concentrations (Akbari and Matthews,2012).
In the case where materials have low emissivity (e.g. Paris’ zinc roofs) high emissivity coatings can be used to increaseLWradiant cooling (Météo France and CSTB,2012).
Some of the limits to the use of these materials include material aging and as-sociated performance degradation (Bretz and Akbari, 1997). This is particularly true for pavement materials which are exposed to very intense urban pollution and to high levels of abrasive wear associated with road traffic (Rosado et al., 2014). Thus, recent work has focused on developing accelerated aging methods to determine the evolution of cool material performance over time (Takebayashi et al.,2014;Sleiman et al.,2014). Another limit to the use of these cool mate-rials is their impact on winter conditions. Indeed, although it is only to a lesser extent, cooling observed in the summer also occurs in the winter, thus potentially increasing building heating demand. Recent work seems to indicate that the ben-efits in summer are not offset by winter penalties for cold climates (Akbari,2014). Finally, in certain situations the increase in reflected radiation caused by high-albedo materials can have negative net impacts on pedestrian thermal comfort, thus defeating their purpose (Erell et al.,2013).
More recently, thermochromic coatings, which change color with increasing temperatures, are being developed and studied in the lab. These can be designed
2.2. UHI Countermeasures 9
to increase their albedo above a certain temperature and remain dark below it. These coating offer a chance to enjoy the cooling properties of high albedo in the summer without affecting energy demand in the winter (Santamouris et al., 2011).
To date, cool materials have mainly been studied in the lab, while large scale effects have been studied numerically, with little or no large-scale field testing of micro-climatic effects.
Urban Greening
Unlike cool materials, urban greening seeks to reintroduce evapotranspiration into the urban scene. Evapotranspiration consists of the combination of evaporation from the soil and plant transpiration through the process of photosynthesis. If vegetation is tall enough, pedestrians and buildings may also enjoy the added benefits of shading. Modern urban greening solutions exist and can be applied to roof, wall or street surfaces and rely on the use of trees, parks, lawns as well as green walls and roofs (Akbari et al.,2001; Ng et al., 2012; Wong et al., 2009). Indeed, while the benefits of lawns, parks and trees have been studied and promoted for several decades (Jauregui,1990;Taha,1997), the more recent green facades and roofs make it possible to green both horizontal and vertical building surfaces (Jaffal et al.,2012;Djedjig et al.,2013;Musy et al.,2014).
In addition to atmospheric cooling and shading, urban vegetation has other benefits such as promoting urban biodiversity. Furthermore, green facades and roofs can provide added thermal and in some cases acoustic insulation to their host buildings (Musy et al.,2014;Morille et al.,2014).
One of the main limits to urban greening is that evapotranspiration requires irrigation to create cooling (Météo France and CSTB,2012;Musy et al.,2014). In addition, green facades and roofs may be costly and difficult to implement in retrofit projects for structural reasons.
Other Materials
Even in the absence of vegetation, bare soil still provides a relatively constant amount of evaporative cooling over the course of the day as long as it contains sufficient moisture to do so (Camuffo and Bernardi, 1982). For surfaces which cannot be vegetated for practical reasons such as high traffic, permeable paving materials have been developed (Kubo et al., 2006; Haselbach et al., 2011; Li et al.,2013). These mainly consist of concrete or asphalt concrete with high void content which allows water to drain into the sublayers of the pavement (Li et al., 2013).
While these materials may offset rainwater runoff flows into sewer systems, they are not very efficient at providing evaporative cooling. Indeed, only water stored close enough to the surface is warm enough to evaporate rapidly. Water-retaining materials make up for this by relying on capillary action to keep moisture
10 Scientific Background
present at or near the pavement surface where evaporation can occur. This is clearly demonstrated by Kubo et al. (2006) who compare water-retaining pave-ments with porous ones.
Another way to decrease the surface temperature of urban materials is to combine the latent heat storage properties of a phase change material (PCM) with the radiative properties of cool colored materials. By incorporating PCM into existing cool colored materials, their thermal inertia is effectively increased (Santamouris et al.,2011).
2.3 Expected Cooling Effects
To date, cool and green materials have been thoroughly studied in the lab or on small-scale prototypes (Kubo et al.,2006;Levinson et al.,2007;Takebayashi and Moriyama,2007,2009;Karlessi et al.,2011;Li et al.,2013). Results indicate that surface temperatures are significantly reduced compared to standard materials. This is expected to result in lower atmospheric heating as sensible heat flows are reduced with urban surface temperatures. Equivalent work on green spaces has mostly focused on existing parks (Jauregui, 1990; Ca et al., 1998), though smaller scale testing has also been conducted (Spronken-Smith and Oke,1999). Parks have been found to be up to a few degrees cooler than their surroundings through the combined effects of evapotranspiration and shading. However, field evaluations and monitoring of large-scale applications of cool materials or new urban green spaces are scarce (Santamouris, 2013; Bowler et al.,2010). Indeed, large-scale micro-climatic effects have been almost exclusively studied with the help of computer simulations (Akbari et al.,2001;Nakayama et al.,2012;Météo France and CSTB,2012;Wei and He,2013;Musy et al.,2014).
Pavement-watering stands out as an exception and has been studied in the field via several independent studies (Kinouchi and Kanda,1997,1998;Yamagata et al., 2008; Takahashi et al., 2010; Bouvier et al., 2013; Maillard et al.,2014). This technique, consisting of spraying water onto an impervious or a permeable pavement surface, is viewed as an efficient means of reducingUHI intensity.
In contrast with high albedo pavements, this is accomplished without compro-mising pedestrian comfort as the radiant heat fluxes are not increased by watering. Indeed, surface wetting tends to decrease pavement albedo, thus lowering reflected SWradiation (Lekner and Dorf,1988). On the other hand, the expected increase in air humidity caused by watering could negatively affect pedestrian comfort.
The effects of different adaptation strategies for Paris were studied in the framework of the EPICEA Project (Etude Pluridiscplinaire des Impacts du Change-ment climatique à l’Echelle de l’Agglomération parisienne) conducted from 2008 to 2012 (Météo France and CSTB, 2012). This study was conducted using the TEBmodel developed byMasson (2000) and provides useful information on the micro-climatic effects that can be expected for Paris for each of these strategies. The study had three main goals, the last of which consisted of determining the
2.4. Conclusion 11
impact of four different adaptation scenarios on 2 m a.g.l. air temperatures dur-ing the August 2003 heat-wave. These four scenarios are city-wide and include: 1) reflective and emissive building materials, 2) urban greening with and without irrigation, 3) pavement-watering and 4) the combination of scenarios 1), 2) and 3).
Météo France and CSTB (2012) found that scenario 1) created 2 m a.g.l. temperature reductions in the order of 1°C both day and night, reaching up to 4°C during the day. Scenario 2) with irrigation showed up to 5°C of cooling during the day with average effects in the order of 1°C. Without irrigation, scenario 2) had a negligible impact in the city center. Scenario 3) demonstrated average cooling of approximately 0.5°C and maximum effects of 1°-2°C during the day. UHII mitigation was measured as the change in 2 m a.g.l. air temperature between 3 am and 6 am local daylight savings time (UTC+2). In this regard, scenario 1) created a spatially-uniform 1°C reduction in UHII. In areas with substantial urban greening, scenario 2) with irrigation was found responsible for a 0.5° to 1°C reduction in UHII. Finally, scenario 3) caused reductions of 0.25° to 0.5°C of UHII in the most central urban areas. Finally, the combination of these scenarios yielded the highest results with average cooling of 2.3°C and maximum cooling of 6°C 2 m a.g.l.. UHI mitigation effects reached 1.25°C.
Overall, these results agree well with the studies previously cited and thus provide an order of magnitude for the cooling effects that can be expected from reflective and green materials as well as pavement-watering.
2.4 Conclusion
In this chapter, we have described the fundamentals behind theUHI effect. Char-acterized by the temperature difference between urban and rural areas (UHII), UHIs form as a result of radiative trapping, reduced evapotranspiration, wind obstruction and high concentrations of anthropogenic heat sources. These phe-nomena are linked to urban morphology, urban materials, lack of natural soils and green spaces and energy inefficiency.
To reduce UHII, UHI countermeasures may address one or several of these aspects. Significant work has been carried out to date on the design of cool ur-ban materials which aim to maintain low surface temperatures. This is generally achieved by increasing material albedo. In turn, urban greening seeks to compen-sate for the lack of evapotranspiration by either increasing the share of green areas within cities with new parks or by adding greenery to building and street surfaces. Given their long lifespans of several years, these measures can be considered as permanent.
In principle, pavement-watering achieves the same goal as cool materials of lowering urban surface temperatures by creating additional latent and non-atmospheric sensible heat flows. These flows are obtained by the evaporation of the sprinkled water film and its sensible heat absorption. If sprinkling is sufficient
12 Scientific Background
to create runoff, the sensible heat flux is an advective transfer. In addition, surface wetting also reduces itsSWreflectivity (Lekner and Dorf,1988). As the pavement surface is cooled, its convective (H), emitted (Stefan-Boltzmann’s ϵσT4
surf) and reflected radiation flows decline, resulting in a cooler atmosphere and reduced radiosity.
In order to identify preexisting answers to our research problem, we will now proceed with a description of the state of the art of pavement-watering. In the process, the literature review will identify knowledge gaps and/or needs for further evidence. Information on the method’s cooling effects, particularly in terms of air temperature andUHImitigation during heat-waves, and the water footprint of the applied watering methods are the focus points of the review. A brief description of the selected studies and their analysis method will also be provided.
CHAPTER
3
Literature Review of
Pavement-watering
The following literature review will focus on identifying answers to our problem which may already exist in the literature. Certain aspects may have been insuffi-ciently studied and require further research. We consequently turn our attention to findings on the cooling effects of pavement-watering, in particular air tempera-ture and UHI-mitigation effects during heat-waves, and its water footprint in the hope of finding information relevant for dense cities such as Paris, France.
The articles selected for our review describe experiments or computer simula-tions of watering pavement surfaces at laboratory, street or greater scales. Find-ings on the benefits of permeable pavements, with or without water-retention, are included when wet and dry performance is compared. Studies of building sur-face watering are not included unless pavement-watering is part of the watering scheme. Analyses of building-only watering may however provide a useful basis for comparison of certain aspects of our analyses conducted later on.
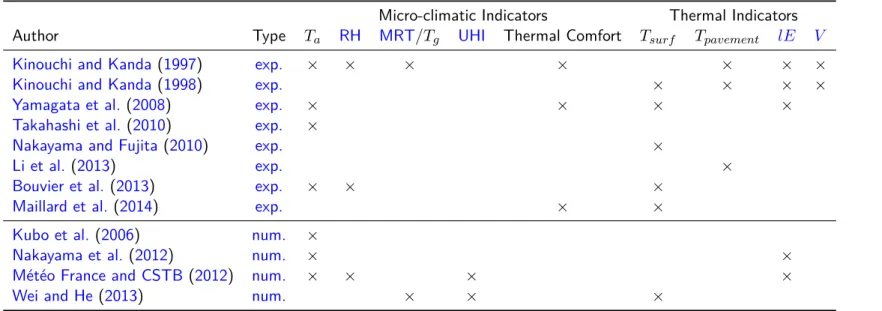
Several studies answering these criteria have been found and can be split into two major groups: numerical studies (Nakayama and Fujita, 2010; Nakayama et al.,2012;Météo France and CSTB,2012;Wei and He,2013) and field studies (Kinouchi and Kanda,1997,1998;Yamagata et al.,2008;Takahashi et al.,2010; Li et al.,2013;Bouvier et al.,2013;Maillard et al.,2014), withKubo et al.(2006) and Nakayama and Fujita(2010) combining both approaches.
These articles were published between 1997 and 2014, reporting results from experiments conducted from 1993 to 2012 (Kinouchi and Kanda, 1997, 1998; Kubo et al.,2006;Yamagata et al.,2008;Nakayama and Fujita,2010;Takahashi et al.,2010;Bouvier et al.,2013;Maillard et al.,2014), as well as from simulations conducted at the laboratory-, street-, district- or city-scale (Kubo et al., 2006; Nakayama and Fujita, 2010; Nakayama et al., 2012; Météo France and CSTB, 2012;Wei and He,2013).
14 Literature Review of Pavement-watering
It should be noted that the articles byBouvier et al.(2013) andMaillard et al. (2014) are published in the French professional journal Techniques, Sciences et
Méthodes (TSM). Although its peer-review process is not as rigourous as most
scientific journals cited in this manuscript, these articles provide recent examples of pavement-watering field trials conducted in two French cities. In addition, certain articles are conference papers (Kinouchi and Kanda,1998).
In order to make the diversity and differences between the considered studies clearly apparent, we will compare each study by thematic. We will first describe the selected articles and their methodologies. We will then focus on reported cooling effects and the indicators used to quantify them, including micro-climatic, thermal and outdoor comfort parameters.
Tables will be used to facilitate the comparisons, though some information may benot available (NA)or not relevant (NR).
3.1 Brief Description and Methodology
We first provide a brief description of the selected studies as well as of the watering and analysis methods used.
Brief Description
A brief description of each study will now be presented and grouped according to the scale at which cooling effects are investigated.
It should be noted that the articles by Kinouchi and Kanda(1998) and Kubo et al. (2006) can be divided into two parts. First, Kinouchi and Kanda (1998) begin by presenting results published in a previous paper also included in this review (Kinouchi and Kanda, 1997). The second part of the article presents findings on watering a permeable pavement slab which will be discussed in this review. In their article, Kubo et al. (2006) first focus on laboratory findings on different kinds of pavement, while their second approach is a numerical simulation. Firstly, three studies investigate small scale cooling effects in the lab. This is the case of Kinouchi and Kanda (1998), Kubo et al. (2006), Nakayama and Fujita (2010) and of Li et al. (2013). These studies focus on the effects of watering permeable pavements, thoughKubo et al.(2006) also compares pervious pavements with water retaining ones. Both are set in wide open areas with little or no masks. Kubo et al. (2006) use their findings in the lab to conduct a simplified simulation at the street scale in the second part of their article. Nakayama and Fujita(2010) develop and validate a numerical model of the water-retaining pavement material against their observations.
Next, several authors study the effects of street scale cooling. This is namely the case of the simulation conducted by Kubo et al. (2006) as well as the field work conducted by Kinouchi and Kanda (1997, 1998), Yamagata et al. (2008), Takahashi et al.(2010),Bouvier et al.(2013), andMaillard et al.(2014). Kinouchi and Kanda(1997,1998) and Takahashi et al. (2010) are set in Nagaoka City in
3.1. Brief Description and Methodology 15
Niigata Prefecture on the West coast of Japan, while the second part of Kubo et al. (2006) and Yamagata et al. (2008) describe watering in Tokyo. Bouvier et al.(2013) and Maillard et al.(2014) respectively take place in Paris and Lyon, France. Both present pavement-watering as a countermeasure for heat-waves. All studies conduct watering on standard impervious pavement surfaces except for Kinouchi and Kanda (1998) and Yamagata et al. (2008) which respectively water permeable and water-retaining pavements. Where solar irradiance data is provided or can be derived, it is apparent that solar masks are low, except for Yamagata et al.(2008) and Maillard et al.(2014).
Finally, three studies analyze cooling effects at the district or city scale (Nakayama et al., 2012; Météo France and CSTB, 2012; Wei and He, 2013). Nakayama et al. (2012) use an urban canopy model of Kawasaki City to simulate the ef-fects of water-retaining pavements combined with urban greening. Météo France and CSTB(2012) study pavement-watering of all of Paris’ 2,550 ha of streets and sidewalks using theTEBmodel, whileWei and He(2013) conduct pavement- and building-watering of a Tokyo district, simulated with their own 3D-CAD model. No changes in material properties are considered in the former, while the latter considers building walls and slanted roofs with a reflective and hydrophilic TiO2 coating and water-retaining pavement blocks.
As can be seen, most studies found focus on street-scale effects.
Watering Method
Pavement-watering implies the choice of a watering method. The first step in-volves the choice of a target area. Once it has been defined, every watering method can be characterized by three parameters: the watering period, the watering rate and the watering frequency.
The first outlines the period(s) of each day during which pavement-watering is conducted in order to keep the pavement wet. The second is the average amount of water delivered per unit area and per unit time (expressed in mm/h, equivalent to L/m².h), averaged over the watering period. Finally, the last indicates the frequency of the watering cycles in the case of discontinuous watering. Of these parameters, the watering rate and period are the ones that define the method’s water consumption. Different watering methods are used in the numerical and experimental studies described here.
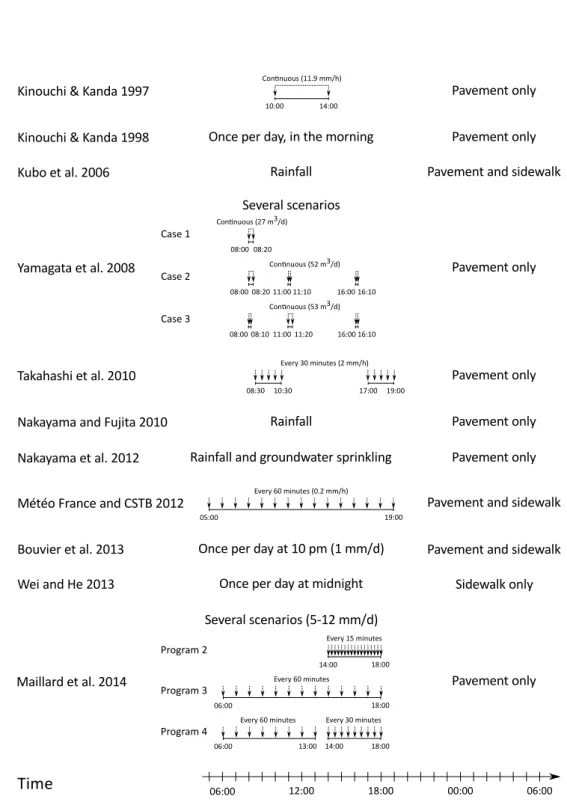
The different watering methods are summarized graphically in Figure3.1based on the information provided by the authors in their articles. We first describe watering conducted in experimental studies.
Kinouchi and Kanda(1997) andTakahashi et al.(2010) use the same snowmelt-ing infrastructure to water an impervious pavement surface. This snowmeltsnowmelt-ing infrastructure consists of watering pipes already present in the streets of Nagaoka City. They are used in winter to melt away accumulated snow and rely on un-derground water whose temperature is approximately 15°C all year. Kinouchi and
16 Literature Review of Pavement-watering
3.1. Brief Description and Methodology 17
Kanda (1997) run the system continuously at an average rate of 11.9 mm/h, whileTakahashi et al.(2010) run it intermittently at an average rate of 2 mm/h. For the second half of their study,Kinouchi and Kanda(1998) water a porous pavement once a day. Judging from their graphical indications, watering occurs approximately at 9 am. Watered volumes are not known.
For their experimental data, Kubo et al. (2006) and Nakayama and Fujita (2010) rely on rainfall to water their pavement slabs.
Yamagata et al. (2008) install temporary watering pipes in a central road planter to water a water-retaining pavement. The system is run continuously from 10-20 minutes at a time up to three times a day between 6:30 am and 4:10 pm. Total water consumption is provided, but the watered surface area is unknown.
Li et al.(2013) consider impervious and pervious pavement slabs measuring 4 x 4 m. Over an investigation period of 15 days, the pervious pavements are watered once with 0.2 mm after six days.
Bouvier et al. (2013) relies on a cleaning truck and manual operator to wa-ter impervious pavement and sidewalk surfaces once at approximately 10 pm. The watering cycle deposits 1 mm of water and is activated if certain weather conditions are met, similar to but less strict than heat-wave conditions for Paris. Maillard et al. (2014) describe a watering infrastructure integrated into the sidewalk edge. Nozzles connected to the city’s potable water network are used to sprinkle the pavement only. The system is operated intermittently following three watering scenarios at different frequencies which vary from every 15 minutes to every 60 minutes. The watering period also varies according to the scenario and occurs between 6 am and 6 pm. The watering rate ranges from 5 mm/d to 12 mm/d.
For their numerical simulation,Kubo et al.(2006) conduct no watering but use the results from their experimental data. More details on their analysis method will be given in the next Subsection.
Nakayama et al.(2012) rely on rainfall and groundwater sprinkling to saturate the water-retaining pavements. No information on the amount of water involved or the watering mechanism is given.
Météo France and CSTB (2012) use a hypothetical infrastructure relying on the Paris’ non potable water network to sprinkle 0.2 mm/h every hour from 5 am to 7 pm on pavement and sidewalk.
Wei and He (2013) conduct continuous watering of building walls and roofs between 9 am and 6 pm at a rate of 12 kg/m².h. Pavement-watering of the sidewalk is conducted once until saturation at midnight the day before, but applied water volumes are unknown.
As can be seen, varying levels of information are provided. Kinouchi and Kanda (1997), Takahashi et al. (2010) and Météo France and CSTB (2012) for example provide sufficient information to be able to determine all of the watering parameters, while Yamagata et al. (2008), Nakayama et al. (2012) andMaillard et al. (2014) only provide partial data. Finally,Kubo et al.(2006) andNakayama
18 Literature Review of Pavement-watering
and Fujita (2010) use rain events to determine the surface temperature effects of water-retaining permeable pavements in the lab. Only two studies water the sidewalk in addition to the pavement surface (Bouvier et al.,2013;Météo France and CSTB,2012), whileWei and He(2013) also waters building walls and slanted roofs. AlthoughYamagata et al.(2008) andMaillard et al.(2014) consider several watering methods, they do not compare the obtained results in these articles.
Of these papers, only Takahashi et al. (2010) and Météo France and CSTB (2012) describe attempts to optimize the watering method. Takahashi et al. (2010) optimize both watering rate and frequency based on surface and 90 cm air temperature observations over a period of one hour after watering. On this basis, it was found that each watering cycle should deliver 1 mm. Their analysis then led them to conclude that watering during the day, between 11 am and 3 pm, was ineffective as no temperature difference could be detected. Finally, the watering frequency was designed to water the pavement as soon as it became completely dry. This resulted in watering roughly every 30 minutes. Météo France and CSTB (2012) base their own optimization on findings fromTakahashi et al.(2010) with the hypothesis of a pavement water-holding capacity of 1 mm. They optimize the watering rate based on 2 m a.g.l. air temperature simulations with a one-hour time step. Watering rates are deemed optimal if increasing them further only marginally increases cooling. It should be noted that these analyses are only briefly described in both papers and make no mention of explicit optimization targets or goals.
Analysis Method
We now describe the different methods used to determine the effects of pavement-watering in the selected literature.
Numerical Studies First, it should be noted that Kubo et al. (2006) only in-directly simulate watering effects. Indeed, water evaporation or advection are not integrated into their model, which only includes air flows and sensible heat exchanges. The effects of watering are accounted for in the form of surface tem-perature reductions, as they were observed in the experimental portion of their study. They therefore simulate the atmospheric effects of a 10°C reduction in pavement and sidewalk temperatures. On the contrary, Nakayama et al.(2012), Météo France and CSTB(2012) and Wei and He(2013) simulate water evapo-ration in their studies.
All of the numerical studies considered compare a single area in two states: with and without watering. As a result, any difference in the considered indicators can be unquestionably attributed to their watering strategy.
Experimental Studies Laboratory-scale studies directly compare the same pave-ment area in dry and wet conditions, accounting for significant changes in solar irradiance from one day to the next (Kinouchi and Kanda,1998;Nakayama and
3.2. Cooling Effects of Pavement-Watering 19
Fujita,2010;Kubo et al.,2006;Li et al.,2013). No studies basing their analyses on comparisons of a control slab with a watered one were found.
In all of the considered field trials at the street scale, the methodology ap-plied to determine micro-climatic effects is a direct comparison between case and control site measurements. Indeed,Kinouchi and Kanda (1997),Yamagata et al. (2008), Bouvier et al. (2013) and Maillard et al. (2014) base their analyses on the differences observed between a watered area and an unwatered one. Taka-hashi et al. (2010), though they use average observations from several watered and unwatered weather stations, proceed in the same manner. In all cases, the observed difference between watered and control sites is interpreted as the ef-fect of pavement-watering. Since this method does not account for preexisting differences between sites, site pairs must be chosen carefully.
3.2 Cooling Effects of Pavement-Watering
We now proceed to present the cooling effects reported in the selected litera-ture. The cooling effects of pavement-watering are measured using a variety of indicators to quantify micro-climatic and thermal effects.
Micro-climatic Indicators
Micro-climatic parameters used to study the effects of pavement-watering include air temperature, relative humidity, globe temperature andMRT. In addition, ther-mal comfort and UHI-mitigation indicators are also used.
In terms of frequency, air temperature is used most often, while globe tem-perature and MRT are least represented, though they are often included in the calculation of thermal comfort indexes.
Air Temperature Air temperature is widely used in the articles we have selected. Table 3.1 provides a summary of the air temperature effects provided as well as the instrument type and measurement height used, when indicated.
Table 3.1 – Reported air temperature effects.
Author Instrument Height Max
Kinouchi and Kanda (1997) Pt resistance 1 m -1°C
Yamagata et al.(2008) NA 0.5 m -2.5°C
Takahashi et al. (2010) NA 0.9 m -4°C
Bouvier et al. (2013) NA 2 m -0.4°C
Kubo et al. (2006) numeric 1.5 m -0.73°C
Kubo et al. (2006) numeric 0.5 m -2.13°C
Nakayama et al. (2012) numeric 1.5 m -5°C Météo France and CSTB (2012) numeric 2 m -2°C