Contents lists available atScienceDirect
Applied Energy
journal homepage:www.elsevier.com/locate/apenergy
Coupling the heating and power sectors: The role of centralised combined
heat and power plants and district heat in a European decarbonised power
system
Juan-Pablo Jimenez-Navarro
a,⁎, Konstantinos Kavvadias
a, Faidra Filippidou
a, Matija Pavičević
b,
Sylvain Quoilin
baJoint Research Centre, European Commission, 1755 Petten, the Netherlands bFaculty of Engineering Technology, KU Leuven, 2440 Geel, Belgium
H I G H L I G H T S
•
A description of the EU heating sector including spatial analysis.•
A detailed and open-source power and heat dispatch model is used.•
Combined heat and power, district heating and thermal storage improve energy system performance.•
Thermal storage enables a flexible operation of CHP increasing overall efficiency.•
Utilising all heat from CHP plants requires more than EUR 100 billion in DH networks. A R T I C L E I N F OKeywords:
European sector coupling Cogeneration
District heating Power sector Heat and power Long term decarbonisation
A B S T R A C T
This work examines the role of centralised cogeneration plants as one of the potential pathways of a future decarbonised energy system. Even in this context, thermal power plants will still exist and the utilisation of their excess heat via district heating networks can assist the decarbonisation of the built environment. In particular, the potential of existing thermal power plants to operate as combined heat and power (CHP) plants is assessed and their impact on the power system quantified. To do so, the European heat demand for the built environment is described, focused on the heat demand supplied with fossil fuels, and the European power sector is discussed. Then, a power system model (Dispa-SET) is used to evaluate this coupling pathway in terms of operating costs, efficiencies and associated CO2emissions. The analysis is developed for the current and future European power system. Results show that the conversion of thermal into CHP plants increases the efficiency and reduces both the operating costs and the environmental impact of the energy system. Not only that, it also offers alternative flexibility options when coupled with thermal storage. Still, large investments regarding the deployment of thermal networks are required to leverage the full CHP potential.
1. Introduction
The heating and cooling sector is recognisedas a priority to achieve the decarbonisation targets set for the European energy sector. It ac-counts for almost half of the EU (European Union) energy consumption. On top of that, consumption for heating and cooling is dominant in three main sectors, namely residential, tertiary and industry, with the residential (mainly household buildings) representing the highest share. The residential sector alone accounted for 54% of final heating and cooling energy consumption in 2015 [1]. The heating and cooling
sector is characterised by, often, old equipment with low efficiencies and, consequently, large amounts of waste heat[2].
The EU strategic long-term vision for a climate neutral economy by 2050 stresses the importance of an integrated energy system approach in order to achieve deep emissions reductions[3]. Before that, the EU Heating and Cooling Strategy highlighted the synergies in the energy system where district heating and cooling, cogeneration and smart buildings are expected to play a major role[2]. Both documents, ac-knowledge the need of an integrated approach within the energy system. From a policy perspective, the integration of the power and
https://doi.org/10.1016/j.apenergy.2020.115134
Received 27 January 2020; Received in revised form 27 April 2020; Accepted 2 May 2020 ⁎Corresponding author.
E-mail address:Juan-Pablo.JIMENEZ-NAVARRO@ec.europa.eu(J.-P. Jimenez-Navarro).
0306-2619/ © 2020 The Authors. Published by Elsevier Ltd. This is an open access article under the CC BY license (http://creativecommons.org/licenses/BY/4.0/).
heating sector is recognised as a key issue.
Until recently, many energy system power dispatch analyses de-couple the heat and power sectors. While the individual technologies — i.e. district heating, cogeneration and more — exist for many years, such integrated power dispatch analysis is very recent. It stems, mainly, from the European energy policy and the need for a new rapid dec-arbonisation pathway. The heat sector today, relies mostly on tech-nologies that convert a specific fuel — gas, liquid or solid fuels — into heat, while the power needs are supplied by centralised power plants, including centralised renewable power plants, or decentralised solar power plants. To achieve deep emission reductions in the European energy sector and in the heating sector in particular, stronger cross-sectoral linkages among the different energy uses and energy carriers are needed. This approach is commonly referred to in the literature with the term “sector coupling”. More specifically, this term implies that the sustainability of the future energy system requires the integration of electricity, gas, heating/cooling, mobility systems and markets to ben-efit from new energy sources and technology solutions[3].
The shift towards the future energy system, based on multi-sectorial coupling, implies the deployment of technologies that are able to cope with different energy carriers and energy storage systems. Key tech-nologies in this shift are, among others, the following: combined heat and power, power to gas, power to heat, power to liquid, and electric and thermal storage. Such an integrated approach will not only con-tribute to the decarbonisation but can also facilitate new innovative energy business models that foster competitiveness in the energy sector. For the case of the heat and power coupling, features that make this integration favourable are: the highly efficient combined heat and power production and the cost-effectiveness of thermal compared to electric energy storage. These elements allow incorporating larger amounts of renewable energy and guarantee the energy supply at af-fordable prices. The potentials and limitations of this pathway are in-vestigated in this paper.
This work focuses on the decarbonisation of the heating sector in the built environment via the utilisation of excess heat of thermal power plants via cogeneration and district heating networks. In particular, it assesses the potential of the remaining thermal power plants to operate
as CHP units.
From a policy perspective, the envisaged role of thermal cogen-eration plants in a future clean energy gencogen-eration portfolio has declined over the last years. Nevertheless, there will remain reasons to support the utilisation of CHP plants in the medium- to long-term. First, they are an important element of a sector integrated energy system acting as an efficient interface between power, gas and heat. Second, current fossil fuels used in thermal power and CHP plants can be replaced by re-newable fuels. Third, existing thermal power plants can be potentially retrofitted to, in addition, deliver heat if there is nearby demand.
Moreover, as discussed later in this paper, some future energy sce-narios for Europe assume that a considerable fraction of the power generation capacity is based on fossil-fuelled thermal power plants. If these plants are to run on fossil fuels — gas mainly, the output from each unit of fuel should be maximised avoiding any waste of valuable resources. As a result, we argue that CHP can be of potential benefit to the system. Based on all the above, we form the hypothesis for this study.
In this work, we, first, describe the European heat demand for the built environment, focused on the heat demand supplied with fossil fuels, as well as the European power sector. Then, we continue with the characterization of areas, with high-density heat demand, where heat can be supplied via district heating in a cost-effective way. Last, we use Dispa-SET — a detailed power dispatch system model[4]— to evaluate this coupling pathway in terms of energy system operating costs, effi-ciencies and associated CO2emissions. We develop the analysis for the current and future European energy system.
1.1. Literature review
Research on the coupling of heating to electricity — including technologies such as heat pumps, electric thermal storage or combined heat and power — to decarbonise the heating sector and integrate higher shares of RES is gaining attention. Previous works tackling the power-to-heat options for the energy sector differ in aspects like the technologies considered, the temporal scope or the geographical cov-erage. Taking these into account, this research focuses on one or more
Nomenclature
CDF Cumulative Distribution Functions CHP Combined Heat and Power DH District Heating
DHW Domestic Hot Water
ENTSOE European Network of Transmission System Operators -Electricity
EMHIRES European Meteorological derived High resolution renew-able energy sources
EU European Union GFA Gross Floor Area
GIS Geographical Information System
LA Land Area
MILP Mixed Integer Linear Programming RES Renewable Energy Source SH Space Heating
St Thermal Storage
TYNDP Ten Year Network Development Plan
AT Austria BE Belgium BG Bulgaria CH Switzerland CY Cyprus CZ Czech Republic DE Germany DK Denmark EE Estonia EL Greece ES Spain FI Finland FR France HR Croatia HU Hungary IE Ireland LT Lithuania LU Luxembourg LV Latvia MT Malta NL Netherlands NO Norway PL Poland PT Portugal RO Romania SE Sweden SI Slovenia SK Slovakia UK United Kingdom
of the following: cost effective operation, RES integration, dec-arbonisation or structure of heat supply[5,6].
The majority of studies dealing with combined heat and power plants and centralised heat supply— including centralised thermal storage in some cases — remains at local [7−10] or national level [11−13]. Few research papers covering several countries under a wider geographical area, such as the Nordic region[14]are found. In [15], an evaluation of the European energy system (EU27 + UK) is carried out considering a 100% renewable scenario. However, the re-sults presented are aggregated for the whole Europe.
Overall, northern European countries attract most of the research interest because they have a long experience in the centralised heat production and distribution via district heating networks. In our re-search, the whole European Union, taking into account the character-istics of national energy systems, is covered. This allows understanding the implications of, for example, the impact of neighbouring countries in a specific national energy system and more.
From a temporal perspective, a common trend in combining the current and future energy scenarios is observed. In other words, most of the scientific publications compare both the current and a future sce-nario. Regarding future scenarios, it is common to find studies that use 2050 as a mid-century milestone[8,16]. Even more, other works extend it to 2060[17]. Some of the works consider a full renewable scenario [15,16], while others assume certain shares of RES penetration. Our work consolidates different scenario exercises examining different shares of thermal plants being converted to CHP. This means that not only is an expected share of RES established but also the evolution of the existing conventional technologies too.
This literature review revealed different modelling approaches when it comes to the evaluation of sector coupling strategies. Studies focus on building algorithms for the optimisation of the issue of the integration of the electricity and heat sectors[18−21]. Many follow a cost minimization approach with, typically, an hourly resolution [22−24].
On top of the above, specific works also tackle the issue of flexibility offered by storage technologies. Thermal storage has been widely ac-knowledged as a cost-effective solution to maximise the efficiency of the energy supply[25,26]. Thermal storage costs less and can scale up easier when compared to electric storage. This has been reflected in several works[27−29]. What is more, sector coupling enables the use of thermal storage as a key technology to integrate more RES sources and, thus, decarbonise the energy system[26,30,31]. In particular, the incorporation of thermal storage will enable a more efficient operation of the CHP plants and thus benefit the energy system as a whole.
In this study, we build upon the work of previous relevant research [32−34] to explore the impact of the coupling of the heating and power sectors regarding its techno-economic performance under the smart energy systems concept[35]. Contrary to the approach followed so far — hourly modelling of energy systems with heuristics on power dispatching —, here the focus is put on the power system representation including more detailed constraints of its operation. It is formulated as a tight and compact optimization model (MILP).
This work is built upon the Dispa-SET model[4], an open source unit commitment and dispatch model of the European power system. The model includes a specific heating module, developed by the au-thors, that includes the formulation of a cogenerated steam-driven plants module producing both power and heat through an extraction/ condensing turbine and a thermal heat storage module[36,37]. This detailed modelling of the CHP plants, together with the incorporation of flexible storage options, allows the evaluation of different temperatures of heat supply. This feature enables the evaluation of the 4th and 5th district heating generations' role in the future energy system[38−40]. We aim to assess how the energy system behaves for counterfactual cases of different DH potential fuelled by centralised CHP plants, when available. Last, the work examines the role of thermal power plants in future decarbonisation scenarios, their potential for closer sector in-tegration and specific effects that this inin-tegration can bring to the power system.
To sum up, the novelty of this work lies with its pan-European scope including both the power and heat sectors. It stems from the advantage of a unit commitment and optimal dispatch model that allows identi-fying dynamic implications for the national energy systems and their interconnections. Even more, it aims to quantify the implications of the foreseen evolution of the European power system and the heating de-mand (achieved through energy efficiency measures) to, ultimately, identify areas to improve the energy system as a whole. Along this study, we have processed an EU-wide databased dedicated to the heating sector, which is used as input for our analysis.
This approach, among others, addresses the potential of DH across Europe, which is one of the major goals of this study. Based on a de-tailed European heat and power model, it also assesses the implications of the combined operations of these two sectors, including thermal storage as a flexibility option. Moreover, it consolidates different sce-narios for the future evolution of the European sector by 2050.
2. Overview of the EU heating sector in buildings
In this section, an overview of the EU heating sector focusing on the built environment is provided. To understand the challenges and op-portunities rising ahead for the building sector, the EU heat demand — including uses and fuels — and techno-economic indicators — national efficiencies and costs are described. The focus of this section is to set the basis for the modelling framework that will follow.
The heating and cooling sector represents half of the energy con-sumption in the EU, being supplied 75% by fossil fuels[2]. Buildings, including residential and services sectors, currently account for 40% of the total final EU energy consumption – having the largest share[3]. The residential, alone, is responsible for 54% of heating and cooling consumption, followed by services − 21% and industry − 24% (final energy − 2015 data). Therefore, the built environment has been identified as a key pillar in the European energy policy to achieve a climate neutral Europe by 2050[41].
The residential and tertiary sectors are responsible for about 35% of the total heat demand in the EU since 2000 − 20 times larger on
Fig. 1. Daily temperature profile per EU country, 2016 data. The grey bands above and below the main line correspond to the minimum/maximum temperature of
the day. The temperature regions in which space heating and cooling are demanded are indicated in red (below 18 °C) and blue (above 24 °C) respectively. Source:[42]
average than the final cooling demand during this period. At a national level, this heat demand represents the largest share of the final energy demand. This also applies to Southern European countries characterised by warm climate conditions (Data source:[1]).
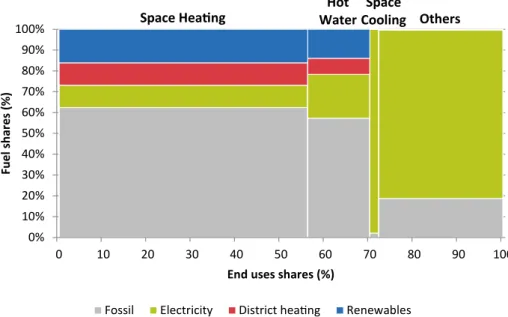
Heating demand includes three major uses: space heating (SH), process heating and domestic hot water (DHW). Space heating accounts for more than 50% of the heat demand while domestic hot water re-presents 15% (Fig. 2). In this work, industrial process heat is not tackled, as it comes usually with very specific requirements on quality and availability. These requirements make industrial customers less eligible to be connected to district heating systems. Space heating and cooling demand is directly related to temperature. As observed inFig. 1, cooling represents a very small fraction compared to heating. This is explained by the temperature profiles and the implied comfort zones. Most of the year, temperatures are moving into the heating zone (for most Member States) while cooling is only limited to a few hours per day during the summer months. For this reason, this study focuses on the heating sector.
Fossil fuels, still, represent the highest share of the fuel mix in the European heating sector for the residential and tertiary sectors [62% and 57% for SH and DHW uses respectively]. The remaining share, around 40%, relies on low carbon technologies – such as district and
electric heating, as well as renewable fuels, namely biomass.
In this paper, we examine the potential of replacing part of the fossil-fuelled solutions (grey area ofFig. 2) by district heat (red area of Fig. 2) provided from centralised CHP plants.
To assess the potential of centralised heat in the existing heating supply market, both costs and efficiencies of the current energy sector have to be examined. Later in section 3, the explanation on how these two parameters are computed and considered in the modelling exercise is provided. InFig. 3andFig. 4, the national values for both total sector efficiencies and unitary heat costs are presented. Those are processed, by the authors, using the JRC IDEES database and national energy prices[1,43,44].
The overall national heat supply efficiency — defined as the ratio between the delivered useful heating energy to the final energy con-sumption — remains low. Due to the existence of high-efficient tech-nology solutions, such as heat pumps, combined heat and power or even condensing boilers, higher values can be achieved. However, the persistence of old energy generation equipment impedes higher effi-ciencies. As a result, there is a big potential for efficiency improvements in the heating sector.
At national level, countries with the lowest shares of fossil fuels present higher overall efficiencies in the heating sector. This is the case
0%
10%
20%
30%
40%
50%
60%
70%
80%
90%
100%
0
10
20
30
40
50
60
70
80
90
100
Fu
el
sh
ar
es
(%
)
End uses shares (%)
Fossil
Electricity
District heating
Renewables
Space Heating
Water
Hot
Cooling Others
Space
Fig. 2. An EU27 + UK overview of the energy used in the built environment decomposed by end uses and fuels. Data source:[1]. ‘Others’ includes the non-thermal energy needs such as electric appliances and lighting.
0% 10% 20% 30% 40% 50% 60% 70% 80% 90% 100% SE FI DK DE NL LU FR UK AT BE MT SK IE ES SI IT LV EE EL PL CY LT CZ HU PT HR BG RO
N
ation
al
h
ea
tin
g
se
ct
or
eff
ic
ie
nc
y
Fig. 3. Overall national heating supply efficiencies in the EU27 + UK — 2015 data (Data).
of Sweden and Finland that show efficiencies values above 90%. In these countries, a large share of the heat demand is supplied via district heating, electricity or renewables. These options result in higher effi-ciencies in comparison with fossil-fuelled technologies (Fig. 3).
Similarly to the case of national heating efficiencies, national uni-tary heat costs vary across Europe. Heating costs for the end consumer depend on national energy markets rules, including taxes and tariffs, but also on the national energy mix.Fig. 4shows the national unitary heat cost computed as the weighted average of the unitary costs of the different energy fuels — gas, oil, solids, electricity, renewables and derived heat — and their contribution to the final energy consumption per country based on the Eurostat energy mix[43]1. Heat prices range from 127 EUR/MWh in Malta to 43 EUR/MWh in Romania. The Eur-opean average value is 70 EUR/MWh (Fig. 4).
3. Methods
This section lays down the method developed and used in order to examine the role of CHP in the future cleaner energy system. Here, first, the basis of the work required to set up the pan-European case study is presented — input data. Then, an analysis of the power plant potential to operate into a heat and power mode is introduced. Continuing, the unit commitment and dispatch model used to carry out our analysis is explained. Last, a conceptual model to estimate the required invest-ments to provide heat via thermal networks is presented. InFig. 5the process followed is depicted.
Starting with the input data, the following information is required: a
temporal characterization of the heat demand, the EU power plant fleet including installed capacities and technologies, and national heating prices and efficiencies — presented in the previous section — that will be use to assess the competitiveness of the centralised cogenerated heat.
3.1. Temporal characteristics of the heat demand
We use the Dispa-SET model to optimise the power dispatch pro-blem. It needs hourly resolution input data for the heating demand — including SH and DHW uses.
The SH use is highly dependent on climate conditions, mainly air temperatures. Because of that, hourly EU heat demand profiles that capture the variation of needs along the year are required. The heat demand profiles developed by authors in[49,50]are used. These pro-files have been scaled to match the national annual values for the fossil heat demand, which have been retrieved from[1].
On the contrary, for the DHW use, less dependent on the climate conditions and more on user behaviour, a flat profile has been con-sidered — non flat profiles would require additional analysis [51]. However, from the EU energy system perspective this assumption is accepted according to[52].
Continuing, the Heat roadmap Europe scenarios are used to estimate the 2050 fossil fuelled heat demand per country[53]. In order to keep the same basis of analysis but including the future evolution of the heat demand and the energy efficiency improvements we adjust 2015 data used from[1]according to the growth rate observed in Heat roadmap
Europe scenarios for 2050. Aggregated current and future demands are presented inFig. 6. Based on that, the hourly heat demand time series per country is estimated. For the sake of conciseness the total European heat demand is shown inFig. 7.
0 20 40 60 80 100 120 140 AT BE BG CY CZ DE DK EE EL ES FI FR HR HU IE IT LT LU LV MT NL PL PT RO SE SI SK UK
Aggr
eg
at
e
he
ati
ng
co
st
s
(EUR/
MW
h)
Fig. 4. National unitary heat cost in the EU27 + UK — 2015 data (Data).
Source:[43,44]
Dispatch model Economic optimisation Hourly heat demand Power plant fleet CHP plant model Exogenous national heating costs
Ex post economic evaluation. Thermal network investments Inputs Hydro profiles V-RES profiles Net Transfer Capacity Electricity profiles Sources RESTORE 2050 EMHIRES TYNDP ENTSO-E
Fig. 5. Methods’ description —[45]ENTSO-E,[46]RESTORE 2050,[47]EMHIRES,[48]TYNDP used in sources.
1For gas and electricity costs, we have assumed the average value of both household and non-household prices as provided by Eurostat
3.2. The EU power system – Power plant fleet
To evaluate how the entire energy system — and especially the power sector — can benefit from a power and heat sector integration strategy, the characteristics of the power sector in Europe have to be understood. Specifically, the available power capacity per technology portfolio will determine the potential of the centralised CHP plants to supply both heat and power cost-effectively.
In order to choose the most appropriate scenario to serve as our future baseline, a literature review of different scenarios is conducted. The scenarios assessed, produced by institutions such the International Energy Agency, the European Commission, Green Peace and the Joint Research Centre, aim to estimate the available power capacity in Europe by 2050 ([3,54,55−57]).
The results of this review are presented inFig. 8. Our selection is based on the following criteria: (a) to be realistic yet ambitious, (b) not to include extreme and skewed evolutions of individual technologies and (c) availability of data on a Member State level. Eventually a sce-nario close to LTS – ELEC and JRC-GECO-15C is generated based on an extrapolated version of EUCO30[58]as it represents a median and non-technology biased decarbonisation scenario for 2050. InFig. 9, a more detailed description, in terms of power capacity per group of tech-nology for the current and 2050 scenarios, is presented.
3.3. Retrofitting power plants to produce heat and power
Existing steam-based power plants that are currently operating as power units can modify their operation to deliver heat and power si-multaneously, reaching efficiencies of up to 90%[59]. This retrofit is usually limited to the modification of the steam turbine to extract heat at a higher temperature. The incremental cost of building a CHP com-pared to a single purpose plant comcom-pared to the overall investment is usually minimal and falls at the range of 100–200 EUR/kW.
The disadvantage of retrofitting steam-based power plants into CHP, from a technical perspective, is the reduction of the maximum amount of power that could be delivered. In other words, the higher the amount of heat produced, the lower the maximum potential output power. Moreover for the same heat quantity needed, the higher the tempera-ture required the lower the electric efficiency. Temperatempera-ture suitable for district heating usually comes from the last two stages of the turbine or only the last for more modern district heating systems, so the efficiency loss falls into the range of 5–10%. This power loss represents the power to heat ratio, equivalent to the coefficient of performance (COP) of a heat pump [60]. As a result, the combined production of heat and power leads to an increase of the overall efficiency compared to the single production of electricity. More detailed information on how different steam-based turbines can operate as CHP plants can be found in previous work of the authors[61].
3.4. Modelling framework
The open-source model Dispa-SET v2.3. (http://www.dispaset.eu) is used for this study. Dispa-SET[4]is an existing unit commitment and dispatch model with modifications done in previous work that made it suitable to have a detailed CHP representation. The aim of the model is to represent, with a high level of detail, the short-term operation of large-scale power systems, solving the unit commitment problem. To that end, it is considered that the system is managed by a central op-erator with full information on the technical and economic data of the generation units, the demands in each node, and the transmission network. The main model features can be summarized as follows: minimum and maximum power for each unit, power plant ramping limits, reserves up and down, minimum up/down times, load shedding, curtailment, pumped-hydro storage, non-dispatchable units (e.g. wind turbines, run-of-river, etc.), start-up costs and ramping costs. The de-tailed description of the model is outside the scope of the paper but all 0 50 100 150 200 250 300 350 400 450 AT BE BG CY CZ DE DK EE EL ES FI FR HR HU IE IT LT LU LV MT NL PL PT RO SE SI SK UK Use fu l ener gy (T W h) 2015 2050
Fig. 6. National fossil-based heat demand in the EU27 + UK. Current (2015) and 2050.
data and equations are available in the documentation website men-tioned above and in previous literature.
3.5. Simplified thermal network costs evaluation method
The major drawback when it comes to providing heat from cen-tralised plants is the distance to the heat sinks. In those cases where the thermal network has to be built to connect the power plant with the demand area, the high upfront investment can limit the potential of the
CHP plants. To put our study into context of the levels of investments needed, an ex-post evaluation is carried out.
To better understand the implication of distances between heat sources and sinks and, afterwards, evaluate the cost of building a thermal network, we use two data sources: the PETA4 thermal atlas — heat sinks — and the JRC Power Plant Database (JRC-PPDB).
The PETA4 is a pan European Thermal Atlas that offers, among others, a geographical representation of the heat demand — in the form of a 100 m-resolution grid, for 14 EU Member States — that accounts 0 500 1000 1500 2000 2500 3000
EU
CO
323
25
_20
30
m
od
_E
UCO
3
EU
CO
323
25
JR
C-GE
CO
-1
5C-20
18
JR
C-GE
CO
-2
c-20
18
LT
S
- B
as
el
in
e
LT
S
- E
E
LT
S
- CI
RC
LT
S
- E
LE
C
LT
S
- H
2
LT
S
- P
2X
LT
S
- CO
M
BO
LT
S
- 1
.5
TE
CH
LT
S
- 1
.5
LI
FE
BN
EF
-R
ef
-2
01
8
ET
P-2D
S-201
7
ET
P-B2
DS
-2
01
7
Gr
ee
nP
ea
ce
-A
DV
-2
01
5
Gr
ee
nP
ea
ce
-E
R-201
5
Ins
ta
lle
d
ca
pa
ci
ty
(G
W
)
Solar Wind Hydro Nuclear Thermal (non Nuclear)
Fig. 8. Power generation capacity for different scenarios in 2050[54−57]. For reference the first bar shows the official EU scenario EUCO32325 for 2030[58]
for approximately 85–90% of the total heat demand in Europe, por-traying heat demand densities[32].
The JRC power plant databased, which includes geographical in-formation of the currently available power plants across Europe, is used to identify the location of thermal power plants that can be retrofitted to deliver heat and power.
These two sources are used to carry out a geographical analysis — GIS assessments — on how much heat is needed on the basis of two criteria: distance between source and sink and heat demand density areas. First, we exclude those areas that do not fulfil the distance cri-terion. With the remaining we evaluate different scenarios based on the heat demand density. Assumptions on this are further elaborated in section 4 dedicated to the case studies.
With the results obtained from the geographical analysis, a simpli-fied cost evaluation method is developed. It focuses on the piping and construction costs, which are acknowledged as the largest ones[62]. We follow the empirical method provided in [63]together with the geographical information available in[32]. Next, the calculation steps are presented — some of them rely on how PETA4 has been designed. First, a building density value (e) to the five levels of demand in-cluded in PETA4 is set. Typical values assumed for the ‘e’ parameter are: inner city areas: e ≥ 0.5; outer city areas: 0.3 ≤ e ≤ 0.5; and non-city areas: 0 ≤ e ≤ 0.3[63].
Then, the weighted average building density (e¯) based on the dif-ferent demand levels for a given area is calculated. Next, the route meter per supplied land area (rm) in km rm / km2land area based on the empirical equation provided in[64]is calculated.
=
y 16.17e0.149 (1)
The linear heat demand is then computed as the ratio between the linear heat demand density (LHD) and the route meter per supplied land of area (rm). Using the LHD parameter, the average pipe dimen-sion (DN) is obtained using the following empirical equation:
= +
DN 48.6ln(LHD) 63 (2)
Last, the network cost per linear meter (EUR/rm) is calculated as follows:
= +
CDH Pipenetwork(DN) 270 2.2DN (3)
4. Case study
This section introduces the scenarios used to assess the benefits and limitations derived from the integration of the power and heating sec-tors via CHP plants. Each scenario is defined by a heat and power de-mand and a power plant fleet as explained in section 3.2 (Fig. 9). In addition, national heat efficiencies and costs are required to char-acterise the conventional heat supply per country as presented before (Fig. 3andFig. 4). This heat supply option allows the evaluation of the cost-effectiveness of centralised CHP plants.
Regarding the heat demand to be supplied, different heat coverage cases based on a variety of geographical heat demand densities[33]are examined. To do so, three levels are considered:
— Full: All heat can be absorbed by heat networks. This scenario
serves as an upper limit or a theoretical potential that is based on the assumption that suitable heat sinks are available to serve the total heat produced at the plants via district heating networks. While this cannot be considered as a realistic scenario, it can serve as a reference for the rest.
— Medium: Medium and high heat-density areas are able to absorb cogenerated heat.
— Low: Only high heat-density areas are able to absorb cogenerated heat. This option is the most realistic in terms of realized projects as the heat density defines the amounts of customers that can be served and consequently the profitability of the project.
The description of all scenarios is summarised inTable 1. Two base case scenarios, were developed according to the current and expected future status of the energy system as described in previous sections. These scenarios set the framework to compare how the proposed sector coupling strategy would affect the entire energy system. By comparing current and future scenarios, we aim to understand the opportunities that the coupling of power and heat can offer in an evolving energy system. The indicators examined are, among others, operating costs, efficiency, emissions, and integration of higher shares of renewables.
On top of that, the use of centralised thermal storage for some of the scenarios is taken into account (Table 1). All these elements are pre-sented in detail, following in this section.
All power system simulations and analysis are carried out for EU27 + UK excluding Cyprus and Malta due to their island nature. Norway and Switzerland are included in the simulation as they affect heavily the European power system but they are not included in the aggregate EU results. These two countries are only considered from the power but not from the heating perspective.
4.1. Combined heat and power plants conversion
The power plant conversion is modelled based on the model for extraction condensing turbines presented in previous work[65]. Ac-cording to the current development of district heating networks, a supply temperature of 100 °C has been considered. This temperature is a conservative assumption as future thermal networks seek to operate with lower temperatures that lead to an increased efficiency of the CHP plants (30–70 °C — 4th generation of thermal networks[66]) and to economic benefits[67]. Fig. 10shows the fraction of thermal power plants considered for the conversion to CHP — 21% and 12% of the total capacity for the current and future scenario respectively.
4.2. Conventional heat supply
The heat demand not covered by centralised CHP plants is provided by a virtual heat supply plant defined per country. For the sake of comparison, this plant is characterised by the national average effi-ciency (Fig. 3) and average cost of the heating sector (Fig. 4). This input data as well as estimated efficiencies and costs were presented in sec-tion 2.
Table 1
Summary of scenarios, both for current and 2050.
Code Scenario Description CHP Heat coverage Heat Storage
Base case Base case Base case — — —
CHP full Full potential CHP No geographical constraints ✓ full —
CHP full St Full potential CHP + Storage ✓ full ✓
CHP 120 Medium potential CHP Heat supply to medium and high heat density areas ✓ Medium > 120 TJ/km2 — CHP 120 St Medium potential CHP + Storage ✓ Medium > 120 TJ/km2 ✓ CHP 300 Low potential CHP Heat supply to high heat density areas ✓ Low > 300 TJ/km2 —
4.3. Heat demand coverage
Continuing the analysis of the deployment of the cogeneration and district heating, scenarios are set based on the availability of high-density geographical areas, in terms of heat demand, that can be sup-plied via district heating in a cost-effective way. For a specific geo-graphical area, a cost-effective supply from CHP implies two conditions: a minimum level of heat demand density — expressed in TJ/km2, and a maximum distance between the closest CHP plant and the geographical area itself of 100 km. As a result, those areas that do not comply with both conditions are excluded. Thus, only areas with heat demand densities (TJ/km2) above a certain threshold are suitable to be supplied from centralised CHP plants in a cost-effective way. Only those areas that are < 100 km away from thermal plants that can operate as CHP plants have been accounted for.
The required geographical information on heat demand areas is retrieved from the Pan-European Thermal Atlas Peta v4.3 developed in the framework of the Heat Roadmap Europe 4 (HRE4) project. The thermal atlas is available, so far, for 14 EU countries. Therefore, results are limited to these countries[32]. Still, they represent 85% of the heat demand in Europe. For those countries where data is not available the CHP option is disabled. In the case of the power plants, the geo-graphical information available in the JRC Power plant database[68] have been considered.
Based on the heat demand density levels defined in HRE4 Europe, two levels are assessed: > 120 TJ/km2(medium and high heat demand density areas) and > 300 TJ/km2(high heat demand density areas). Fig. 11shows the total heat demand for the different density levels
considered for the 14 EU countries available.
We show the results of the geospatial analysis carried out to de-termine the amount of the energy demand that can be supplied from thermal power plants, considering a maximum distance of 100 km between supply and demand points as discussed in[69]. InFig. 12, the results of the geospatial analysis are presented. Looking into a given thermal power plant (x-axis), the number of heat demand areas falling within a 100 km radius from that power plant is computed (light-red line, left y-axis), as well as the distance to the closest area (dark-red line, right y-axis).
4.4. Centralised thermal storage
In this study, we focus on assessing the value of heat storage as a flexibility resource rather than finding optimal sizing. As a result, large sizes at country level assuming an available storage capacity equal to the maximum daily demand per country are considered. This capacity turns out to be enough to accommodate the heat production and the daily variations of the demand. Increasing the storage size does not result to any additional benefit, unless we move to larger multi-seasonal storage. The latter is outside the scope of this study.
5. Results
In this section, the results of the different scenarios, presented in Table 1, are compared and discussed for current and future scenarios. The comparison is carried out based on the following parameters: op-erating costs, emissions, efficiency and supply-side flexibility. On top of that, specific aspects from the different scenarios are presented to im-prove the understanding and implications among variables and as-sumptions including the role of the different flexibility options.
5.1. Utilisation of CHP — Electricity and heat generation
The use of centralised cogeneration plants in combination with district heating results in a higher energy generation — both electricity and heat — from them. This is because the new combined heat and power capacity enables a highly efficient and more affordable energy generation compared with the original fossil fuel options. As a result, the CHP plants operate at high capacity ranges, which leads to an in-creased amount of electricity generated compared to the thermal op-erating plants.
Focusing on electricity, the higher shares of renewable energy result in a lower contribution from the CHP plants in 2050. The contribution of renewable sources represents 37% of the total energy supplied while 0 200 400 600 800 1000 1200 1400 1600 1800 2000 Current - no CHP Current - CHP 2050 - no CHP 2050 - CHP Po wer Cap ac ity (GW)
Solar Wind Hydro Nuclear Fossil fuels CHP
Fig. 10. Power capacity per group of technologies in the EU27 + UK. Current
and future scenarios.
0 50 100 150 200 250 300 350 400 450 AT BE CZ DE DK ES FI FR HU IT NL PL RO SE UK Av ail ab le H ea t De m and (T W h)
low density areas medium density areas high density areas
Fig. 11. National useful energy heat demand for different technical potentials: high (> 300 TJ/km2), medium (> 120 TJ/km2and < 300 TJ/km2) and low (< 120 TJ/km2) demand areas. European countries covered in HRE4.
the CHP 21% for the future in the full CHP storage scenario — depicted in Fig. 13. In the current scenario these numbers are 11% renewable sources and 28% CHP respectively. The increase in the renewable ca-pacity hinders the utilisation of centralised heat from CHP plants and vice versa suggesting that in highly decarbonised scenarios additional decarbonisation pathways should be explored. In other words, the more the system relies on RES, the more difficult the CHP operation becomes. When it comes to heat demand, a fossil fuel shift takes place from the current situation (grey area in Fig. 2) to DH supply (Fig. 14). Comparing the base case scenario to the CHP full in the current context, it is observed that the share of heat from fossil fuels for space heating decreases from 62% to 27%. District heating for space heating increases from 11% to 43%. In the case of DHW, the district heating share in-creases from 8% to 37%. Heat from electricity and renewables remains unchanged in these scenarios.
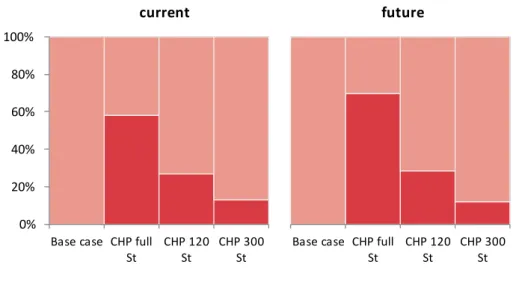
Examining the different scenarios, heat supply from CHP varies depending on the available heat sinks. The share of heat supplied from CHP plants represents more than half of the total heat demand (58%) in the CHP full scenario. This share decreases with the technical potential (Fig. 15). In 2050, the shares of heat supplied from CHP are even larger due to a lower heat demand — that is 67% of the heat demand in the current scenario. But, the gross amounts of heat produced by CHP de-crease by 2050 when comparing equivalent scenarios studied. In the CHP full scenario, the reduction of the gross heat production is in the order of 20%. Therefore, the utilisation of the combined generation of heat and power is the preferable option as long as heat demand can be supplied via district heating.
5.2. Curtailment
CHP introduces a new interface to satisfy heat demand but also more constraints on the operation of the power system. The model is a cost minimization model. So, due to the new interface and the power system restrictions, curtailment happens for two reasons. The first reason is to avoid infeasibilities as the system may not be able to ramp down conventional plants in periods of low demand and high wind. The second is that sometimes it is more cost effective to curtail and satisfy power and heat from the CHP plant than to shut down a CHP plant and cover the heat demand from external sources. In the model description, these external sources are referred as “conventional heat supply”. In this case, not only the virtually free renewable energy is not utilized but also the system is penalized with curtailment costs. In this study this amounts to 400 EUR/MWh. The above means that there is a trade-off between RES and CHP use. The optimal mix of supply is determined by the efficiencies and costs of the supply-side heating technologies. Therefore, the system has two possibilities; either it curtails RES power and delivers as much heat as possible from CHP plants or it limits the utilisation of the available CHP capacity and increases the utilisation of the alternative heat supply.
These effects are observed in our scenarios. In the current scenario, the curtailed RES generation represents 1% of the total RES generation while for the full potential scenario it increases to 9%. In 2050, the same effect is observed: higher contributions from CHP lead to higher shares of energy curtailed. As a result, the curtailed RES generation reaches 11% in the full potential scenario, even when the heat storage option is enabled. In both current and future scenarios, the amount of
0
10
20
30
40
50
60
70
80
90
100
0
10
20
30
40
50
60
70
80
90
100
Di
stanc
e
(km)
De
m
and
a
re
as
(nu
m
be
r)
Thermal plants
Number of areas
Minimum distance
Fig. 12. Geospatial analysis of heat demand areas
and thermal power plant fleet. On the × axis plants are sorted by their proximity to the closest demand area. The ‘Minimum distance’ line indicates the closest demand area for a given plant. A maximum distance of 100 km is considered. Note: power plants have been arranged based on the distance to the closest demand area, from left (0 km: power plant next to a demand area) to right (100 km distance).
0%
20%
40%
60%
80%
100%
Base case CHP fullSt CHP 120St CHP 300Stcurrent
Base case CHP fullSt CHP 120St CHP 300Stfuture
RES Hydro CHP ThermalFig. 13. Share of electricity generation per group of energy generation technologies (RES includes wind solar and bio, Thermal includes gas and steam turbines and
curtailed power decreases when the feasible supply of heat is limited to a certain heat demand density. Lower available heat demand to be supplied by centralised CHP plants reduces their operation and, con-sequently, larger amount of RES can be delivered. Thus, in 2050, the curtailed energy decreases to 6% and 5% in the medium and low sce-nario respectively (Fig. 16).
5.1 Operating costs
The conversion of thermal power plants into combined heat and power operation reduces the total operating cost of the system. For both cases under study, running costs drop depending on the utilisation of CHP plants. The full CHP potential scenarios cut down operating costs by 17% and 20% for the current and future scenarios respectively. The increase in the power operational costs is due to the higher utilisation of the CHP capacity. In the current scenario, the power operational costs increase by 48% whereas in the future by 14% (Fig. 17).
0%
10%
20%
30%
40%
50%
60%
70%
80%
90%
100%
0
10
20
30
40
50
60
70
80
90
100
Fu
el
sh
ar
es
(%
)
End uses shares (%)
Fossil
Electricity
District heating
Renewables
Space Heating
Water
Hot
Cooling Others
Space
Fig. 14. A comprehensive view of useful composition of the built environment for different uses and fuel in the EU. Current CHP full potential scenario (checkFig. 2 for comparison).
0%
20%
40%
60%
80%
100%
Base case CHP full
St CHP 120St CHP 300St
current
CHP
Conventional heat supply
Base case CHP full
St CHP 120St CHP 300St
future
Fig. 15. European share of heat generation from the different technology options (Conventional heat supply and CHP — with and without St) in the current and
future scenarios. 0% 5% 10% 15% 20% Base case CHP fullSt CHP 120St CHP 300St current Base case CHP fullSt CHP 120St CHP 300St future
Fig. 16. Share of curtailed energy from renewable sources. Current (left) and
5.3. Overall system efficiency
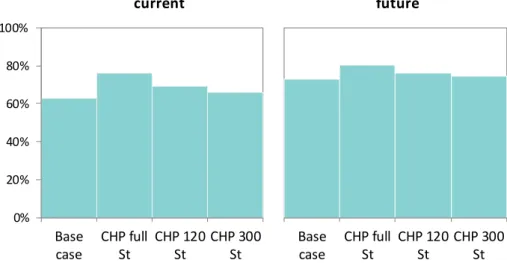
One of the major benefits, resulting from the use of centralised co-generation and district heating, is the increase in the overall efficiency of the system. The overall efficiency of the system is defined as the ratio between the total amount of useful energy delivered (heat and elec-tricity) and the total input fuel. This increase is observed due to the high overall CHP efficiencies that for some operational ranges can reach values of 90%. At the same time, conventional thermal plant effi-ciencies are in the order of 50%.
The overall efficiency in the full potential scenario increases by 20% compared with the base case scenario in 2016 that increases from 63% to 76% (Fig. 18). In 2050, due to the higher shares of renewables and thus less utilisation of CHP plants, the overall efficiency increases only by 10%, specifically from 73% to 80%. In both years, a fall in the overall efficiency is observed in the scenarios that centralised heat can only be supplied in areas with certain levels of heat demand density.
5.4. Emissions
CHP leads to a considerable reduction of CO2 emissions. For the 2016 scenarios the total CO2emissions are reduced from 1320 MtCO2 to 980 MtCO2in the full potential scenario, signifying a 24% reduction. CO2 emissions remain below the base case scenario even when the
utilisation of centralised heat is limited to the high-energy demand density areas. For those cases emissions are reduced by 4% in both year scenarios. For the 2050 scenario an increase in the emissions is ob-served, compared with the base case scenario (+13%) as a result of a higher amount of renewable energy curtailed. This increase in the power system is compensated by a 70% CO2 emissions reduction achieved in the heating sector, leading to a global reduction of 17% (Fig. 19).
5.5. Generation mix
The analysis of the power generation per technology shows how the use of CHP plants, that triple its production (fossil gas category), affects the contribution from different technologies. Fig. 20shows how the operation of different plants is modified in the form of load duration curves. Alternatively, they correspond to the inverse cumulative dis-tribution functions (CDF) of the energy generation of each technologies. The area under the curve corresponds to the energy that each tech-nology generates, the intersection with the y axis corresponds to the peak generation and the intersection with the × axis the amount of time that the each power plant type was on.
Gas based technologies increase heavily their capacity factor as the operation in cogeneration mode makes them the preferred way to re-duce the overall system costs. Due to the above, power from coal, oil
0
10
20
30
40
50
60
70
80
90
Base
case
CHP full
St
CHP 120
St
CHP 300
St
Sy
st
em
co
st
s (
bn
E
UR)
current
Power cost
Heat cost
Base
case
CHP full
St
CHP 120
St
CHP 300
St
future
Fig. 17. Total European energy system (heat and power) costs. Current (left) and future (right) scenarios.
0%
20%
40%
60%
80%
100%
Base
case
CHP full
St
CHP 120
St
CHP 300
St
current
Base
case
CHP full
St
CHP 120
St
CHP 300
St
future
0 250 500 750 1,000 1,250 1,500
Base
case
CHP full
St
CHP 120
St
CHP 300
St
CO
2
em
iss
io
ns
(Mt
)
current
Heat supply emissions
Power plant emissions
Base
case
CHP full
St
CHP 120
St
CHP 300
St
future
Fig. 19. Total European energy system’s emissions (millions of tCO2-eq).
and waste decreases considerably. To a lesser extent, the use of CHP lowers the generation from nuclear. Regarding renewable technologies, wind production remains the same for the scenarios while solar seems to be curtailed in the current scenario.
5.6. Flexibility options — The role of thermal storage
Results are presented for four major scenarios for the two years under consideration that include thermal storage in combination with cogeneration and district heating. However, to better understand the role of thermal storage and its benefits, it is worthwhile comparing the results between scenarios that consider both availability and non-availability of thermal storage. When doing so, it is observed how the
availability of thermal storage results in larger shares of heat supplied from centralised CHP plants. Thus, for the full potential scenario, the amount of heat provided from CHP increases by 4% and in the 2050 scenario by 2%. This larger utilisation increases the higher overall system’s efficiency by 1% today and 0.4% in the future scenario, as depicted inFig. 21.
If the utilisation of heat is restricted to those geographical areas with a certain level of heat demand density, in which the deployment of thermal networks is feasible, the effect of thermal storage on the overall system efficiency is reduced. This is because CHP plants operate at lower ranges and, thus, there is a lesser need for the flexibility provided by thermal storage. Hence, for the high-density scenarios, the presence of thermal storage only increases the production of heat from CHP by 50% 55% 60% 65% 70% 75% 80% 85% 90% CHP full CHP full St CHP 120 CHP 120St CHP 300 CHP 300St
Eff
ic
ie
nc
y
Fig. 21. Overall energy efficiencies for the different CHP scenarios with and
without storage (future scenario).
Fig. 22. Supply side flexibility options for different scenarios: (a) Base case, (b) full CHP potential + thermal storage for the current energy system, (c) Base case and
(d) full CHP potential + thermal storage for 2050 energy system.
0 20 40 60 80 100 120 140 160 180 200 0 500 1000 1500 2000 2500 3000 3500 In ve stm ent c os t p er an nu al h eat so ld (E UR/G J)
Heat demand density (GJ/ha)
Full
High Medium
Fig. 23. Investment costs related to the thermal network for different heat
0.2% today and 0.1% in 2050. Electricity production from CHP de-creases by 3% today and by 2% in 2050, giving way to a larger con-tribution from renewable generation and therefore less curtailed re-newable generation.
Regarding total system operating costs, in all the equivalent cases — with and without thermal storage — the presence of thermal storage leads to a cost reduction. For the future scenarios, the cost reduction ranges from 2% — in the full potential scenario — to 0.7% — in the high potential one.
Concerning its impact on the integration of renewable sources, it results in a reduction of the amount of curtailed energy. For the full potential CHP scenario in the current energy system, the availability of thermal storage reduces curtailment by 3% compared to the equivalent scenario without storage. In 2050, thermal storage enables even a larger reduction of 8% due to a higher share of renewable power ca-pacity — 26% in the current scenario and 56% in the 2050 scenario of the total power capacity.
Beyond thermal storage flexibility, national energy systems have an additional alternative to integrate large amounts of renewable genera-tion: interconnections. As a result, the system can store thermal energy, transfer power generation to other countries or, ultimately, curtail the renewable energy.Fig. 22shows these flexibility options in the form of a load duration curve. In other words, storage, together with inter-connections between countries, provide flexibility to the system. As a last resource, energy production from renewables has to be curtailed.
As observed, the operation of thermal power plants as CHP plants, together with thermal storage, has a dual effect. On one hand, thermal storage makes the system more flexible through a more flexible CHP operation. But, on the other, the heat-driven requirements of the CHP plants — cost-efficiency of the heat supply — reduce their flexibility leading to an increase of the energy curtailed. In other words, from the system perspective it is cheaper to run the CHP and curtail a fraction of RES production. This effect is depicted inFig. 22when comparing cases in pairs — (a)-(b) and (c)-(d). The power system needs more flexibility that is provided by the available storage and interconnection capacity (green and blue area is growing) but when this is reaching its limits renewable energy needs to be curtailed. This is why the red area (curtailment) increases in both pairs. This effect is amplified if the share of RES in the energy system increases (pair (c)-(d)) where some cur-tailed is also observed for the base case.
Examining the power generation exchanged between countries (outflow), an increase for the current cases ((a) and (b)) — not present when comparing the future ones ((c) and (d)) — is observed. This is explained by the amount of renewable generation. In the current sce-nario with less available RES generation, the system can exchange power generation flows between countries. However, when national systems increase their RES shares, many countries are in need to ex-change of RES generation, which is limited. As shown, this effect leads to higher curtailment — red area in (d). This suggests that the more power storage or interconnections among national energy systems or demand side response, the more this effect can be alleviated.
5.7. Ex post evaluation of investment costs — Thermal networks
The estimation of costs has been performed for the 14 EU countries included in the HRE4 project. They represent 85% of the total EU heating demand. As a result, the assessment provides valuable insights on the investments required to deploy thermal networks across Europe. Following the method proposed, as described in section 3, the full po-tential scenario will require a total investment of EUR 1 560 billion, while in the case of high and medium density demand the investments in the network are of the order of EUR 128 billion and EUR 400 billion respectively. Fig. 23 shows the investment cost per unit of energy provided for different heat demand densities. As expected, the invest-ments decrease with the increase of the heat demand density.
6. Conclusions
This work focused on the assessment of the heating and power sector coupling via one potential pathway, which is the utilisation of excess heat from centralised power plants that can operate as CHP plants. Specifically, it tackled the heating requirements in the built environment. To do so, we, first, characterised both the European heat demand for the built environment, focused on the heat demand sup-plied with fossil fuels, and the European power sector. Then, we quantified those areas with high-density heat demand where heat can be supplied via district heating in a cost-effective way. Last, we used a very detailed power system dispatch model with heat-related features to evaluate the proposed coupling pathway in terms of energy system costs, efficiencies and associated CO2emissions.
The results aimed to reflect the benefits and limitations of power and heat sector coupling affects the energy sector by 2050 taking into consideration the potential evolution of the energy sector — power sector and heating needs — based on policy trends. The investment required for the deployment of thermal networks is also discussed — based on today’s heating demand.
The design of the study focuses on the comparison of scenarios of various shares of power plants converted to CHP which provide heat for district heating. Uncertainties on the evolution of the sector and availability of accurate data for such large and complex system make the comparison approach more suitable. Of course, the design of such study comes with limitations that future research should address.
From our work, it can be concluded that the potential of the existing thermal plants to operate in cogeneration mode allows increasing the efficiency of the energy system as a whole, from 63% to 80% in the current scenario, but also enables the use of thermal storage. In fact, thermal storage itself increases the efficiency of the energy system by 0.4% for the current scenario.
In terms of operating costs, we observe an overall reduction in the heat and power section of 20%. In terms of heat demand that can po-tentially be covered, CHP can supply up to 70% in a future scenario. This result is based on studies that claim that by 2050 energy efficiency measures in the built environment will reduce the heat demand by a third compared to today.
Our study confirms that, driven by their high efficiencies, a large share of CHP plants can hinder the utilisation of variable RES genera-tion in the energy system. Specifically the amount of RES energy that has to be curtailed ranges between 6 and 10% depending on the sce-nario considered. However, even by this amount of curtailment the overall solution is cost-effective. Still, improving flexibility options such as interconnections, adding flexible power capacity and demand re-sponse could alleviate this effect.
Last, regarding the spatial characteristics of the heat demand, this work discussed the impact of considering which areas are suitable to be supplied from centralised heat via DH. To do so, a spatial analysis taking into account the density of the energy demand — where, indeed, DH networks have been proven suitable — and both the location of thermal power plants and the demand sinks — assuming a maximum distance of 100 km between heat source and sink was carried out. Results show that limiting the heat supply to high-density areas — heat demand of > 300 TJ/km2—, covering a total area of 6 500 km2across the EU. In terms of investment costs, by 2050, a total of EUR 130 billion will be required, equivalent to an annual investment cost of EUR 4 billion (assuming a lifetime of 50 years).
Overall, the operation of the existing thermal power plants in co-generation mode together with district heating networks and thermal storage has still the potential to contribute in the decarbonisation of the European heating sector.
7. Disclaimer