Publisher’s version / Version de l'éditeur:
Journal of the Illuminating Engineering Society, 28, Winter 1, pp. 117-129,
1999-02-25
READ THESE TERMS AND CONDITIONS CAREFULLY BEFORE USING THIS WEBSITE. https://nrc-publications.canada.ca/eng/copyright
Vous avez des questions? Nous pouvons vous aider. Pour communiquer directement avec un auteur, consultez la
première page de la revue dans laquelle son article a été publié afin de trouver ses coordonnées. Si vous n’arrivez pas à les repérer, communiquez avec nous à [email protected].
Questions? Contact the NRC Publications Archive team at
[email protected]. If you wish to email the authors directly, please see the first page of the publication for their contact information.
NRC Publications Archive
Archives des publications du CNRC
This publication could be one of several versions: author’s original, accepted manuscript or the publisher’s version. / La version de cette publication peut être l’une des suivantes : la version prépublication de l’auteur, la version acceptée du manuscrit ou la version de l’éditeur.
Access and use of this website and the material on it are subject to the Terms and Conditions set forth at
Toward the accuracy of lighting simulations in physically based
computer graphics software
Tiller, D. K.
https://publications-cnrc.canada.ca/fra/droits
L’accès à ce site Web et l’utilisation de son contenu sont assujettis aux conditions présentées dans le site LISEZ CES CONDITIONS ATTENTIVEMENT AVANT D’UTILISER CE SITE WEB.
NRC Publications Record / Notice d'Archives des publications de CNRC:
https://nrc-publications.canada.ca/eng/view/object/?id=09e7229b-9b95-4621-a132-439021dd4df0 https://publications-cnrc.canada.ca/fra/voir/objet/?id=09e7229b-9b95-4621-a132-439021dd4df0http://www.nrc-cnrc.gc.ca/irc
T ow a rd t he a c c ura c y of light ing sim ula t ions in physic a lly ba se d
c om put e r gra phic s soft w a re
N R C C - 4 2 0 1 9
T i l l e r , D . K .
F e b r u a r y 1 9 9 9
A version of this document is published in / Une version de ce document se trouve dans:
Journal of the Illuminating Engineering Society, 28, (1), Winter, pp. 117-129,
February 25, 1999
The material in this document is covered by the provisions of the Copyright Act, by Canadian laws, policies, regulations and international agreements. Such provisions serve to identify the information source and, in specific instances, to prohibit reproduction of materials without written permission. For more information visit http://laws.justice.gc.ca/en/showtdm/cs/C-42
Les renseignements dans ce document sont protégés par la Loi sur le droit d'auteur, par les lois, les politiques et les règlements du Canada et des accords internationaux. Ces dispositions permettent d'identifier la source de l'information et, dans certains cas, d'interdire la copie de documents sans permission écrite. Pour obtenir de plus amples renseignements : http://lois.justice.gc.ca/fr/showtdm/cs/C-42
••••••••••••••••••••••••••••••••••••••••••••••
,
Toward the Accuracy of Lighting Simulations in
Physically Based Computer Graphics Software
Kevin W. Houser (1), Dale K. Tiller, and Ivaldo C. Pasini
117
This project evolved from an interest in validating the accuracy of lighting visualization software tools.Itis rea-sonable to ask if visualization software is numerically
accurate. In fact, it is necessary to answer this question if
software computed luminance values will be used for lighting design, analysis, or research.
This study involved modeling an existing space with two software packages under a variety of different condi-tions, and then comparing the results of the simulations against measured values. The software packages selected were Lightscape and Radiance because they are both "physically based" software, i.e., they purport to compute lighting quantities and represent the results as realisti-cally rendered images. Lightscape and Radiance stand in contrast to the more typical "photorealistic" graphics software, which place emphasis on the appearance of the output rather than on the techniques used to derive it. The computed solutions were compared with luminance
measurements taken using an IQCam, which is a
com-mercially available photometrically calibrated digital
image photometer.6,9.10
A drawback of comparing measured and computed
,
values is that lighting visualization software packages may have different limitations than luminance photometers. A further difficulty is in ensuring that measured areas correspond with the same geometric location as those taken from a rendered image.Software limitations
Perhaps the two most significant limitations of the software are the treatment of material properties and the photometric input. In the case of material properties, the software uses simplifications either to reduce com-putation time or because the additional complexity would yield diminishing returns. It would be most accu-rate to describe material surface properties by specifying the spectral reflectance as a function of wavelength and the directional reflectance using a bi-directional reflectance distribution function (BRDF).
Popular visualization software approximates the
spec-tral reflectance vvith three numbers, one representing
each component of red, green, and blue. The spectral power distribution of a light source is simplified in the same way. Given the current state of computer hardware,
Authors' affiliation:(1)Philips Lighting Company, NatiotUlIResearch Council Canada, and PublicWorksand Government Services Canada, respectively.
it is not practical to specify the spectral reflectance of room surfaces or the spectral power distribution of light
sources as a function of wavelength. Few researchers and
even fewer lighting practitioners have access to computers capable of timely handling the additional complexity.
Radiance will allow a user to specify an arbitrary
BRDF. Nonetheless, directional reflectance is more
commonly approximated with a number of coefficients specific to the type of material. For example, plastics can be assigned coefficients for specularity and roughness while a dielectric material can be assigned an index of refraction and a Hartman constant.Itis not possible to specify an arbitrary BRDF within Lightscape. Instead, Lightscape uses a number of parameters that define a
material, including metal or nonmetal, smoothness,
transparency, and index of refraction.
The differences in how materials are defined are closely related to the different software algOrithms. Radiance is predominantly a ray tracing algorithm; as such it requires little extra computational time to
con-sider a material with an arbitrary BRDF versus say, an
ideallambertian surface. Lightscape is predominantly a radiosity algorithm that initially computes a solution based entirely on diffuse radiative transfer. Lightscape uses the directional material coefficients in a ray tracing post process, i.e., ray tracing is perfonned after the radiosity solution has sufficiently converged.
The photometric limitations are a consequence of the input files themselves rather than a product of the physi-cally based visualization software. Standard fonnat photometry files contain inadequate infonnation about luminaire geometry and are deficient at near field con-ditions. One result is that we can not expect the software to automatically model luminaire geometry or to accu-rately calculate the luminance distributlon in the near vicinity of the luminaires. Photometric files containing only a few planes of horizontal data or data at large ver-tical angular increments could also lead to numerically and/or visually inaccurate simulations. In these cases the software is not entirely at fault.
Measurement limitations
As with all photometers, the IQCam digital photo-meter is subject to a number oflimitations. One example is that the response of the photometer is not exactly the same as the response of the human eye. This deviation of relative spectral responsiveness from the V(,-) function
118
••••••••••••••••••••••••••••••••••••••••••••••
,
Image alignment
Image alignment involves lining up corresponding pixels in separately derived images. The objective, though practically unattainable, is to align images so that all corresponding pixels in separately generated images represent the same point or area of geometric space.
Possible misalignments between images include verti-cal or horizontal translation, rotation, and! or optiverti-cal distortions. Pixel misalignments could be globalor local. Global misalignments are typically the result of diffe-rences in camera position and!or viewing direction within a scene. Local misalignment can result from different placement of objects within corresponding scenes, and are additive with global misalignments. Optical distor-tions can result in both global and local misalignments. When misalignment occurs, corresponding image pixels do not represent the same geometric location.
The resolution of IQCam, Lightscape, and Radiance images could not be made to match precisely. IQCam images have a fixed resolution of 496 x 288 pixels and a fixed aspect ratio of 1.33:1 (thus individual pixels have a fixed aspect ratio of 1.2949:1). Lightscape renders images using square pixels. Thus, perfect alignment between an IQCam and Lightscape image was not
can be characterized using the error £1" Measurement
error could also result from a number of other factors, including the meter's UV response, IR response, direc-tional response, temperature dependence, stray light, and the dark current signal within the electronics of the meter. The reader is referred to CIE #69 for a more com-plete treatment of the issues related to characterizing the performance of luminance meters.' Operative characte-ristics specific to digital photometers have also been
dis-cussedelsewhere.s,1O
Because of the software limitations given above, we
would expect the calculated luminance distribution to differ from the true values. And because of the short-comings of the IQCam, or any other photometer, we would expect that the measured values are really not the true values of luminance either.Itfollows that one of the fundamental obstacles in validating software (and IQCam measurements), is that the true value of lumi-nance will always be unknown. These limitations make it difficult to perform comparisons in absolute terms; but they do not prohibit relative comparisons.
In consideration of the above, the first objective of this project was to determineifluminance images produced by Lightscape, Radiance, and an IQCam are the same or different. For the reasons given above, it was expected that the different technologies would produce different results. Therefore, the further and more significant objective was to gain insight into how and to what magni-tude the separately derived images differe9.
Winter 1999 JOURNAL of the liluminating Engineering Society
possible without a transformation. Radiance includes an image filtering utility for scaling images and scaling the aspect ratio of pixels. For this project, Radiance images
were rendered at the same resolution and aspect ratio as
the Lightscape images. Using square pixels, a resolution of 496 x 373 was chosen for the rendered images. With this resolution and 1:1 pixel aspect ratio, the image extents most closely match those of the IQCam.
For good image alignment, it was also important for each of the separately derived images to subtend the same horizontal and vertical angles. The field of view of an IQCam image is dependent upon the choice of lens. A wide angle lens (4.2 mm focal length, fixed focus) was chosen to captures a 56 degree horizontal by 42 degree vertical field of view. The field of view angles specified within the software did not correspond with each other or with the IQCam lens attributes. Therefore, the hori-zontal and vertical angles were chosen within the soft-ware so that the boundaries of the rendered images would visually match each other and the IQCam images. Also crucial for global image alignment was to main-tain the same viewing position and viewing direction across all images. Within the software, it was easy to specify a viewing position and viewing direction. The practical difficulty was in physically positioning the IQCam at the same point, and aimed along the same vector, as was designated within the software. The degree of success was limited only by the ability to physically position the IQCam at the proper position and aimed along the correct vector. Refer to Table 2 for a summary of the physical characteristics of each image type.
Finally, because the IQCam is a physical imaging
device, optical distortions were present in the measured
images. Within the limits of this project, neither software rendered optical distortions. Thus, misalignments between corresponding rendered and measured images were present due to optical distortions. During the data collection process, the above items were carefully consi-dered in an effort to reduce misalignment and the asso-ciated experimental noise. Still, a statistical method was developed to analyze the degree of success of image alignment. The quality of image alignment has been characterized by perfonning separate statistical analyses utilizing random samples of different size pixel areas. This concept is further expanded in the ensuing sections. Methodology
Scenes chosen for comparisons
Twenty-four images of varying degrees of complexity were chosentocompare the software and IQCam under different conditions. There were eight images rendered by Radiance, eight images rendered by Lightscape, and eight images measured with an IQCam. Each set of eight images constitutes all combinations of four different
••••••••••••••••••••••••••••••••••••••••••••••
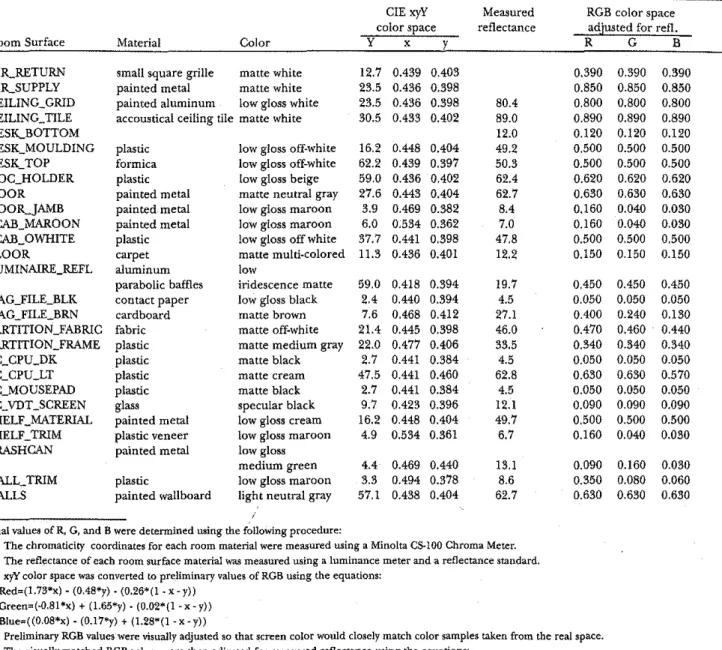
Table I-Room surface material properties.
CIE xyY Measured RGB color space color space reflectance adjusted for refl.
Room Surface Material Color Y x y R G B
AIR_RETURN small square grille matte white 12.7 0.439 0.403 0.390 0.390 0.390 AIR-SUPPLY painted metal matte white 23.5 0.436 0.398 0.850 0.850 0.850 CEILING_GRID painted aluminum low gloss white 23.5 0.436 0.398 80.4 0.800 0.800 0.800 CEILING_TILE accoustical ceiling tile matte white 30.5 0.433 0.402 89.0 0.890 0.890 0.890
DESK".BOTTOM 12.0 0.120 0.120 0.120
DESK_MOULDING plastic low gloss off-white 16.2 0.448 0.404 49.2 0.500 0.500 0.500 DESK_TOP formica low gloss off-white 62.2 0.439 0.397 50.3 0.500 0.500 0.500 DOC_HOLDER plastic low gloss beige 59.0 0.436 0.402 62.4 0.620 0.620 0.620
DOOR painted metal matte neutral gray 27.6 0.443 0.404 62.7 0.630 0.630 0.630
DOOR-JAMB painted metal low gloss maroon 3.9 0.469 0.382 8.4 0.160 0.040 0.030 FCAB_MAROON painted metal low gloss maroon 6.0 0.534 0.362 7.0 0.160 0.040 0.030 FCAB_OWHITE plastic low gloss off white 37.7 0.441 0.398 47.8 0.500 0.500 0.500 FLOOR carpet matte multi-colored II.3 0.436 0.401 12.2 0.150 0.150 0.150 LUMINAlRE_REFL aluminum low
parabolic baffles iridescence matte 59.0 0.418 0.394 19.7 0.450 0.450 0.450
MAG_FILE_BLK con tact paper low gloss black 2.4 0.440 0.394 4.5 0.050 0.050 0.050 MAG]ILE_BRN cardboard matte brown 7.6 0.468 0.412 27.1 OAOO 0.240 0.130 PARTITION_FABRIC fabric matte off-white 21.4 0.445 0.398 46.0 0.470 0.460 0.440 PARTITION]RAME plastic matte medium gray 22.0 0.477 0.406 33.5 0.340 0.340 0.340
PC_CPU_DK plastic matte black 2.7 0.441 0.384 4.5 0.050 0.050 0.050
PC_CPU_LT plastic matte cream 47.5 0.441 0.460 62.8 0.630 0.630 0.570 PC_MOUSEPAD plastic matte black 2.7 0.441 0.384 4.5 0.050 0.050 0.050 PC3DT_SCREEN glass specular black 9.7 0.423 0.396 12.1 0.090 0.090 0.090 SHELF_MATERIAL painted metal low gloss cream 16.2 0.448 0.404 49.7 0.500 0.500 0.500 SHELF3RIM plastic veneer low gloss maroon 4.9 0.534 0.361 6.7 0.160 0.040 0.030 TRASHCAN painted metal low gloss
medium green 4.4 0.469 0.440 13.1 0.090 0.160 0.030
WALL_TRIM plastic low gloss maroon 3.3 0.494 0.378 8.6 0.350 0.080 0.060 WALLS painted wallboard light neutral gray 57.1 0.438 0.404 62.7 0.630 0.630 0.630
Final values of R, G, and B were determined ll.'Jing the following procedure:
(1) The chromaticity coordinates for each room material were meallured ll.'Jing a Minolta C$-lOO Chroma Meter.
(2) The reflectance of each room surface materialwas measured using a luminance meterand areflectance standard.
(3) xyY color space was converted to preliminary values of RGB using the equations:
A.Red=(1.73*x) - (0.48*y) - (0.26*(1-x-y»
B. Green=(-0.81 "'x) + (1.65"'y) - (0.02*(1 - x - y»
C. Blue=«O.08*x) - (0.17*y)+(1.28*{l - x· y»
(4) Preliminary RGB values were visually adjusted so that screen color would closely match color samples taken from the real space. (5) The visually matched RCB values were then adjusted for measured reflectance using the equations:
A Red-,corrected=(Re<Lunc)*«refl/lOO)*«O.265*Red_unc) + (O.67*Green_unc) + (O.065*Blue_unc») B. GreelLcorrected=(Green_unc)*( (refl/IOO)*( (O.265*Red_unc) + (O.67*Green_unc) + (O.065*Blue_unc»)
C. Blue_corrected=(Blue_unc)*«refl/100)*«0.265*Red_unc)+,(O.67*Green_unc)+(0.065*Blue unc»))
119
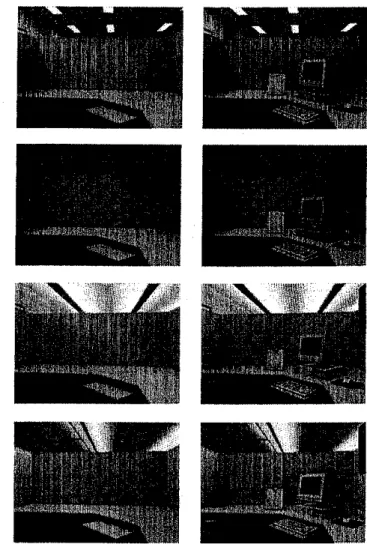
luminaires and two degrees of scene complexity. An
experimental design matrix is given asFigure 1, which also provides a snapshot of the chosen view. The same viewpoint and viewing directionwasused for all images; itwaschosen to be a typical scene from a sitting position within a cubicle of a partitioned open office. Figure 1
implies several degrees of compleXity which were deriva" tives of the following two assumptions:
1. A complex scene with complex geometry is more difficult to render than a simple scene with simple geometry.
2. Luminaires with an indirect component are more
difficult to render accurately that completely direct
luminaires.
Itwas also expected to be more difficult to perfonn comparisons on geometrically complex scenes because image alignment becomes more difficult with scene com" plexity.As it turned out, the data did not provide com-pelling support for these assumptions. These issues are further discussed later in this paper.
The renderings are of an existing research space at the National Research Council in Canada. One reason this spacewaschosen was because alternate lighting sys-tems could be easily interchanged, and thus easily
mea-sured. Further, the room was quite generic in material
finishes and furniture layout. The major room material properties are given in Table 1.
IQCam Lightscape Radiance
••••••••••••••••••••••••••••••••••••••••••••••
paper, a tape measure, and tracings. Once the items of interest were measured and documented, the objects were
built as 3D models using AutoCAD release 12 for DOS. The floor, a ceiling plane, walls, and partitions were also measured and modeled from scratch. All items were loca-ted within the CAD model at the same coordinates as the corresponding real items from the existing environment.
The next step in the rendering processwas to assign
material properties to all surfaces in the scene to be
rendered. With some rendering packages this can occur within the CAD software, yet in this project the materials were defined within the rendering software. Since Lightscape and Radiance purport to be physically based, physical measurements were required to aid in the accu-rate specification of material properties within the soft-ware. A Minolta C5-100 Chroma Meterwas used to mea-sure chromaticity coordinates (xyY);and the reflectance
of each surface was measured using a reflectance ウエ。ョセ
dard and luminance meter. The Minolta C5-100 Chroma Meter had a one degree aperture and was factory cali-brated and used for less than 30 min prior to this project. Even with these measured physical properties, it proved to be a very difficult task to accurately specify the material properties within the software. It is quite diffi-cult to define materials so that the surfaces both look realistic and interact with light as they would in the real
environment. This issue is discussed in moredetail later in this paper.
At this step in the rendering process the surfaces had been physically located and their reflectance properties had been defined both chromatically and directionally. The next step in the processwas to specify the photo-metric properties of the light sources that would be light-ing the environment. IES standard format photometry files were obtained from Litecontrol and CFI for use as photometric input. In all scenes, a candlepower multi-plier of 0.80 was applied to account for lamp lumen depreciation, ballast factor, and degradation of
lumi-naire efficiency since their initial installation.
Table 2-Summary of image characteristics for the IQCam, Lightscape, and Radiance.
Resolution 496 x 288 496 x 373 496 x 373
Image aspect ratio 4:3 (1.33:1) 4:3 (1.33:1) 4:3(1.33:1)
Pixel aspect ratio 1.2949: 1 1: 1 1: 1
Hor. angle subtended 560 580 600
Vert. angle subtended 420
not specified1 45.750 Cameralocation2 (2323,4225.1110) (2323,4225,1110) (2323,4225.1110) Aiming point' (4686,4451.5,1110) (4686,4451.5.1110) (4686,4451.5.1110) Viewing vector (2363.226.5,0) (2363,226.5.0) (2363,226.5,0)
1. Since Lightscape uses only square pixels, the vertical angle is automatically determined by the horizontal angle and the desired resolution.
2. Coordinates are given in millimeters from the global origin within the computer model.
120
Figure I-Experimental design matrix. Each cell is representative ofthree· images:a,measured image from an IQCam and rendered images from Lightscape and Radiance.
Rendered image generation
The first stepinthe rendering process involved deve-loping a three-dimensional (3D) model of the scene to be rendered. Tools for generating 3D models include CAD systems, 3D scanners and digitizers, existing 3D model libraries, or text editors." The fastest way to develop a scene is by using existing libraries
of 3D objects. This method was not possible for this project, since the renderings would be compared withan existing scene; in order to
match existing furnishings, it was necessary to generate all geometry from scratch.
Itfollows that the first step in the model generation process was to copiously record the dimensions of all the objects that would be included in the rendered scene. This processwas performed manu-ally using a pencil, sketches, graph
•
•••••••••••••••••••••••••••••••••••••••••••••
121
Luminance measurement
Luminance measurements were taken using an IQCam digital scene photometer and a Minolta CS-lOO Chroma Meter. All measurements were conducted by
Figw-e 2-Scatter plot of the measured Iwninance values along with a linear regression line. Each data point represents the lumi-nance measurement obtained from theIQCam system (horizontal
axis)and that obtained from the Minolta CS.l00 (vertical axis) for a single location in a given scene.
one of the authors (KH) at Building M24 of the NRC/IRC Montreal Road campus in Ottawa, Ontario. The luminance measurements were taken dUring the month of October 1996 in the following order: (1) para-bolic luminaires, furnished cubicle; (2) parapara-bolic lumi-naires, empty cubicle; (3) lensed lumilumi-naires, empty cubi-cle; (4) lensed luminaires, furnished cubicubi-cle; (5) pen-dant mounted indirect luminaires, furnished cubicle; (6) pendant mounted indirect luminaires, empty cubi-cle; (7) pendant mounted clirect/indirect luminaires, empty cubicle; and (8) pendant mounted direct/indi-rect luminaires, furnished cubicle.
The measurements for each luminaire were taken on the same day during the same session. Thus, measure-ments were taken on four separate days. A few days elapsed between measurement sessions, during which time the lighting system was changed over to the next in the series.
Before recording measurements, the lamps were allowed towarmup for no less than one hour to permit stabilization. Fluorescent T8 sources with a color tem-perature of 3500K were used throughout. During the warm up time the items in the cubicle were carefully positioned at the same locations as designated within Lightscape and Radiance. The IQCam photometer was carefully located on a tripod at a point in space corre-sponding to the location of the virtual camera within the rendering software. The IQCam scene capture proce-dure followed the instructions in Chapter 3 of the IQCam users gnide.'
Immecliately following the IQCam scene capture, a series of measurements was taken using a Minolta CS-lOO Chroma Meter. The purpose of taking measurements with a second luminance meter was to authenticate the IQCam data. For the points that were measured as part of this project, the two meters reported luminance values that were not statistically different. Fignre 2 shows a scat-ter plot of the recorded values along with a linear regres-sion line. For the interested reader, detailed results of the comparison between the twn luminance meters have been reported elsewhere.lO
Data preparation
Statistical sampling and pixel areas
For reasons previously identified, corresponding pix-els in corresponding images may not always represent the same area in geometric space. Given this, it was nec-essary to develop a method for comparing images that addressed this reality. The basic concept of the method developed involved performing the image comparisons using means of pixel areas. In other words, predefined areas of pixels were averaged and the means of these pixel areas were treated as single observations. A repre-sentative number (100) of pixel areas was averaged, and
.' 9) 100 ax) 10CamReading(cdlm"2) .'
.-.' •"'.
"
10'"
lッァ。イHGイI]M\ャQRKQョセ W1ere:Y=Mrdta,X=lCOJn R-Sq=0.979 omI
100) OX> セ ;mj
100'"
8
セ
'"
10セ
"
::;; 20Once the geometry, materials, and photometry had been set, the model was physically prepared for render-ing. The remaining step was to set the processing para-meters. As a general rule, the quality of the image and the rendering time will increase as the processing para-meters become more rigid. However, since this is not always the case setting the process parameters can be quite a tricky endeavor. It is also important to recognize that setting the parameters too rigorously will generally exhaust system resources. A number ofiterative trial runs were necessary to fine tune the geometry" material speci-fications, and processing parameters.
To help ensure that the software was appropriately uti-lized, the software developers were asked to review the computer models. The process parameter settings in the Radiance models were reviewed and approved by
Gregory Ward of Lawrence Berkeley National
Laboratory; Filippo Tampieri of Lightscape reviewed and approved the process parameter settings in the Lightscape models. For this study, the computed lumi-nance at each pixel was just as important as the 1>ictorial representation. Therefore, the final step requiredwas to run a utility program on the final solutions that wrote the computed luminance values of each pixel to an ASCII text file. The Radiance subprogramPVALUE was used to extract luminance values from the Radiance images. The commercial version ofUghtscape does not include a util-ity for extracting the luminance values on a pixel by pixel basis. Lightscape Technologies wrote and provided the utility LSRAYF for use in this project.
122
••••••••••••••••••••••••••••••••••••••••••••••
I. Small pixel area: 9 x 9 pixel area for rendered images, 9 x 7 pixel area for IQCam images. 2. Medium pixel area: 15 x 15 pixel area for rendered images, 15 x 11 pixel area for IQCam images. 3. Large pixel area: 25 x 25 pixel area for rendered images, 25 x 19 pixel area for IQCam images.
100 samples of 625 pixels each -33.8% of total image pixels 100 samples of 475 pixels each "'33.3% of total image pixels
Large pixel area3
100 samples of 165 pixels each =11.6%of total image pixels 100 samples of 225 pixels each =12.9% of total image pixels 100 samples of 63 pixels each ",4.4% of total image pixels 100 samples of 81 pixels each ""4.4% of total image pixels
Small pixel areal Medium pixel area2
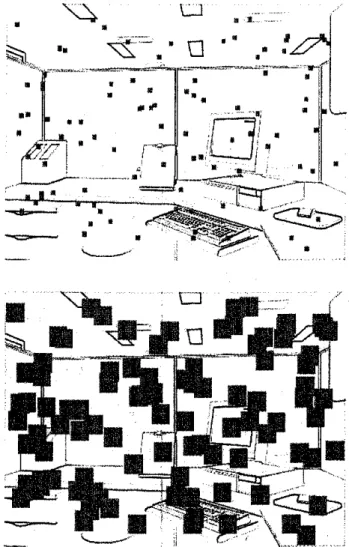
were transposed to the proper image location. Once selected, the same set of one hundred pixels was repea-tedly used as the center points for all sets of observations. The second step was to use these 100 pixels as the seeds for generating the observations that were used for analysis.
Three separate sets of, observations were generated for
each image, they were different in the pixel sample size used to generate the observations. The three pixel sample sizes chosen for the Iightscape and Radiance images are 9 x 9, 15 x 15, and 25 x 25. Different pixel areas were used for the IQCam images since the resolution and pixel aspect ratio differs from the rendered images. Array sizes of9 x 7,15 x 11, and 25 x 19 were used since theyapprox-imately correspond to the same image area. Taking into account all of the above, there were a total of 72 sets of observations (3 types of images x 2 degrees of scene com-plexity x 4 luminaires x 3 pixel areas=72 sets of observa-tions). A pictorial representation of the small and large pixel areas selected is given in Figure 3. Refer to Table 3 for additional summary information.
A FORTRAN program was written to automate the process described above. In brief, the program asks what type of image is being sampled, reads in the luminance
values for the entire image, computes the mean for the three pixel areas centered at each seed, and then writes
the output to an ASCII text file. The output files were
written in a format suitable for direct importation into
Minitab, which was the statistical software package used for the data analysis.
Itwas hoped that by using means of different pixel areas as observations for the statistical analyses it would be possible to gain insight into the magnitude of the
errors introduced by certain sources of experimental noise, specifically image misalignment and differences in
geometry. This method allowed the authors to help isolate differences attributable to differences between Lightscape, Radiance, and an IQCam.
•
o•
,
o 0 o o •. o0Lightscape and Radiance images
Table 3-Image sample summary information.
BセMセNBGセNGMNMセ o 000
o
o 0,. ,O!,
II ,'''."
I
•
o•
othe resulting sample of means was used as observations for statistical analyses,
The sampling method was a two step process, The first step involved randomly selecting 100 pixels, Since the location of each pixel could be identified by its (i,j) coor-dinate randomly selecting
100 pixels required the ran-dom selection of 100 pairs of (i, j) coordinates. The
coordinate pairs were
cho-sen based on the resolution of the rendered images (Le., 496 x 373). The i
coor-dinates were selected as ran· IQCam images
dam integers between 13 and 360 and the j
coordi-nates were selected as
ran-dom integer between 13 and 483. Since the IQCam image has a resolution of 496 x 288, the i coordinates
Figure 3-Location of the one hundred randomly sampled pixel areas. The seeds are located at the center of each square.
••••••••••••••••••••••••••••••••••••••••••••••
,
123
Winter1999
JOURNAL of the illuminating Engineering Society
tional photograph for the scene with the lensed troffer and furnished cubicle. Unfortunately, black and white reproduc-tions are only useful for evaluating some
visual comparisons. The interested reader
is encouraged to contact the author (KH) for the full color electronic versions of the
images.
Specific visual differences between Lightscape, Radiance, and the real space are listed:
1. Overall, the Radiance images appear to be grayer (less saturated color) than cor-responding Lightscape images. It is unknown why this is the case since RGB reflectancewasidenticalIy defined in both software packages. Apparently RGB means something slightly different to the two ren-dering engines.
2. The desktop is somewhat more spec-ular in the Lightscape model than in the Radiance model. Compared to the real space, it appears that neither the Lightscape nor the Radiance desktop was defined with enough specularity. By visual inspection alone, it is thought that the Lightscape desktop has been defined slightly more accurately than the Radiance desktop.
(Comments regarding items 1 and 2: In both Lightscape and Radiance, the spectral nature of reflectance was defined with identical coefficients for RGB reflectance.Itwasnot possible to use the same coef-ficients for the directional nature of reflectance since they are specified differently in the two software pac-kages. This resulted in a number of inevitable differences between how the Lightscape and Radiance materials were defined. For example, most surfaces were assigned the material plastic, which is a material with uncolored highlights. In Radiance, a plasticis defined by its RGB reflectance, its fraction of specularity, and its roughness value." In Lightscape, a plastic is defined by its RGB
reflectance, smoothness coefficient, transparency coeffi-cient, and index of refraction.7Since the materials were
defined using different coefficients, the parameters were fine tuned through an iterative process of trial and error. The parameters were chosen in an effort to make the rendered images look both like each other and like the
real environment.
Setting material properties (RGB reflectance, speen-larity, roughness, etc.) is a very difficult task for the
soft-ware user. If an illumination engineer has a device to
measure color, it is probably one that measures CIE
chromaticity c90rdinates. More comprehensivemea-'
surements could be taken using a spectra-radiometer. Practically speaking however, most lighting practitioners
IQCamimagebitmap. Conventional photogmphy.
Figure 4-Black and white reproductions of the rendered images, an IQCam bitmap, and a conventional photograph for the scene with the lensed troffer and furnished cubicle.
Visual comparisons
Figure 4 provides black and white reproductions of the rendered images, an IQCam bitmap, and a
conven-Results
The underlying reason for this projectwasto qualIta-tively and quantitaqualIta-tively compare the rendered images with each other, with the IQCam measurements, and with the real space. In essence, there are two ways to assess the quality and accuracy of the renderings. The first method is visual inspection; directly,comparing the simulations with each other and with the real space is the most intuitive way to judge visual similarities and differ-ences. Visual inspection can be useful for qualitatively assessing how well material properties (e.g., color and specularity) had been defined and rendered, the accuracy of shadows and penumbras, similarities and differences in geometry, and image alignment.
The second way to assess the quality of the renderings is to analyze the luminance values computed by the soft-ware. This is a distinctly different task than visual inspec-tions-it is possible for an image to look quite realistic yet have computed values that are inaccurate. The appearance of an image is highly dependent upon the visual display hardware, including the monitor contrast, brightness, and gamma. Moreover, itisdifficult to visually compare a self luminous image with one that is only reflecting light. Consequently, visual inspection is not suitable fOr evaluating the absolute accuracy of com-puted values of luminance-an unbiased purely nume-rical method is required.
124
do not have access to these expensive devices. Within the software, the most common way to specify a material color is with RGB reflectance. There are alleged func-tional equations that purport to convert between RGB color space and CIE color space. The authors have not found these equations to be accurate; in other words, when using these equations the displayed RGB colorwas
not a satisfactory visual match to the measuredxyY sur-face from the real space.
Since the softwareisintended to be physically based, it seems reasonable that it should be possible to define material color using physically based metrics, rather than specifying color in a language created for visual displays.
Itwould be convenient if the software permitted the user to specify color in either RGB or CIExyYcolor space.It
is the authors' opinion that it would be simplertospecify material colors in CIE color space.)
3. The Lightscape computer screen was modeled as a faceted 3D surface, and each surface was defined as being perfectly specular. In Radiance, the computer screenwas modeled as a true curve (part of a sphere) and was assigned a small amount of roughness. These modeling differences resulted in visual differences between corresponding pairs of rendered images. For example, the computer screen in the イ。ケセエイ。」・、
Lightscape images shows a more pronounced reflected image of the luminaire than corresponding Radiance images. This is espeCially apparent for the scenes with the lensed troffer.
Further, the monitor itself appears to have been tilted back more in the real space than in the rendered images. This difference in geometry resulted in a larger reflected glare spot in the photograph and IQCam image when compared with either of the rendered images.
4. One of the Lightscape images has a blue cast to it-the rendering of the empty cubicle with the pendant mounted linear indirect luminaire. Ian Ashdown of Ledalite shared a similar experience he had when writing his own radiosity renderer. The CH code in his algo-rithm was correct, and yet he too would occasionally get a blue cast to the images. The problem he encountered
was that the Microsoft C++ compiler was generating incorrect machine code that caused the program to read the wrong registers during a floating-point calculation. The image would most often be rendered properly but on occasion it would be rendered with a blue cast-it was dependent on the previous state of the register. While a plausible explanation, it is unknown if the problem encountered with this particular Lightscape image is for the same reason.
5. The shadow across the partition in the Lightscape images using the pendant mounted linear direct/indi-rect luminaire appears to be incordirect/indi-rectly rendered. The shadow boundary is quite distinct in the Lightscape
••••••••••••••••••••••••••••••••••••••••••••••
image; this sharp Shadow does not appear in photo-graphs, IQCam images, or Radiance images of the same scenes.
6. The parabolic louvers do not appear as they would in the real environment in either Lightscape or Radiance. Ironically, while both software packages are quite good at approximating the appearance of illumi-nated surfaces, they are comparatively inferior at repre-senting the appearance ofluminaire openings.
7. The gradient on the ceiling from the luminaires with an indirect component is different when comparing corresponding Radiance and Lightscape images. The gradient appears softer and smoother in the Lightscape images versus the gradient in the Radiance images. This may be a consequence of the fact that Radiance com-putes the final RGB values for each pixel without regard to adjacent pixels, while Lightscape utilizes gourard shading.2In both cases, the software is bounded by the
dynamic range of the computer monitor; which is 」ッョセ
siderably smaller than the dynamic range of the real scene; for this reason neither Radiance nor Lightscape are exemplary at realistically rendering the gradient on an indirectly lighted ceiling.
8. Since Radiance and Lightscape render based upon a virtual camera, their images have no optical distortions. Conversely, since the IQCamisa physical device with a real lens, IQCam images are optically distorted. This fact inevitably resultedinsome degree of image misallgnment. 9. The door is in a different location in the rendered images. It is unknown why this occurred because the geometry for both models was identical. More impor-tantly, the door does not appear in the IQCam image.
10. The second row of luminaires can be seen in their entirety in the rendered images, but are cut off by the partition in the IQCam image.
(Comments regarding items 9 and 10: These items suggest that the virtual camera within the computer models was located higher than the IQCamwasmounted in the real space. This difference in mounting location contributed to noise within the data.)
Statistical comparisons, image alignment
Individual ANOVAs revealed that pixel sample size wasnever a significant factor in the comparison of mean luminance (alpha" 0.05). This fact alone is a strong indi-cation that image alignmentwasquite good. Main effects plots further indicated that in the context of this study, the technology used to obtain the luminance values had a considerably larger effect on mean luminance than pixel sample size.'
Edwards' test statistic for the homogeneity of the COrre-lation coefficient across pixel sample sizewasalso used for evaluating image alignment.'" Twenty-four test statistics were computed and have been summarized in Table 5. As
,
セN
••••••••••••••••••••••••••••••••••••••••••••••
125
Table 5-Test of the homogeneity of the correlation coefficient across pixel sample size.
Values in the above table are the test statistic for testing the homogeneity-ofk values ofrY With three
pixel sample sizes the number of degrees of freedom for evaluatning the chi-squaredtest static is two.
Entering chi"squared tablewithtwodegrees of freedom, the critical value is 5.992 at alpha = 0.05. The null
hypothesis that the correlation coefficients arefromthe same populationwillbe rejected for test statistics
greater than the critical value. Litecontrol
indirect/direct Litecontrol indirect pendant
11.856
Lightscape Radiance Lightscape Radiance
0.317 Radiance 0.366
4.066 21.419 IQCam 2.689
Simple scene geometry Complex scene geometry
correlation coefficients is not substantive.
There are still a number of other ways to gain insight into the quality of image alignment. The mean and stan-dard error of the correlation coefficients are presented for each pixel sample size in Figure 5. Although there is not a formal test statistic associated with this figure, it is clear at a glance that the mean and standard error of the correlation coefficients are highly similar at the different pixel sample sizes. Still another way to assess the quality of image alignment is by observing the plots of the cor-relation coefficient by pixel sample size for each of the eight scenes:" In some cases the correlation coefficient will increase with pixel sample size, in other cases the cor-relation coefficient will decrease with pixel sample size, and in some cases there is no change. This suggests that the small differences that are present are likely resulting from random error rather than from a systematic bias.
Each of these items separately suggests that image alignmentwas quite good. Taken together, it seems rea-sonable to conclude that pixel sample size did not result in substantive differences in the results of the compari-sons. This important result lends credibility to the remainder of the analyses. Because image alignmentwas quite good, the differences found among the three tech-nologies can be attributed to differences in the technolo-gies rather than to shortcomings in the analysis itself. Statistical comparisons, mean luminance
In six of the eight scenes, ANaVA revealed a statisti-cally significant difference between mean luminance (at alpha::; 0.05). The exceptions are the two scenes with the indirect pendant luminaire; where ANaVA did not
IQCam Radiance
Lightscape Radiance Lightscape Radiance
Radiance 2.741 Radiance 8.335
IQCam 0.580 0.444 IQCam 3.357 3.707
Lightscape Radiance Lightscape Radiance
Radiance 33.671 Radiance 38.627
IQCam 3.561 0.580 IQCam 2.668 0.815
Lightscape Radiance Lightscape Radiance
Radiance 1.026 Radiance 6.249 IQCam 0.833 0.543 IQCam 0.310 0.620 CFI flourescent 1 x 4ftdirect lensed 1.0
I
0.9II
I
III
I
J: 0.8I
-j
0.7...
--0.8
...
セ ...icdャゥャ。セcX Il5SYEII Medlm Lags
PboaI
SmlPe
SizeFigure 5-Correlation summaryby pixel sample size.
shown in this table, therewas not a statistically significant difference in 18 of the 24 cases. At first glance this may seem to indicate that pixel sample size did in fuct have a significant effect on the correlation-at least in six of the twenty-four instances. However, the statistical significance is in part an artifact of how the test statistic is computed; in this case the statistically significant differences do not translate to substantive differences.
The computation of Edward's test statistic is such that it is considerably more restrictive when the correlations being compared are very high. For example, the correla-tions between Ughtscape and Radiance for the scene with the parabolic troffer and furnished cubicle are 0.975,0.984, and 0.989 for the small, mec\ium, and large pixel sample sizes, respectively. With a sample size oflOO, the test statistic is 8.33 and null hypothesis that these correlation coefficients come
from the same population is re-jected--even though there is not a substantive difference between the three values. Further, the corre-lation coefficients between the IQCam and Ughtscape for the
scene with the pendant mounted CFI flourescent.,
linear indirect luminaire and fur- 1x4 ft direct parabolic
nished cubicle are 0.824, 0.854, and 0.886 for the small, medium, and large pixel sample sizes, respectively. With a sample size of 100, the test statistic is 2.67 and the null hypothesis that these cor-relation coefficients come from the same populations is not rejec-ted--even though the range of these correlations is considerably larger than in the previous exam-ple (0.062 vs. 0.014). In both cases, the difference between the
126
••••••••••••••••••••••••••••••••••••••••••••••
Table 4-Statistical summary of ANOVA, multiple comparisons, and homogeneity of variance.
Homog.
Analysis of variance! Multiple comparisons2 of variance'
Method Pixel Interaction IQCam/LVS IQCam/Rad. LVS/Rad. Levene's test sample size Lensed troffer, empty cubicle ,/
*
*
,/ ,/*
*
Lensed troffer, furnished cubicle ,/ ,/*
,/ ,/•
•
Parabolic troffer, furnished cubicle ,/•
•
,/ ,/*
,/ Pendant indirect, empty cubicle ,/*
•
,/ ,/•
,/ Pendant indirect, furnished cublicle*
*
•
•
•
•
*
Pendant indirect, empty cubicle*
•
•
*
*
*
•
Pendant direct/indirect, empty cubicle ,/•
•
,/ ,/•
•
Pendant direct/indirect, furnished cubicle ,/•
•
,/ ,/•
*
1. Null Hypothesis (HO): Factor level means are equivalent. HOhas been rejected for p-values less than 0.05 (alpha:s 0.05).
2. HO: No difference between mean values ofluminance. HO has been rejected where zero is not contained in the confidence interval (alpha S 0.05). 3. HO: No difference between population variance. HOhas been rejected for p-values less than 0.05 (alpha:;; 0.05),
'*Not significant (fail to reject null hypothesis).
II' Significant (reject null hypothesis).
Statistical comparisons, homogeneity of variance
The purpose for testing homogeneity of variancewas
to fonnally compare the dispersion ofluminance values
in corresponding scenes. Levene's test statisticwas
cho-result in a statistically Significant difference between mean luminance. The multiple comparisons provide
further insight into where the differences were ッ」」オイセ
ring. For the same set of six scenes. the null hypothesis of
no difference between mean luminance is rejected for
both the IQCam image versus the Radiance image and the IQCam image versus the Lightscape image. Conversely, the null hypothesis is not rejected for Lightscape versus Radiance.
The null hypothesis is not rejected for any of the paired comparisons for the two scenes with the indirect pendant luminaire. In other words, the data does not suggest that Radiance, Lightscape. and the IQCam arrive at a different value of mean luminance for the two scenes with the indirect pendants. These results have very significant substantive implications. The data suggests quite strongly that in six of the eight scenes, the mean luminance is both statistically and substantively different when comparing the measurements with the computer renderings. Equally interesting is that the mean lmni-nance between Lightscape and Radiance is neither sta-tistically nor substantively different in any of the eight
scenes.
Wmter 1999 JOURNALof theilluminating EngineeringSociety
sen because it is appropriate for continuous data and is robust against the assumption of nonnality. In six of the eight scenes, the null hypothesis of no difference between population variance was not rejected (alpha" 0.05). The null hypothesiswasrejected for the two scenes with the parabolic troffer. Stated another way. for the scenes with parabolic troffers the confidence interval for the standard deviation (cr) wasnarrower for the IQCam than for the rendered images. Refer to Table 4 for a smnmaryof the results from the ANOVAs, multiple
compari-SOlls,and homogeneity of variance tests.
Statistical comparisons, correlation
Because it was difficult to know how many lumens were actually exiting the luminaires versus what was
reported in the manufacturers' photometry files. itwas
thought that the correlation analysis might provide a better indication of how well the software compared with measured values. The correlation analysiswasperfonned as a way to compare the luminance distributions-this stands in contrast to the previously discussed analyses which were perfonned largely to assess mean luminance
and the quality of image alignment. .
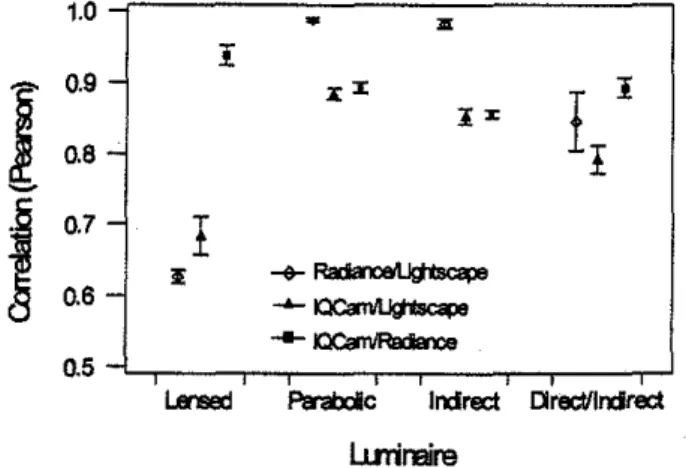
Plots of the correlation coefficients have been sum-marized as Figures 5-7-these plots contain an abun-dance of noteworthy elements.
Referring to these plots, observe that the correlation between Lightscape and Radiance has a considerable
•
•••••••••••••••••••••••••••••••••••••••••••••
1.0•
'"
IJ
0.9 - XXII
I I" 0.6 -' セj
0.7 -I
I: MKMセ 0.6 -...
セ ... IClQrnIRalla1ce 0.5Lensed PlrabcIIc Inclrect rll'llClllnclrect
I..uTil1lire Figure 6-Correlation swnmarybyluminaire type.
range; this is manifested as comparatively long error bars. The fact that the overall mean correlation between Lightscape and Radiance is 0.861 indicates that the com-puted distributions between the two software packages are generally agreeable. However, the comparatively large range of correlation coefficients indicates that the agreement is quite dependent upon the scenes being compared. Inspection of the correlation coefficients
shows that in the worst case (lensed troffer, simple scene,
medium pixel sample size) the correlation between the rendered images in just 0.601 while in the best case (indi-rect pendant, simple scene, large pixel sample size) the correlation is 0.997. Tbis suggests that in some instances Radiance and Lightscape may compute nearly identical luminance distributions while in other ibstances they may distribute the available lumens very differently.
The mean and standard error bars on the plot in Figures 5-7 have considerable practical implications. It is clear from this plot that on average, and within the context of this project, the correlation between Radiance and the IQCam is higher than the correlation between Lightscape and the IQCam.
1.0
I
0.9 -I
III
I 0.6 -I
セj
0.7 -MKMセ 0.6 -...
セ ... IQCa1lIRacIa'lc 0.5-L...,.----,....--,---r---'
Figure 7-Correlation summarybyscene complexity.
127
Figure 6 is a correlation summary by luminaire types. This figure demonstrates that different photometry affected the different technologies in different ways.
There is not a clear-cut reason why the correlations were
so low for the scenes with the lensed troffer and so high for the scenes with the parabolic troffer and indirect pendant. The data suggests that the technologies will perform differently from each other in different
photo-metric situations.
Figure 7 is a correlation summary by scene complexi-ty. This figure demonstrates that, within the limits of this study, scene complexity had only a marginal effect on the correlation between technologies. This may indicate that
the difference between "simple" and "complex" as chosen
for this studywas not large enough to reveal an effect. General discussion
The specific scenes and luminaires chosen were
selected in an effort to test the software under whatwas thought to be varying degrees of complexity. It was thought that the software would have more difficulty
rendering a complex environment versus a simple
envi-ronment, and that is would be more difficulttorender a
scene 'With luminaires containing an indirect
compo-nent. Thiswas not suggested by the data. In the eight scenes that were compared, there were certainly diffe-rences in the degree of agreement. Because no distinct
trend was observed across the eight scenes, it appears
that these differences are more attributable to peculiari-ties of the separate technologies than to scene complexity or luminaire type.
The fact that there is not a significant difference between mean luminance in any pair of Lightscape and Radiance images is not surprising. With both software packages, the authors had precise control over how
many lumens were sent into the environment. The
quan-tity oflumens is simply a function of the photometry files and the multiplying factor; and it is a fact that the input photometry and the mUltiplying factor were identical for both sets of simulations. The fact that the correlation coefficient between the two software packages range from 0.601 to 0.997 indicates that the manner in which the different software computes the luminance distribu-tion is plainly different. Simply put, the data implies that while Radiance and Lightscape start and finish with the same number of lumens, they may distribute these
lumens on the room surfaces in a differentway.
Clearly, the three technologies are different in inte-resting ways. This naturally leads to inquiring about which technology is most correct. With respect to mean luminance, the software computed a higher mean than was measured with the IQCam in every instance. Mean rendered luminance ranged from 9.1 percent to 50.9
percent higher than mean measured luminance. The
128
notion that the measured values are nearer to reality than the computed values seems to be supported by the good agreement between the IQCam and a Minolta CS-100 Chroma Meter." Although speculative, it is the authors' opinion that the IQCam measurements are more representative of what was happening in the space than the computed simulations.
Mean luminance, however, is only one component of
this study. Because we did not know with certainty the quantity of lumens exiting the luminaires, it is at least equally meaningful to draw conclusions based on corre-lation. The correlation analyses reveal that, overall, the three technologies were performing similarly. Yet, there are subtle differences that are quite important.
The correlation between Lightscape and the IQCam ranges from 0.584 to 0.916 while the correlation between Radiance and the IQCam ranges from 0.843 to 0.968.If
the IQCam measurements are accepted as our best rep-resentation of reality, the data suggests that Radiance did a belter job than Lightscape at simulating this reality within the limits of this study. The very low correlation of 0.584 between Lightscape and the lQCam for the lensed troffer and empty cubicle is also troublesome. It is unknown under what conditions a poor match like this will occur, especially since it was thought that this scene would be the simplest to render. This wide range of cor-relation coefficients tends to undermine the authors confidence in Lightscape's ability to accurately compute
luminance distributions. Conversely, the lowest
correla-tion between a Radiance and IQCaffi image is 0.843, demonstrating that even in the worst case Radiance and IQCam images still had acceptable correlation. This tends to support Radiance's abilitytoaccurately compute
luminance distributions.
Future work
This project had the underlying objective of formulat-ing an overall picture of the software's global accuracy. The authors intentionally ignored the importance of individual surfaces by performing the analYses on ran-domly chosen pixel samples. This was considered to be a necessary first step toward evaluating the software's over-all credibility. For a lighting designer, certain regions of any given image may be of greater importance than oth-ers. It would be a useful endeavor to first identify the parts of an image that are important, and then perform a focused comparison on these specific regions. This type of study could be designedto evaluate how well the different software simulates specific scene elements.
For example, suppose an image contained a comput-er monitor and. that reflected glare on the monitor has been identified as an important aspect of the simulation. The maximum intensity, shape, and area of the highlight displayed by each technology could be evaluated and
••••••••••••••••••••••••••••••••••••••••••••••
compared. This type of study would have the potential to identify subtle yet important differences between the technologies.
A separate follow-up study that could be performed is one with the specific objective of isolating where the soft-ware is failing. In this type of study, it would be necessary to perform a systematic series of simulations. The simu-lations could be contrived so that the final luminance dis-tribution could be calculated beforehand based on pure theory. The simulations would be devised in such a way as to isolate specific components of the simulation. Some examples of elements of the software that could be iso-lated include; the direct flux calculation, the inter-reflected calculation, specific material types, and color.
Summary and conclusions
To reiterate, the first objective of this study was to determine ifstatistical and/or substantive differences
exist between luminance images produced by
Lightscape, Radiance, and an IQCam. Further, we had hoped to gain insight into how and to what magnitude the separately derived images differ. These issues were addressed by developing luminance images of as identi-cal as possible image planes using the three different technologies. The final images were then visually com-pared and subjected to a numerical analysis.
Visual and numerical differences were found among the three technologies. The findings are summarized:
1.Within the limits of this study, both Lightscape and Radiance were found to be quite successful at simulating the appearance of an architectural scene.
2. Visual differences between Radiance and
Lightscape images include; color differences, differences in specular appearance, small differences in shadows and shadow boundaries, the appearance of the gradient on an indirectly lighted ceiling plane, and luminaire
reflec-tions in a computer screen.
3. In all eight scenes, the mean luminance computed by Radiance and Lightscape was higher than that mea-sured with the IQCam; in six of the eight cases the dif. ferencewasstatistiCally significant
4. The correlation between Radiance and IQCam images was consistently higher than the correlation between Lightscape and IQCam images; while the corre-lation between Radiance and Lightscape images was
quite variable across the different scenes.
5. Caution should be exercisedifthe luminance val-ues computed by either Lightscape or Radiance will be
used to make design decisions. .
6. Within the context of this study, ifIQCam mea-surements are accepted as our best representation of reality, the data suggests that Radiance will simulate this reality belter than Lightscape.
,
••••••••••••••••••••••••••••••••••••••••••••••
Acknowledgments
The authors would like to thank Dr. Guy Newsham, Ralston Jaekel, Charles Ehrlich, Gregory Ward, Stuart Feldman, Filippo Tampieri, Dr. Brian Tansley, and Ian Ashdown. This workwasfinancially supported by Public Works and Government Services Canada and by the National Research Council Canada under the Panel on Energy Research and Development (PERD) funding envelope.
References
1. ClEo 1987. Methods ofcharacterizing illuminance meters
and luminance meters: performance, characteristics and speci.fi· cations. CIE No. 69. Central Bureau of the CIK Vienna.
2. Cohen, M.F., Wallace,j.R. Radiosity and Realistic lage
Synthesis. Cambridge, UK: Cambridge Academic Press.
3. Edwards, A.L. 1950. Experimental Design in
Psychological Research. New York: Rinehart and Co.
4. Edwards, A.L. 1968. Experimental Design in
Psychological Research. New York: Holt, Rinehart, and
Winston.
5. Houser, K W. 1997. A comparison ofluminance images:
lightscape, radiance, and an IQCam. Contract Report No.
993-6-018. Ottawa: Public Works and Government Services Canada.
6. IQCam User's Guide Version 1.4. 1996. Ontario,
Canada: B.W. Tansley& Associates Limited.
7. Lightscape Visualization System User's Guide Version 2.
1995. San Jose, CA: Lightscape Technologies, Inc. 8. Rea, M.S., Jeffrey, I.G. 1990. A r!eU!luminance and
image analysis system for lighting and vision I: equipment and calibration.] ofthe IESVol. 19(No. 1).
9. Tansley, B.W. 1997. Balancing and QC of visual
dis-plays using an on-line digital image photometer. Los Angeles,
CA: Annual Meeting of the Aerospace Lighting Institute. 10. Tansley, B., Houser, K, Pasini. I. 1997. The IQCam
digital image photometer system: principles of operation and comparative performance. Proceedings of the lESNA
Annual Conference. Seattle, WA.
11. Ward, G., Rubinstein, F., Grynberg, A. 1987.
Luminance in computer aided lighting design. Lawrence
Berkeley Laboratory, Report No. LBL-33404. Berkeley, CA. 12. Ward, G. 1996. Adeline 2.0 - Radiance Reference
Manual. Berkeley, CA: Lawrence Berkeley Laboratory.
13. Ward, G. 1996. Toolsfor lighting design and analysis, global illumination in architecture and theater. Siggraph course notes No.7. New Orleans, LA.
JOURNALoftheilluminating Engineering Society