Pépite | Réseau ubiquitaire pour les Smart Grids
113
0
0
Texte intégral
(2) Thèse de Jad Nassar, Université de Lille, 2018. © 2018 Tous droits réservés.. lilliad.univ-lille.fr.
(3) Thèse de Jad Nassar, Université de Lille, 2018. iii. “In memory of my father.”. © 2018 Tous droits réservés.. lilliad.univ-lille.fr.
(4) Thèse de Jad Nassar, Université de Lille, 2018. © 2018 Tous droits réservés.. lilliad.univ-lille.fr.
(5) Thèse de Jad Nassar, Université de Lille, 2018. v. Remerciements Je tiens tout d’abord à exprimer ma profonde gratitude et mes sincères remerciements à ma directrice de thèse Dr. Nathalie Mitton. Sa disponibilité, sa réactivité, son immense soutien et surtout son écoute ainsi que ses judicieux conseils ont énormément contribué à alimenter ma réflexion et ont été décisifs pour la bonne réussite de cette thèse. J’adresse de chaleureux remerciements à mon co-encadrant de thèse, Dr. Nicolas Gouvy, pour m’avoir permis de réaliser ma thèse dans les meilleures conditions et pour son attention de tous les instants sur mes travaux. Je lui suis également reconnaissant pour le temps conséquent qu’il m’a accordé et ses qualités pédagogiques et scientifiques. J’ai pris un grand plaisir à travailler avec lui. Je remercie Dr. Thierry Lenclud, responsable du département OMI, pour son aide et son soutien au sein de HEI, ainsi que pour l’attention et l’intérêt qu’il a porté vis-à-vis de mon expertise et mes compétences. Je remercie aussi Prof. Ye-Qiong Song et Dr. Fabrice Théoleyre pour avoir accepté d’être les rapporteurs de mon travail. Merci aux Prof. Zied Chtourou, Prof. Benoît Robyns, Dr. Karen Miranda et Dr. Georgios Papadopoulos pour avoir accepté de faire partie du jury. Je remercie toutes les personnes avec lesquelles j’ai pu collaborer et travailler pendant ma thèse, plus particulièrement Matthieu Berthomé de l’équipe FUN, Dr. Karen Miranda pendant mon séjour au Mexique ainsi que Prof. Bruno Quoitin et Jeremy Dubrulle de l’université de Mons. Je tiens à témoigner toute ma reconnaissance à mes financeurs : HEI – Yncréa Hauts de France et la Métropole Européenne de Lille (MEL). Ce travail n’aurait pu être mené à bien sans eux. Je remercie de même Inria Lille pour son accueil durant ma thèse. Sur un plan plus personnel, je remercie ma famille pour m’avoir soutenu tout au long de mes études. Je désire en outre remercier tous les membres de l’équipe FUN, du département OMI, de la maison de la recherche, tous mes collègues à HEI, doctorants (surtout les Grands Docteurs), ingénieurs (écolo et "végétarien"), mes amis à Reeflex, à Lille, à Belfort et à Paris. Merci. © 2018 Tous droits réservés.. lilliad.univ-lille.fr.
(6) Thèse de Jad Nassar, Université de Lille, 2018. vi pour les discussions enrichissantes, pour votre bonne humeur et surtout pour votre support moral et intellectuel tout au long de cette aventure. À vous tous, un grand merci !. © 2018 Tous droits réservés.. lilliad.univ-lille.fr.
(7) Thèse de Jad Nassar, Université de Lille, 2018. vii. Résumé Les Smart Grids visent à transformer le réseau électrique actuel en un réseau "plus intelligent" où la production énergétique est décentralisée et automatisée, facilitant l’intégration des sources d’énergie renouvelables. Cette évolution est rendue possible grâce à l’utilisation d’un réseau de communication pour les multiples échanges de données hétérogènes des Smart Grids. L’objectif de cette thèse est de proposer un paradigme de communication efficace en termes de qualité de service pour les Smart Grids basé sur les réseaux de capteurs. Dans un premier temps, on s’intéresse au protocole standard RPL. Nous proposons une évolution de celui-ci à travers une nouvelle fonction objectif. Celle-ci tire parti de l’hétérogénéité matérielle des nœuds et des liens pour introduire la qualité de service. Cela permet à RPL de satisfaire les multiples et différentes exigences en termes de fiabilité, de latence et de priorité dans l’acheminement des données. Nos résultats montrent que notre approche permet bien la différentiation du trafic tout en réduisant la latence du routage et en économisant l’énergie. Nous proposons également d’améliorer l’utilisation du réseau de capteurs en y introduisant l’auto-organisation et la réduction des données. Le but est alors de prédire la valeur des données mesurées plutôt que de les transmettre. Une autre approche explorée est d’agréger les différents messages transitant sur le réseau tout en considérant leurs différentes exigences de qualité de service. Ces deux approches permettent ainsi de réduire la consommation d’énergie tout en respectant les exigences des différentes applications des Smart Grids.. © 2018 Tous droits réservés.. lilliad.univ-lille.fr.
(8) Thèse de Jad Nassar, Université de Lille, 2018. © 2018 Tous droits réservés.. lilliad.univ-lille.fr.
(9) Thèse de Jad Nassar, Université de Lille, 2018. ix. Abstract Smart Grids aim to transform the current electric grid into a "smarter" network where energy production is decentralized and automated, which facilitates the integration of renewable energy resources. This evolution is made possible thanks to the use of a communication network for the multiple heterogeneous data exchanges of the Smart Grids. Hence, the aim of this thesis is to propose an efficient communication paradigm in terms of quality of service for Smart Grids based on wireless sensor networks. First, we study data routing in Smart Grids with the RPL standard. Nevertheless, RPL is not suitable for Smart Grid applications in terms of quality of service. Therefore, we propose an objective function for RPL that takes different features of both nodes and links into consideration. Results show that our approach improves network performance compared to existing solutions in terms of packet delivery ratio, network lifetime, latency and traffic differentiation. Then, we also propose a more efficient data collection by introducing self-organization and data reduction for these wireless sensors. The goal is to predict the value of the measured data rather than transmitting them. Another explored approach is to aggregate the different messages sent across the network while considering their different requirements in terms of quality of service. These two approaches reduce the energy consumption while respecting the requirements of the different applications of the Smart Grids.. © 2018 Tous droits réservés.. lilliad.univ-lille.fr.
(10) Thèse de Jad Nassar, Université de Lille, 2018. © 2018 Tous droits réservés.. lilliad.univ-lille.fr.
(11) Thèse de Jad Nassar, Université de Lille, 2018. xi. Contents Résumé. vii. Abstract. ix. 1. Introduction. 1. 1.1. Towards A Smart Grid . . . . . . . . . . . . . . . . . . . . . .. 1. 1.1.1. Why Smart Grids? . . . . . . . . . . . . . . . . . . . .. 1. 1.1.2. Smart Grid architecture . . . . . . . . . . . . . . . . .. 2. 1.1.3. Ubiquitous network for Smart Grid . . . . . . . . . .. 3. Contribution Of The Thesis . . . . . . . . . . . . . . . . . . .. 4. 1.2.1. Quality of Service routing in Smart Grids . . . . . . .. 4. 1.2.2. Data reduction in Smart Grids . . . . . . . . . . . . .. 6. Structure Of The Thesis . . . . . . . . . . . . . . . . . . . . . .. 8. 1.2. 1.3 2. State Of The Art. 9. 2.1. Prerequisites . . . . . . . . . . . . . . . . . . . . . . . . . . . .. 9. 2.2. The Smart Grids . . . . . . . . . . . . . . . . . . . . . . . . . .. 10. 2.2.1. Smart Grid technologies: pros and cons . . . . . . . .. 10. 2.2.2. Smart Grid communication network . . . . . . . . . .. 11. 2.2.3. Smart Grids communication requirements . . . . . .. 13. 2.2.4. Applications . . . . . . . . . . . . . . . . . . . . . . . .. 14. 2.3. Routing protocols for Smart Grids . . . . . . . . . . . . . . .. 16. 2.4. RPL protocol: how does it work? . . . . . . . . . . . . . . . .. 18. 2.5. RPL related work . . . . . . . . . . . . . . . . . . . . . . . . .. 21. 2.5.1. SG based RPL proposed modifications . . . . . . . . .. 21. 2.5.2. ETX & HC: main metrics in RPL objective functions .. 22. 2.5.3. Energy aware and load balancing metrics for RPL . .. 22. 2.5.4. Multipe objective metrics for RPL . . . . . . . . . . .. 23. 2.5.5. Multiple instances . . . . . . . . . . . . . . . . . . . .. 23. 2.5.6. Observations . . . . . . . . . . . . . . . . . . . . . . .. 24. Summary . . . . . . . . . . . . . . . . . . . . . . . . . . . . . .. 24. 2.6 3. © 2018 Tous droits réservés.. Quality of Service Routing in Smart Grids. 27. 3.1. Overview . . . . . . . . . . . . . . . . . . . . . . . . . . . . . .. 27. 3.1.1. Smart Grid heterogeneous traffic . . . . . . . . . . . .. 27. 3.1.2. RPL multiple instances . . . . . . . . . . . . . . . . . .. 27. lilliad.univ-lille.fr.
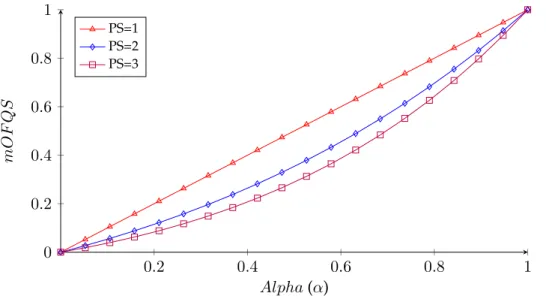
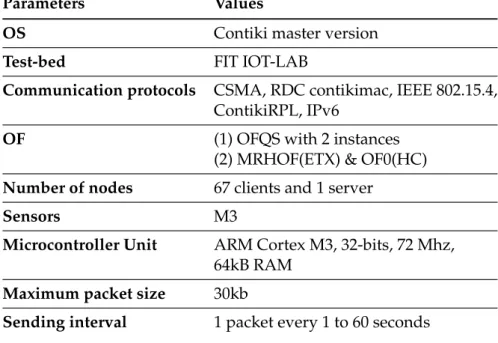
(12) Thèse de Jad Nassar, Université de Lille, 2018. xii 3.2. Proposed Solution . . . . . . . . . . . . . . . . . . . . . . . . .. 28. 3.2.1. OFQS objective function . . . . . . . . . . . . . . . . .. 28. 3.2.2. QoS factors in OFQS . . . . . . . . . . . . . . . . . . .. 28. 3.2.3. mOFQS metric . . . . . . . . . . . . . . . . . . . . . .. 29. 3.2.4. Instances classification . . . . . . . . . . . . . . . . . .. 32. Evaluation . . . . . . . . . . . . . . . . . . . . . . . . . . . . .. 32. 3.3.1. Performance metrics . . . . . . . . . . . . . . . . . . .. 33. 3.3.2. Simulation . . . . . . . . . . . . . . . . . . . . . . . . .. 33. 3.3.2.1. COOJA simulator . . . . . . . . . . . . . . .. 33. 3.3.2.2. Simulation setup . . . . . . . . . . . . . . . .. 34. 3.3.2.3. Performance evaluation: Simulation . . . .. 35. Experiment . . . . . . . . . . . . . . . . . . . . . . . .. 38. 3.3.3.1. FIT IoT-LAB test-bed . . . . . . . . . . . . .. 38. 3.3.3.2. Battery level measurement . . . . . . . . . .. 39. 3.3.3.3. Network setup . . . . . . . . . . . . . . . . .. 40. 3.3.3.4. Performance evaluation: experiment . . . .. 41. 3.4. Evaluation: Simulation vs Experiment . . . . . . . . . . . . .. 44. 3.5. Discussion And Possible Improvements . . . . . . . . . . . .. 45. 3.6. Summary . . . . . . . . . . . . . . . . . . . . . . . . . . . . . .. 46. 3.3. 3.3.3. 4. 5. © 2018 Tous droits réservés.. Data Prediction in Smart Grids. 47. 4.1. Related Work . . . . . . . . . . . . . . . . . . . . . . . . . . .. 47. 4.1.1. Data prediction different schemes . . . . . . . . . . .. 48. 4.1.2. LMS algorithm overview . . . . . . . . . . . . . . . .. 49. 4.1.3. Time series forecasting and LMS proposed variants .. 51. 4.2. LMS Limitations . . . . . . . . . . . . . . . . . . . . . . . . . .. 52. 4.3. Our Contribution: LMS_MOD . . . . . . . . . . . . . . . . . .. 53. 4.3.1. Simulation setup and parameters determination . . .. 54. 4.3.2. Performance Evaluation . . . . . . . . . . . . . . . . .. 55. 4.3.2.1. root mean square error . . . . . . . . . . . .. 56. 4.3.2.2. Data reduction percentage . . . . . . . . . .. 57. 4.4. Discussion And Possible Improvements . . . . . . . . . . . .. 58. 4.5. Summary . . . . . . . . . . . . . . . . . . . . . . . . . . . . . .. 60. Data aggregation in Smart Grids. 63. 5.1. Related Work . . . . . . . . . . . . . . . . . . . . . . . . . . .. 64. 5.1.1. Data aggregation means . . . . . . . . . . . . . . . . .. 65. 5.1.2. Data aggregation in WSN and SGs . . . . . . . . . . .. 65. 5.2. Proposed Solution . . . . . . . . . . . . . . . . . . . . . . . . .. 66. 5.3. Expected Results . . . . . . . . . . . . . . . . . . . . . . . . .. 72. 5.4. Summary . . . . . . . . . . . . . . . . . . . . . . . . . . . . . .. 73. lilliad.univ-lille.fr.
(13) Thèse de Jad Nassar, Université de Lille, 2018. xiii 6. Conclusion and Perspectives. 75. 6.1. Conclusion . . . . . . . . . . . . . . . . . . . . . . . . . . . . .. 75. 6.2. Perspectives . . . . . . . . . . . . . . . . . . . . . . . . . . . .. 76. 6.2.1. Short term . . . . . . . . . . . . . . . . . . . . . . . . .. 76. 6.2.2. Long term . . . . . . . . . . . . . . . . . . . . . . . . .. 77. From A Smart Grid To A Smart City . . . . . . . . . . . . . .. 78. 6.3. © 2018 Tous droits réservés.. List Of Publications. 81. Bibliography. 83. lilliad.univ-lille.fr.
(14) Thèse de Jad Nassar, Université de Lille, 2018. © 2018 Tous droits réservés.. lilliad.univ-lille.fr.
(15) Thèse de Jad Nassar, Université de Lille, 2018. xv. List of Figures 1.1. Smart Grid architecture . . . . . . . . . . . . . . . . . . . . . .. 2. 1.2. Smart Grid metering data collection. . . . . . . . . . . . . . .. 5. 2.1. Smart Grid communication network [33] . . . . . . . . . . .. 12. 2.2. Rank concept in RPL . . . . . . . . . . . . . . . . . . . . . . .. 19. 3.1. mOF QS variation with α. ET X=1, d=1 . . . . . . . . . . . .. 30. 3.2. Network with different ET X, delay d (in ms) and P S values. 30. 3.3. COOJA simulation window . . . . . . . . . . . . . . . . . . .. 34. 3.4. Network lifetime variation . . . . . . . . . . . . . . . . . . . .. 36. 3.5. Remaining energy distribution among the nodes after 24 hours 36. 3.6. End-to-End delay variation with time . . . . . . . . . . . . .. 3.7. Packet delivery ratio percentage for the different OFs/metrics 38. 3.8. Topology of the deployment on FIT IoT-LAB Lille’s site . . .. 39. 3.9. Hardware of an IoT-LAB node [75] . . . . . . . . . . . . . . .. 39. 3.10 End-to-End delay variation with time . . . . . . . . . . . . .. 42. 3.11 Network lifetime variation . . . . . . . . . . . . . . . . . . . .. 42. 37. 3.12 Remaining energy distribution among the nodes after 30 minutes . . . . . . . . . . . . . . . . . . . . . . . . . . . . . . . . . 3.13 Gain comparison between simulation and experiment 4.1. . . .. 45. Categorization of energy saving in sensor networks [23] (data prediction highlighted) . . . . . . . . . . . . . . . . . . . . . .. 48. 4.2. Adaptive filter [28] . . . . . . . . . . . . . . . . . . . . . . . .. 49. 4.3. Diagram of the modified LMS algorithm process (the modification marked in blue) . . . . . . . . . . . . . . . . . . . . .. 54. 4.4. RMSE for irradiance . . . . . . . . . . . . . . . . . . . . . . .. 57. 4.5. RMSE for temperature . . . . . . . . . . . . . . . . . . . . . .. 57. 4.6. RMSE for humidity . . . . . . . . . . . . . . . . . . . . . . . .. 58. 4.7. RMSE for average wind speed . . . . . . . . . . . . . . . . . .. 58. 4.8. Data reduction for irradiance . . . . . . . . . . . . . . . . . .. 59. 4.9. Data reduction for temperature . . . . . . . . . . . . . . . . .. 59. 4.10 Data reduction for humidity . . . . . . . . . . . . . . . . . . .. 60. 4.11 Data reduction for average wind speed . . . . . . . . . . . .. 60. 5.1. Categorization of energy saving in sensor networks [23] (data aggregation techniques highlighted) . . . . . . . . . . . . . .. © 2018 Tous droits réservés.. 43. 64. lilliad.univ-lille.fr.
(16) Thèse de Jad Nassar, Université de Lille, 2018. xvi. © 2018 Tous droits réservés.. 5.2. Aggregation scenario . . . . . . . . . . . . . . . . . . . . . . .. 68. 5.3. Aggregator node algorithm . . . . . . . . . . . . . . . . . . .. 68. 5.4. Lossy/Lossless queue algorithm . . . . . . . . . . . . . . . .. 69. 5.5. Data aggregation example in a WSN . . . . . . . . . . . . . .. 71. lilliad.univ-lille.fr.
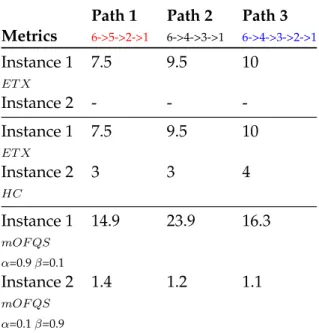
(17) Thèse de Jad Nassar, Université de Lille, 2018. xvii. List of Tables. © 2018 Tous droits réservés.. 2.1. NAN requirements in terms of reliability[12] . . . . . . . . .. 17. 3.1. Paths values for the different metrics used . . . . . . . . . . .. 31. 3.2. Parameters of the simulation . . . . . . . . . . . . . . . . . .. 35. 3.3. Parameters of the experiment . . . . . . . . . . . . . . . . . .. 41. 4.1. Data traces description . . . . . . . . . . . . . . . . . . . . . .. 55. 4.2. Data traces obtained parameters . . . . . . . . . . . . . . . .. 56. lilliad.univ-lille.fr.
(18) Thèse de Jad Nassar, Université de Lille, 2018. © 2018 Tous droits réservés.. lilliad.univ-lille.fr.
(19) Thèse de Jad Nassar, Université de Lille, 2018. xix. List of Abbreviations. © 2018 Tous droits réservés.. AMI. Advanced Metering Infrastructure. DER. Distributed Energy Ressources. DIO. DODAG Information Object. DODAG. Destination Oriented Directed Acyclic Graph. ETX. Expected Transmission Count. HAN. Home Area Network. HC. Hop Count. LLN. Low-power and Lossy Networks. LMS. Least Mean Square. MAC. Media Access Control. MRHOF. Minimum Rank with Hysteresis Objective Function. MSE. Mean Square Error. MTU. Maximum Transmission Unit. NAN. Neighborhood Area Network. OF0. Objective Function Zero. PDR. Packet Delivery Ratio. PLC. Power Line Communication. QoS. Quality of Service. RMSE. Root Mean Square Error. RPL. Routing Protocol for Low-power and lossy networks. SG. Smart Grid. WAN. Wide Area Network. WSN. Wireless Sensor Network. lilliad.univ-lille.fr.
(20) Thèse de Jad Nassar, Université de Lille, 2018. © 2018 Tous droits réservés.. lilliad.univ-lille.fr.
(21) Thèse de Jad Nassar, Université de Lille, 2018. 1. Chapter 1. Introduction In this first chapter, we firstly introduce the general context of the thesis and the necessity of Smart Grids. After that, we present our contributions. Finally, we provide an overview of the structure of this thesis.. 1.1 1.1.1. Towards A Smart Grid Why Smart Grids?. Conventional power grids are "complex systems" that generally consist of the interconnection of various power system elements such as synchronous machines, power transformers, transmission lines, transmission substations, distribution lines, distribution substations, and different types of loads. These are located far from the power consumption area and electric power is transmitted through long transmission lines. This system is characterized by a relatively simple hierarchical unidirectional flow of electricity through the grid, from a few generators to a large number of consumers. These power grids no longer satisfy the need of energy of the twenty first century. The increased electricity demand per person is limited by the restrained electricity production and these aging and unsuitable infrastructures. This limitation is also due to inaccurate management systems, inefficient operations and maintenance processes, the need for a huge human intervention and a centralized communication system that lacks interoperability. Besides that, the introduction into the electricity grid of multiple sporadic Distributed Energy Resources (DERs) e.g., electric vehicles, photovoltaic cells, wind farms, located in sometimes unexpected places, makes its control even more complex [1]. Smart Grid (SG) promises to solve these issues by operating with automatic control and operation in response to user needs and power availability, improving efficiency, reliability and safety, with smooth integration of numerous renewable and alternative energy sources.. © 2018 Tous droits réservés.. lilliad.univ-lille.fr.
(22) Thèse de Jad Nassar, Université de Lille, 2018. 2. Chapter 1. Introduction. 1.1.2. Smart Grid architecture. Figure 1.1 shows the classical architecture of the SG (we note that some elements of this architecture may differ [2, 3] from a city or a country to another). It consists of four functional domains (bulk generation, transmission, distribution and customer [consumption and generation]), a two-way flow of electricity and a communication network that ensures bidirectional information exchange.. F IGURE 1.1: Smart Grid architecture. In the bulk generation, the electricity that power plants generate is delivered to customers over transmission and distribution power lines. Highvoltage transmission lines, like those that hang between tall metal towers, carry electricity over long distances to where consumers need it. Higher voltage electricity is more efficient and less expensive for long-distance electricity transmission [4]. The generator voltage is usually around 15 to 25 KV (KiloVolt) [5]. This relatively low voltage is not appropriate for the transmission of energy over long distances. For that, at the generating station, a transformer is used to increase the voltage and reduce the current. The voltage is increased to 500 KV and a high-voltage line transmits the generatorproduced energy to a distant substation. Lower voltage electricity that is safer for use in the customer domain is delivered through distribution lines. For that, the voltage is then reduced to 12 KV at the distribution substation. Several distribution lines emanate from each distribution substation as overhead or underground lines and distribute the energy along streets and alleys. The distribution transformers reduce the voltage which supplies houses, shopping centers, and other local loads. In other words, transformers at substations increase (step up) or reduce (step down) voltages to adjust to the different stages of the journey from the power plant on long-distance transmission lines to distribution lines that carry electricity to homes and businesses.. © 2018 Tous droits réservés.. lilliad.univ-lille.fr.
(23) Thèse de Jad Nassar, Université de Lille, 2018. 1.1. Towards A Smart Grid. 3. In the customer domain, every household or commercial establishment can generate electricity (under certain authorizations) by installing solar photovoltaic panels or wind farms on their rooftops and become electricity producers. In that way, they can meet their electricity demand partly or fully by themselves, and even selling excess electricity to the distribution utilities which will allow bidirectional electricity flow. Moreover, in a SG, a two way communication network sits on top of the conventional power grid to allow the required information (e.g., control and consumption messages) to be exchanged across the network. Communication technologies range between wireless and/or wired [6]. This network typically consists of a Home Area Network (HAN), which is used to gather data from a variety of devices within the household, a Neighborhood Area Network (NAN) to connect smart meters to local access points and a Wide Area Network (WAN) responsible of the decision making and connecting the grid to the utility system (more details about the communication network will be provided in Chapter 2). It is useful to note that Enedis, the company which is in charge of the electricity distribution network in France, uses G3-PLC standard [7] which is a physical layer specification for Power Line Communication (PLC) to manage the communication network. It consists of using the power grid as a communication medium by superposing a high frequency electrical signal on the electrical signal. G3-PLC allows two-way communications that provide electricity network operators with intelligent monitoring and control capabilities. Besides that, as the power lines are managed by the operator, PLC makes it then possible to be independent of any other service provider and the associated costs. However, PLC suffers from many drawbacks such as high noise sources and interference, low data rates, open circuit problems (communication over the power lines is lost with devices on the side of an open circuit) [6].. 1.1.3. Ubiquitous network for Smart Grid. In order to shift from the existing electric grid to the self-organizing and communicating SG, it appears necessary to instrument and master the high level and complex energy supervision on the electric grid. Managing the SG with a ubiquitous network to exchange regular and critical control messages all over the power network becomes then crucial. Consequently, one of the potential solutions envisioned is to equip the electrical grid with wireless sensors located at strategic measuring points to achieve remote monitoring, data collection and control of the grid [8]. These sensors are. © 2018 Tous droits réservés.. lilliad.univ-lille.fr.
(24) Thèse de Jad Nassar, Université de Lille, 2018. 4. Chapter 1. Introduction. able to communicate together via the radio medium. It is the set of thousands of these communicating sensors distributed on the grid that will establish a parallel wireless data network (wireless sensor network), that will constitute the ubiquitous network of the SG, the real nervous system of it. When compared to conventional wired communication networks, wireless communication technologies and Wireless Sensor Network (WSN) in our case have potential benefits in order to remotely control and monitor substations, e.g., savings in cabling costs and rapid installation of the communication infrastructure. They offer several advantages like their ease of deployments, scalability regarding the expandability of the network, resilience and robustness due to their ability to cope with node failures, infrastructure less and low cost in terms of material and deployment (e.g., in wireless communication, cabling cost is eliminated.) [9], etc. On the other hand, WSNs are more susceptible to electro magnetic interference and often have limitations in bandwidth capacity, autonomy and maximum distances among communication devices [6]. These issues have to be carefully considered when designing a SG network. Furthermore, SG applications are heterogeneous in terms of requirements, criticality and delay tolerance [10, 11, 12]. These applications generate different types of traffic (real-time, critical, regular) [13]. Consequently, they require different levels of Quality of Service (QoS). Thus, for a WSN, different criteria have to be taken into consideration in order to achieve a reliable communication with the following requirements: reliability, latency, auto-configuration, auto-adaptation, network scaling and data prioritization [6, 13, 14].. 1.2. Contribution Of The Thesis. Given the SG requirements in terms of diversity of applications and traffic, the aim of this thesis is to propose a heterogeneous and QoS efficient communication paradigm for SGs based on WSNs. At first, we address the QoS routing in SGs and traffic differentiation with the RPL (Routing Protocol for Low power and lossy networks) standard. After that, as effective as the QoS routing in SGs, and considering the WSNs challenges previously discussed, we are also interested in a more effective feedback of information by introducing self-organization and data reduction in SGs.. 1.2.1. Quality of Service routing in Smart Grids. In a WSN, and in order to be able to address each sensor individually, for example to activate/disable the energy source or measure its level of production in a SG environment, the nodes cooperate to relay messages from. © 2018 Tous droits réservés.. lilliad.univ-lille.fr.
(25) Thèse de Jad Nassar, Université de Lille, 2018. 1.2. Contribution Of The Thesis. 5. one sensor to another across the network. Those are the algorithms called routing protocols which are in charge of determining which path to follow in the ubiquitous network of thousands of sensors to reach a given sensor and be able to communicate with it, and thus act on the SG. We understand therefore the crucial importance of routing protocols. Among all the existing routing protocols used in the SGs, the Internet Engineering Task Force (IETF) standard RPL [15] remains the most recognized and widely used [16, 17].. F IGURE 1.2: Smart Grid metering data collection.. As described in [18], RPL meets the scalability and reliability constraints of SG applications (e.g., Advanced Metering Infrastructure) and is recommended by the SG standards. Alongside with its support for wireless communications, RPL can be used with PLC [19]. Figure 1.2 shows how smart meters (represented by houses) can send their measurements to the concentrator via wireless or PLC links. The same Media Access Control (MAC) layer can be compatible with a physical layer using wireless or PLC communications. We note that other protocols [20] are used for routing in SGs but these protocol do not support traffic differentiation which is an important aspect for SG applications. As a general protocol, RPL is intended to meet the requirements of a wide range of Low-Power and Lossy Networks (LLNs) application domains including the SGs ones. It allows an improvement and adaptation margin via different objective functions. They optimize the routing metrics that are used to build the routes and hence help in choosing the best route. It provides different QoS classes at the network layer through multiple logical subdivisions of the network called instances (more details in Section 2.4). However, RPL standard objective functions do not allow traffic differentiation and do not fulfill the heterogeneous requirements of SGs in terms of QoS. Following RPL, Request For Comments (RFC) 8036 proposes five different priority classes for the traffic in SG Advanced Metering Infrastructure. © 2018 Tous droits réservés.. lilliad.univ-lille.fr.
(26) Thèse de Jad Nassar, Université de Lille, 2018. 6. Chapter 1. Introduction. (AMI). Other work [21] classify the traffic into two levels: critical and periodic. Based on that and since the traffic classes in the SG are not standardized, a single solution to route the traffic with different QoS may not be sufficient since the number of instances (traffic classes) vary depending on the application and the implementation. A multi-objective approach is thus essential to meet the QoS requirements of SG applications. Therefore, we introduce OF QS, an RPL compliant objective function, with a multi-objective metric that considers the delay and the remaining energy in the battery nodes alongside with the quality of the links. Our function adapts to the number of instances providing a QoS differentiation based on the different SG applications requirements. Computer simulations and real test-bed experiments show that OF QS provides a low packet delivery latency and a higher Packet Delivery Ratio (PDR) while extending the lifetime of the network compared to solutions in literature.. 1.2.2. Data reduction in Smart Grids. In a SG, electricity and energy do exist, but connecting sensors to such high voltage with intermittent and ill-adapted energy levels is sometimes inappropriate. Moreover, self powered sensors are easier to deploy. For that, battery-powered sensors must be deployed all over the grid alongside with the main-powered ones. Thus, reporting data measurements at specific intervals has a direct effect on the sensors battery lifetime since the communication task consumes most of their available energy [22]. In such context of continuous data reporting, data changes are limited between each reading, which may cause redundant information at the destination. To mitigate these energy loses and increase the network’s lifetime, data reduction approaches are used [23]. These approaches can be classified into three main categories [23]: Innetwork processing, data compression and data prediction: • In-network processing consists of processing the data collected by the sensor nodes themselves between the source and the destination [24], in this way the amount of data is reduced while traversing the network. • In data compression, data is generally reduced by performing data aggregation techniques [25] on specific nodes called "aggregators". • Data prediction aims for reducing wireless radio transmissions in the network which in turn will reduce the amount of data sent by each sensor. This is done by predicting the measured values using specific. © 2018 Tous droits réservés.. lilliad.univ-lille.fr.
(27) Thèse de Jad Nassar, Université de Lille, 2018. 1.2. Contribution Of The Thesis. 7. algorithms [26], which will require sending the predicted information to the destination (sink) only if it is shifted from the sensed one by a certain threshold. Although data reduction techniques are widely used in literature, their adaptability is limited to specific applications. Thus, using these techniques for SG applications requires specific customization since such applications are characterized by their diversity in terms of data types and QoS requirements. Therefore, our proposition concerning data reduction is twofold; at first, we consider data prediction techniques. This will allow us to limit redundant information at the destination nodes in a SG (based on WSN) environment where data variation is limited (e.g., photovoltaic cells monitoring). Later, we address data aggregation techniques. Here, broader applications are covered where collected data is not necessarily homogeneous. Aggregation will then enable decision making (regarding the routing) not only at the level of the sender and destination nodes as in data prediction, but potentially at every node in the network, aggregating jointly different data packets with different priorities and QoS requirements. Both of these data reduction techniques will reduce loads on the communication links, thus achieving a better utilization of the wireless channel and reducing energy consumption. Choosing the one or the other will depend on the characteristics of the SG application and the data it generates. For data prediction, we focus on a time series forecasting technique, called Least Mean Squares (LM S). This is an adaptive algorithm with very low computational overhead and memory consumption, that despite its simplicity, provides satisfactory performances in terms of computational speed, robustness and precision [27]. LM S main drawback is the complex task of choosing the adequate parameters. This directly impacts the stability of the algorithm specially when using it with different data types as is the case in a SG context [12]. We propose a modification for the LM S filter used for data prediction in WSN, which is introduced in [28], to adapt it to the different data types. We apply the algorithm to photovoltaic cells monitoring data set. We tune the parameters by training it offline for a certain time with the real data values of every data set and choosing the values that minimizes the Mean Square Error (M SE). Different parameters are obtained after the training process in accordance with every data type. Our simulation results show a better data prediction and a lower M SE compared to literature. Now concerning data aggregation, and as already mentioned, in a SG different applications require different QoS priorities. Consequently, data. © 2018 Tous droits réservés.. lilliad.univ-lille.fr.
(28) Thèse de Jad Nassar, Université de Lille, 2018. 8. Chapter 1. Introduction. aggregation must respect these requirements (i.e, delays caused by aggregating the packets) in order to ensure a reliable communication. Therefore, we propose a QoS efficient data aggregation algorithm for the different traffic in a SG network. The expected results will reduce the energy consumption in the network while respecting the QoS requirements of SGs.. 1.3. Structure Of The Thesis. Two main topics are addressed in this thesis: the first topic is the QoS routing in the SGs. The second one is data reduction in SGs which in turn is elaborated into two parts: data prediction and data aggregation in SGs. In Chapter 2, we provide an outline of the SG different aspects. After that, we address the routing in the Smart Grids followed by an overview of the RPL protocol and the main contributions around it. Chapter 3 is dedicated to the first topic - The QoS routing in the SGs. First, we present an overview on why we need multiple instances in RPL. Then, the proposed solution is provided and explained in detail. Finally, simulation and experiments results are presented and discussed. Second topic of the thesis is discussed first in Chapter 4 - Data prediction in SGs. A brief introduction on the requirements of data prediction in SGs is provided alongside with the main work concerning data prediction in WSN and SGs in literature. After that, our proposition and simulation results are presented and discussed. Chapter 5 tackles the second part of the data reduction topic - Data aggregation in SGs. In this chapter, we firstly provide a brief overview of data aggregation requirements in a SG environment. State of the art solutions are presented next. Last, we present our proposition, deeply analyze it with examples and discuss the expected results. Finally, Chapter 6 concludes the work presented in the previous chapters. Future work and perspectives that could improve SG efficiency and the overall performance of the proposed solutions are drawn.. © 2018 Tous droits réservés.. lilliad.univ-lille.fr.
(29) Thèse de Jad Nassar, Université de Lille, 2018. 9. Chapter 2. State Of The Art In this chapter, we firstly provide an overview of the Smart Grids different aspects. After that, we address the routing in the Smart Grids and provide a comprehensive overview of the RPL protocol and the main work around this standard.. 2.1. Prerequisites. Before starting this chapter we briefly provide some prerequisite requirements of some useful statements/expressions: • MAC layer: the MAC layer provides addressing and channel access control mechanisms that enable several terminals or network nodes to communicate in a network. It uses MAC protocols to ensure that signals sent from different stations across the same channel don’t collide. • Network layer: it is the layer that provides data routing paths for network communication. It selects and manages the best logical path for data transfer between nodes. This layer contains hardware devices such as routers, bridges, firewalls and switches. • Header and payload: in a data packet, the payload is the data itself that needs to be transferred (usually the user’s data). While the header identifies the source and destination of the packet and other control information, it is removed then from the packet when it reaches its destination and the payload is the only data received by the destination system. • Routing protocol: a routing protocol also known as routing policy uses software and routing algorithms to determine optimal network data transfer and communication paths between network nodes. It specifies how these nodes communicate with each other, distributing necessary information that enables them to select routes between any two nodes on a computer network.. © 2018 Tous droits réservés.. lilliad.univ-lille.fr.
(30) Thèse de Jad Nassar, Université de Lille, 2018. 10. Chapter 2. State Of The Art • Proactive, reactive and hybrid routing: : in proactive routing protocols every node stores information in the form of tables, the routes to all the destination (or parts of the network) are determined at the start up, and maintained by using a periodic route update process. In reactive protocols, routes are determined when they are required by the source using a route discovery process. Hybrid routing protocols combine the basic properties of the first two classes of protocols into one. • Distance vector routing protocol: in distance vector routing, each router sends its neighbors a list of all known networks along with its own distance to each one of these networks. In other words, each router depends on its neighbors for information, which the neighbors in turn may have learned from their neighbors, and so on.. 2.2. The Smart Grids. In this section we provide a quick overview on the SG technologies. We present then the typical architecture of the SG communication network, the corresponding communication requirements, alongside with the main SG applications.. 2.2.1. Smart Grid technologies: pros and cons. Network technologies that are used for communication, distribution, transmission and customer domain in SGs are the key components of the SG infrastructure. The integration of these technologies into the electricity infrastructure will allow the exchange of a huge amount of data from the different SG entities. Hence, it will allow a greater control and vision about the grid for the utilities and provide the customers with many additional facilities, complying the new applications requirements that will come along. Choosing the adequate technology is then crucial, depending on the required data rates, security, reliability level and many other criteria. These communication technologies can be split into two main categories regarding their communication medium: wired and wireless. • Wired communications: many wired technologies are used for SG communications, such as Power Line Communication (PLC), which uses the existing power lines for data transmissions. PLC main advantage is its existing infrastructure which decreases the installation cost of the communication infrastructure. Moreover, PLC technology is convenient for utilities from a security perspective since it will be controlling its own wired network. However, in PLC data rates are extremely variants and the communication medium suffers from high. © 2018 Tous droits réservés.. lilliad.univ-lille.fr.
(31) Thèse de Jad Nassar, Université de Lille, 2018. 2.2. The Smart Grids. 11. noise sources and interference [29]. Fiber optics are also a feasible wired technology in SG WAN applications mainly [30]. Data packets are transmitted through optical fibers with supported data rates between 155 Mbps and 160 Gbps [30]. Fiber optics have the ability of providing reliable, high performance and long distance communications with high data rates. However, their cost of deployment is extremely high compared to an already existing PLC infrastructure. Other wired technologies such as Ethernet, coaxial cables and Digital Subscriber Lines (DSL) communications are also used for data communications in SGs and mainly HAN and NAN [31]. With that being said, we can summarize that wired technologies are costly for wide area deployments but they may offer an increased reliability, capacity and security. • Wireless technologies: such as Zigbee, WiFi, Bluetooth, Microwave, WSN, LPWAN [31, 32], etc. These technologies enable connecting devices in a wireless way, eliminating the cost of installation of wirelines. They offer several advantages like their ease of deployments, scalability regarding the expandability of the network, resilience and robustness due to their ability to cope with node failures, infrastructure less and low cost in terms of material and deployment. However, wireless signals are generally significantly subject to transmission attenuation and environmental interference. Moreover, they are susceptible to electro magnetic interference in SG environments. To conclude, none of the wired or wireless technologies is suitable for all the application types, and there is always a technology that may be a best fit for a specific application. In this thesis, our motivation for using WSNs comes from the above mentioned advantages for wireless communications, and specially their ease of deployment and expansion. This has significant benefits with the rapid growth and apparition of distributed energy resources across the electric grid. Furthermore, their ability to interoperate with other technologies makes them a good candidate in an heterogeneous SG environment.. 2.2.2. Smart Grid communication network. SG promises to transform the current electric grid into a smarter network by operating with automatic control and smooth integration of renewable energy resources. For that, there is a clear need for communication networks supporting reliable information transfer between the various entities in the electric grid. Figure 2.1 shows a typical SG communication network architecture.. © 2018 Tous droits réservés.. lilliad.univ-lille.fr.
(32) Thèse de Jad Nassar, Université de Lille, 2018. 12. Chapter 2. State Of The Art. F IGURE 2.1: Smart Grid communication network [33]. It consists of a HAN, which is used to gather data from a variety of devices within the household, a NAN to connect smart meters to local access points, and a WAN to connect the grid to the utility system. In the following, a description of the different entities is provided alongside with the corresponding communication technologies used. • HAN is the first layer in the subsystem of the SG [34] that plays a critical role in the control of the home appliances, the proper use of electricity, and in lowering gas emission. HAN is used to gather data from a variety of heterogeneous devices within the household e.g., smart meters, in-home displays, home energy management systems. These devices have the potential to enable two-way energy flow communication between utilities and end-users. The data collected is then used by the utility company to obtain information about the global energy usage of the household. HAN connects devices using either wired technologies (e.g., coaxial cables, PLC, twisted pairs, fiber optics) or wireless technologies (e.g., WIFI, Bluetooth, LPWAN) [35, 32]. In most cases, wireless technologies are preferred due to their ease of deployments and remote control access, providing an independent or even a backup network to the current existing wired network. We note that at the same level of HAN we can find Building Area Network (BAN) and Industrial Area Network (IAN) [30] which are used for commercial and industrial customers with focus on building automation, heating, ventilating, air conditioning and other industrial energy management applications. • NAN forms data transmission bridges between utility backbone and households/buildings in a SG [36]. It connects smart meters to local access points for remote metering applications. This can be a network of smart meters and sensors creating a mesh, as well as a part of a mesh network collecting electricity data from multiple HANs and forwarding it to the backbone through NAN gateways. The version of this network which is deployed to collect data from power lines,. © 2018 Tous droits réservés.. lilliad.univ-lille.fr.
(33) Thèse de Jad Nassar, Université de Lille, 2018. 2.2. The Smart Grids. 13. mobile workforce, towers, etc. for power grid monitoring is referred to as Field Area Network (FAN) [37]. Different communication and networking technologies are deployed in NANs such as WSN, Broadband Power Line Communications (BPLC), fiber optics, etc. • WAN represents the backbone of the SG, it provides decision making in the control centers and the link between the grid and the core utility systems. WAN comprises two types of networks: Core and Backhaul. While the Core Network is used to connect the network of the utility and substations, the Backhaul Network is used to connect NAN to the core network and routes the data from the NANs to the private networks of the service providers. In most cases, the used technology in WANs is wired/optical and routing is handled by means of a public network such as the Internet or private lines [37]. These entities, having heterogeneous communication technologies and applications, will coexist and cooperate in order to deliver the data on a "multi-technology" SG network. This raises the importance of implementing adequate routing protocols that supports diverse technologies and traffic types.. 2.2.3. Smart Grids communication requirements. In a SG, the power grid infrastructure will coexist with an advanced communication system where extensive applications for consumers, manufacturers and utilities generate heterogeneous data types. In this vision, the potential promises of the SG are numerous [38], including the integration of a significant number of renewable energy resources and electric vehicles, increasing the energy efficiency and the available information for customers regarding their consumption, etc. In order to enable such facilities, the SGs communication network necessitate an efficient communication network with numerous requirements [31, 35, 39]. In the following, we outline some of the main requirements that should be satisfied by the SG communication network. • Reliability: One of the most important benefits of SG technologies is to improve the reliability of the electric grid [31]. Utilities will not introduce elements that could compromise reliability. Thus, the communication system should potentially guarantee data transfer according to specific requirements. Table 2.1 shows the reliability tolerance of the different SG applications where we can see that some highly critical traffic of DA, DSM, AMI, etc. require a reliability of more than 99.5%.. © 2018 Tous droits réservés.. lilliad.univ-lille.fr.
(34) Thèse de Jad Nassar, Université de Lille, 2018. 14. Chapter 2. State Of The Art • Scalability: Scalability is a critical requirement for SG networks and especially NANs where a huge number of heterogeneous devices are connected in large areas [36]. Moreover, sporadic Distributed Energy Resources (DERs) are deployed and could potentially be added within time. The network must then be capable to follow the expansion of the power system without the need of a complex infrastructure deployment. • Latency: Latency in SGs corresponds to the delay of data delivery between SG components. Table 2.1 shows the maximum allowed delays for the different SG applications, which reflects the required latency for these latter. Some critical applications may not tolerate any latency (e.g., DA critical traffic). For others latency is not critical (e.g., Network configuration traffic) [12]. • Traffic prioritization: SG applications are heterogeneous in terms of requirements and criticality. Some mission-critical applications may not tolerate any delay. Others like regular data collection could possibly have a bigger tolerance margin. Traffic prioritization is then crucial in order to route the different data and control packets within their tolerated QoS requirements. • Interoperability: SG components are heterogeneous and diverse. Interoperability is the ability of these components to work together and exchange information cooperatively [35]. This will enable an effective two-way communication and integration among the different interconnected elements of the SG. The National Institute for Standards and Technology (NIST) provides extensive details [40] about the interoperability frameworks, protocols and standards for SGs.. 2.2.4. Applications. In a SG, reliable and online information (e.g., command and control messages and instant information on the usage of the production units) becomes the key factor for efficient delivery of power from the generating units to the end users. The impact of equipment failures, capacity limitations, and natural accidents and catastrophes, which cause power disturbances and outages, can be largely avoided by online power system condition monitoring, diagnostics and protection [8]. These new applications have frequently been studied and presented in literature [10, 11, 12, 41], and many classification were made [1, 38, 39, 42]. In this section, we present five main SG applications. We study their main functionalities and advantages.. © 2018 Tous droits réservés.. lilliad.univ-lille.fr.
(35) Thèse de Jad Nassar, Université de Lille, 2018. 2.2. The Smart Grids. 15. • Advanced Metering Infrastructure (or AMI) consists of an integrated system of smart meters for measuring, collecting, analyzing and communicating energy consumption of smart appliances. Enabling twoway communication between utilities and customers and providing a number of important functions that were not previously possible or had to be performed manually. Such as the ability to automatically and remotely measure electricity use, connect and disconnect to a service, identify and isolate outages and monitor voltage. • Demand Side Management (DSM) consists of a set of interconnected and flexible programs which grant customers a greater role in shifting their own demand for electricity during peak periods, and reducing their overall energy consumption. DSM comprises two principal activities: – Demand Response (DR) or load shifting which aims to transfer customer load during periods of high demand to off-peak periods. The grid operator or other stakeholders influence the customers behavior mostly by monetary incentives, allowing them to participate in the energy market competition by changing their energy consumption approach instead of being passively exposed to fixed prices. This results in profits for both, the companies and the end-users. – Energy efficiency and conservation programs which allow customers to save energy while receiving the same level of end service, such as when they replace an old electric appliance with a more energy efficient model. • Distribution Automation (DA) is defined as the ability of taking an automated decision to make more efficient fault detection, isolation and restoration in a grid. This is done by remotely monitoring, controlling, manipulating and coordinating distribution, improving then the reliability across the grid. DA offers new features, it incorporates alarming and automated feeder switching, which in turn will help reduce the frequency and duration of customer outages. Substation automation is achieved through Supervisory Control And Data Acquisition (SCADA) systems which are able to make these automated decisions in real time by running algorithms based on the data they receive and orchestrate adjustments to optimize voltages and self-heal any failure issue. • Distributed Energy Resources (or DERs) such as photovoltaic cells, wind turbines and energy storage points present one of the main benefits in a SG. These DERs will be able to supply particular areas with. © 2018 Tous droits réservés.. lilliad.univ-lille.fr.
(36) Thèse de Jad Nassar, Université de Lille, 2018. 16. Chapter 2. State Of The Art electricity when they are isolated from the main power grid due to failure conditions or system and equipment failures. Moreover, these DERs foster the shift from a centralized power system towards a more decentralized one. This is achieved by contributing to the evolution of local grid areas served by one or more distribution substations and supported by high penetrations of DERs called microgrids. It is important to note that the introduction of these DERs located in sometimes unexpected places into the network raises challenges in managing, controlling and exchanging messages across the grid [1] due to their sporadic nature. • Electric transport via electric vehicles (PEV: Plug-in Electric Vehicles) or hybrid electric vehicles (PHEV: Plug-in Hybrid Electric Vehicles) aims to improve or even replace traditional transport by reducing emissions produced by fossil fuels. For that, an electric vehicle uses one or more electric motors that are powered by a rechargeable electric accumulator. SGs can better manage vehicle charging so that rather than increasing peak loads, the charging can be carried out more strategically. For example when electricity demand is low or when the production of renewable electricity is high. In the long run, SGs can use electric vehicles as batteries to store renewable and other sources of electricity for later use.. However, since these applications will generate different types of traffic (real-time, critical, regular) [13], they require different levels of QoS. Table 2.1 shows the diversity of delay tolerance and reliability for the different NAN applications [12]. Thus, for a WSN, different criteria have to be taken into consideration in order to achieve a proper communication with many requirements such as reliability, latency, auto-configuration, autoadaptation, network scaling and data prioritization [13].. 2.3. Routing protocols for Smart Grids. Several routing protocols were proposed for data routing in Smart Grids and particularly in NANs [20]. In the following, we briefly present some of the latest and mostly used ones. • LOADng (Lightweight On-demand Ad hoc Distance vector routing protocol, Next Generation) [43] is a reactive routing protocol that establishes routes towards the destination only on demand when there is some data to send. LOADng is an adapted version of the AODV protocol [44] to make it suitable for LLN. It uses flooding and RREQ/ RREP messages to establish routes within the network. LOADng. © 2018 Tous droits réservés.. lilliad.univ-lille.fr.
(37) Thèse de Jad Nassar, Université de Lille, 2018. 2.3. Routing protocols for Smart Grids. 17. Data traffic. Maximum allowed delay. Reliability. DA - Data related to the protection of the distribution network. <3 s. >99.5%. DERs - Data related to the protection of the distribution network. <4 s. <99.5 %. Critical traffic of: DA, DSM, AMI, DERs. <5 s. >99.5%. Electric transport. <10 s. >98%. Non critical traffic of DSM & AMI. <15 s. >98%. Non critical traffic of DA & AMI. <30 s. >98%. Network configuration traffic, normal AMI traffic. <5 min. >98%. Normal AMI traffic. <4 h. >98%. Network configuration traffic. < Hours/Days. >98%. TABLE 2.1: NAN requirements in terms of reliability[12]. main drawbacks [45] are the route discovery delay (during the routing discovery process, outgoing packets are stored in buffers which may cause losses in memory constrained devices). Flooding is also an issue in networks with limited autonomy devices (e.g., WSN) causing unnecessary battery depletion and collisions of control messages. • DADR (Distributed Autonomous Depth first Routing) [46] is a proactive distance vector routing protocol for path maintaining or path repair that adapts to link changes and minimizes control overhead in the network. It uses a lightweight mechanism to provide redundant paths for each destination and Depth First Search (DFS) guided by the routing table and backtracking mechanism for path recovery after link failures. However, loop detection false positive and false negative might occur if the Frame ID (FID) table is not well maintained (the FID table is used to store the previous sender and the next hop each time a packet is forwarded). DADR may also increase CPU and memory overhead on intermediate nodes due to additional mechanisms in the data-forwarding phase [20]. • GRACO (Geographic GReedy routing with ACO recovery strategy) [47] is a geographic routing algorithm that combines a pheromone-assisted greedy forwarding mode and an Ant Colony Optimization (ACO) based recovery mode. GRACO makes the routing decision using geographic greedy forwarding strategy. If it is not possible (if a packet arrives to a node that has no neighbor closer to destination than itself), an ACO based recovery strategy is launched to find the path. • HYDRO [48] uses a distributed algorithm that combines local agility with centralized control. It forms a Directed Acyclic Graph (DAG). © 2018 Tous droits réservés.. lilliad.univ-lille.fr.
(38) Thèse de Jad Nassar, Université de Lille, 2018. 18. Chapter 2. State Of The Art to provide multipath routing to a border router. Each node builds its default route table by adding its neighbor nodes towards a border router. The table entries are then ranked/ordered according to the link-layer packet success rate. Topology reports are sent with the periodic collection traffic, allowing border routers to build and maintain a global view of the topology. However, although these protocols may be suitable for some SG appli-. cations, their adaptation remains limited to SG heterogeneous applications with different QoS levels and traffic differentiation (some of them like the enhanced version of GRACO, QoS-GRACO [49], may be good candidates for future research directions in SGs). Therefore, RPL, our protocol of interest in this thesis fits well, due to its design, with low power and lossy environment applications including SG ones. Particularly, the multiple instance feature allows traffic differentiation in the network level alongside with customizable objective functions for the different traffic types. Moreover, RPL remains one of the most recognized standard protocols and widely used for SGs. It is compatible with the main operating systems of the Internet of Things (e.g., RIOT [50], Contiki [51]) which makes it a hot research topic for possible improvements. Indeed, RFC 8036 [19] explains how RPL can meet the requirements of SG applications and describes the different applications in SGs that can potentially be done through RPL multiple instances. Finally, my thesis work is part of the SoMel SoConnected project1 which has short term objectives, making RPL a good candidate in our research. In the next section, we provide an overview of the RPL standard covering the issues related to this thesis (readers may refer to [15] for the detailed RPL description). Later, we study the main proposed modifications and metrics related to RPL.. 2.4. RPL protocol: how does it work?. RPL is a proactif, distributed, distance vector routing protocol based on IPv6 for LLNs. It divides the network into multiple logical Destination Oriented Directed Acyclic Graphs called DODAGs. DODAGs are tree-like structures oriented towards the root/sink of the network built in order to avoid loops.. Rank in RPL As we can see in Figure 2.2, each node in a DODAG has a rank that defines its relative position with respect to a sink node of the DODAG. In other 1. © 2018 Tous droits réservés.. http://livetree.fr/. lilliad.univ-lille.fr.
(39) Thèse de Jad Nassar, Université de Lille, 2018. 2.4. RPL protocol: how does it work?. 19. words, it represents a distance from the root. The rank increases by going down the tree from the root.. F IGURE 2.2: Rank concept in RPL. RPL instances RPL can use multiple overlapping DODAGs over the entire network to provide different levels of QoS in the network layer. In this case, each level is called an instance. Here, few points should be mentioned: • An RPL network contains at least one instance which may be composed of one or more DODAGs. • A node can join only a single DODAG per instance, but it can participate in multiple instances to carry different types of traffic simultaneously. • An RPL instance is associated with an objective function in order to optimize the topology based on several metrics/constraints that may be link or node-based such as the shortest path, nodes battery level or the quality of the links.. RPL standard objective functions Minimum Rank with Hysteresis Objective Function (M RHOF ) [52] and Objective Function Zero (OF 0) [53] are the two standardized objective functions in RPL. M RHOF uses hysteresis while selecting the path with the smallest metric. © 2018 Tous droits réservés.. lilliad.univ-lille.fr.
(40) Thèse de Jad Nassar, Université de Lille, 2018. 20. Chapter 2. State Of The Art. value. It is designed to find the paths with the smallest path cost while preventing excessive churn in the network. It does so by finding the minimum cost path and switching to that path only if it is shorter (in terms of path cost) than the current path by at least a given threshold. M RHOF uses the Expected Transmission Count (ET X) metric [54] by default. OF 0 uses the "step_of_rank" to compute the amount by which to increase the rank along a particular link using static (hop count) or dynamic metrics (ET X). We note that Hop Count (HC) and ET X will be explained and analyzed later on in Section 2.5.2 in order to highlight the gaps of their use for SG applications.. DODAG and upward routes construction Whatever the used metric, a DODAG construction starts from the root by sending DODAG Information Object (DIO) messages to its neighbors (Figure 2.2). The DIO contains the metric/constraint used by the objective function and the rules to join a DODAG (e.g, DIO sending interval). Nodes will receive and process DIO messages potentially from multiple nodes (i.e. node 4 receiving DIO messages from node 2 and 3 in Figure 2.2) and make a decision to join the DODAG/graph or not according to the objective function and local policies (if existing). Once a node joins a graph, it automatically has a route towards the sink through its parent node. The node then computes its rank within the graph, which indicates its position within the DODAG. If configured to act as a root, it starts advertising the graph information with the new information to its own neighboring nodes. If the node is a leaf node, it simply joins the graph and does not send any DIO message. The neighboring nodes will repeat this process and perform parent selection, route addition and graph information advertisement using DIO messages. At the end of this process, only upward routes (i.e to the root) are built. RPL nodes can also send DODAG Information Solicitation (DIS) messages to solicit DIO messages from neighbors.. Downward routes construction To establish downward routes, a node must send a Destination Advertisement Object (DAO) to its parent containing prefix information of the nodes in its sub-DODAG, when the DAO message arrives to the root, the prefixes are aggregated and the downward routes are then built and made available to the parents, and so on. Here, two modes of operations are available: non storing and storing modes. In non storing mode, the node sends unicast DAO messages to the DODAG root which is aware of the whole topology. Routes on the way are not stored. A packet has to travel then the whole tree up to the root. © 2018 Tous droits réservés.. lilliad.univ-lille.fr.
(41) Thèse de Jad Nassar, Université de Lille, 2018. 2.5. RPL related work. 21. in order to be routed downward. In storing mode, each node must store routing information to reach all the destinations that are in its sub-DODAG. In this way, and unlike non storing mode, a packet may be routed downward through the next common parent node which is (normally) aware of the route to the concerned destination.. RPL trickle timer RPL message generation is timer-based, it uses the trickle algorithm [55] to control the DIO messages sending rate. The main idea of the trickle timer technique is to optimize the message transmission frequency based on network conditions. This frequency is increased when an inconsistency is detected in order to enable a faster recovery from a potential failure, and decreased in the opposite case. For example, when a node detects a loop in the network, it resets the trickle timer and send DIOs more often. Otherwise, the interval of the trickle timer increases as the network stabilizes which results in fewer DIO messages being sent in the network.. 2.5. RPL related work. Being a general standard, many researches are active around RPL in order to adapt it to different Internet of Things applications. Moreover many critical analysis were made to highlight the gaps concerning reliability and adequate metrics in a SG environment [56, 18, 57].. 2.5.1. SG based RPL proposed modifications. In [16], a modification of RPL is proposed to adapt it with AMI by using a new DAG rank computation based on ETX. The outward traffic (from sink to node) is implemented differently from traditional RPL by adding to each meter node a destination list containing (1) the id of the destination node; and (2) the ID of the last hop of the packet. In this way, each node will record all of its descendants in its destination list. The next-hop node ID will indicate the direction a packet has to take to reach the descendant node (in outward traffic from destination node to a source node). This produces less overhead since no DAO messages concerning downwards (outward) routes are sent anymore and that the proposed mechanism is purely based on handling the inward unicast data traffic. RPL specification provides the means necessary for any node operating on the same radio channel as the root node, to establish and maintain upward and downward routes in a tree.. © 2018 Tous droits réservés.. lilliad.univ-lille.fr.
(42) Thèse de Jad Nassar, Université de Lille, 2018. 22. Chapter 2. State Of The Art In [58], the authors address the possibility of using multiple radio chan-. nels in RPL for data forwarding. A mesh radio based solution is proposed to enable smart meters to automatically discover concentrator nodes in their vicinity: – Multiple trees were formed, each rooted at a different concentrator, with each concentrator in the radio neighborhood of each other using a different channel (as per the RPL specifications mentioned above). – In the beginning, the nodes select random channels. – After that, the nodes proceed to channel selection using DIO, DIS and OF to get the best channel rank to send data through it. – Once a loss of connectivity is detected a connectivity detection procedure is launched to select the next best channel to send the data through it. It is also important to note that in order to avoid repeating the whole scanning process in case of loss of connectivity, a probing process is used for the other channels when a smart meter node is in idle periods.. RFC 6551 [59] proposes several routing metrics to be used for path calculation in LLN, i.e the Throughput, Node Energy, Latency, Link reliability with the LQL (Link Quality Level) or ET X metric. In the following sections, we outline the main metrics that were proposed in literature to be used with RPL.. 2.5.2. ETX & HC: main metrics in RPL objective functions. ET X in M RHOF [52] and HC in OF 0 [53] are the two main metrics used in the objective functions. ET X finds paths with the fewest expected number of transmissions (including retransmissions) required to deliver a packet all the way to its destination [54]. Although ET X is reliable and widely used as a metric in WSNs, it does not take directly the latency into account which is critical in some SG applications [19]. ET X is not energy aware, thus for a link with few re-transmissions, ET X will keep sending packets on it without taking the decrease of battery nodes level into account. HC only takes the number of hops into consideration to calculate the best path, which is not always satisfactory in LLN.. 2.5.3. Energy aware and load balancing metrics for RPL. An energy-based objective function for RPL that uses the remaining energy as the main routing metric was proposed in [60]. It achieves a better load. © 2018 Tous droits réservés.. lilliad.univ-lille.fr.
(43) Thèse de Jad Nassar, Université de Lille, 2018. 2.5. RPL related work. 23. balancing compared to ET X and increases the network lifetime but with a lower delivery ratio. In [61], two MAC aware routing metrics are proposed to be used in RPL: R-metric and Q-metric. R-metric extends ET X by considering packet losses due to the MAC contention. Q-metric provides load balancing by selecting the lightest parent in terms of traffic load by solving an optimization problem and mainly considering reliability, transmission and reception power consumption. ETT-LB is proposed in [62]. It is based on the Expected Transmission Time (ETT) metric [63], which extends ET X by considering the link transmission rate and packet size, adding to it the Expected Delay Time (EDT), which is the average link load at a node in order to achieve load balancing.. 2.5.4. Multipe objective metrics for RPL. The authors in [64] propose NL-OF, an objective function based on a non linear length that constructs DODAGs from roots to nodes such that the non linear length is the smallest possible. They evaluate it using Cooja [65] simulator while considering three QoS parameters: End-to-end delay, packet loss and jitter. In [66], L2 AM metric is proposed. It is based on an combination of both data reliability (defined by ET X) and the nodes residual energy. Although their solution extends the network lifetime, it remains not adapted to a network with heterogeneous nodes and applications since it considers only one type of traffic and their model doesn’t take into account powered nodes. Metric combination is considered in several works for RPL. In [67] two combinations of two metrics are proposed: lexical and additive. In the lexical combination, the second metric is inspected if and only if the first one leads to equal paths, while in the additive combination the paths are calculated based on a different cost given to each metric. Fuzzy logic metric combination is proposed in [68, 69, 70] in order to be used for RPL. They combine several metrics like end-to-end delay, HC, link quality and battery level.. 2.5.5. Multiple instances. Multiple instances in RPL and QoS were studied in many works. In [71], two distinct objective functions for traffic differentiation are implemented using ETX for critical traffic and OF0 for the regular one. They compare their implementation to a single instance scenario using ETX metric. Their simulation results show that multiple RPL instances provide a better performance in PDR and latency. Others also consider ETX and HC for the different instances [17]. In [72] two types of nodes are proposed; T1 as regular. © 2018 Tous droits réservés.. lilliad.univ-lille.fr.
Figure
![Figure 1.1 shows the classical architecture of the SG (we note that some elements of this architecture may differ [2, 3] from a city or a country to another)](https://thumb-eu.123doks.com/thumbv2/123doknet/3622047.106419/22.892.122.768.318.590/figure-shows-classical-architecture-elements-architecture-differ-country.webp)
Documents relatifs
At this layer, the buyers wish to optimize their performance and meet their demand by buying energy from the PHEVs through the ag- gregators while the aggregators wish to
Glauner, et al., "Impact of Biases in Big Data", Proceedings of the 26th European Symposium on Artificial Neural Networks, Computational Intelligence and Machine
The formalism of semantic knowledge also allows for inconsistency detection, which is a real challenge in the domain of smart city where a piece of data will be used in many
The big data in Smart Grid is generated from various sources, such as (i) power utilization habits of users, (ii) phasor measurement data for situational awareness, (iii)
This paper characterizes a family of nonlinear ex post equilibria in a divisible double auction with only two traders, who have interdependent values and submit demand schedules..
The effect of this segregation on the mechanical properties is illustrated by the creep and recovery at – 22°C (Figure 5). The top of sealant 2A had a strain capacity of 4% under
These problems can be distributed into three well-known domains in the world of data, which are data security and privacy, data variety, and data volume.. The
I list technology solutions investigating behavioral change in the domain of smart home appliances (OpenFridge project), behavioral change towards reaching higher levels of
