T
T
H
H
È
È
S
S
E
E
En vue de l'obtention du
D
DO
OC
C
TO
T
OR
RA
AT
T
D
D
E
E
L
L’
’U
U
NI
N
IV
VE
E
RS
R
SI
IT
TÉ
É
D
DE
E
T
T
OU
O
UL
L
OU
O
U
SE
S
E
Délivré par l'Université Toulouse III - Paul Sabatier
Discipline ou spécialité : Physique et ingénierie des plasmas de décharge
JURY
Mr Tong Bao LI, Professeur et académicien, Université de Tongji Shanghai (Président et Rapporteur) Mr Dunpin HONG, Professeur, Université de d'Orléans (Rapporteur)
Mr David BUSO, Maître de conférence, Université de Toulouse (directeur de thèse) Mr Georges ZISSIS, Professeur, Université de Toulouse (co-directeur de thèse) Mr Dahua CHEN, Professeur, Université de Fudan Shanghai (co-directeur de thèse)
Mr Rong Qing LIANG, Professeur, Université de Fudan Shanghai (examinateur) Mr Shaolong ZHU, Professeur, Université de Fudan Shanghai (examinateur)
Ecole doctorale : Génie Electrique, Electronique, Télécommunications Unité de recherche : Laboratoire LAPLACE (UMR 5013)
Directeur(s) de Thèse : David BUSO, Georges ZISSIS Rapporteurs : Dunpin HONG, Tong Bao LI
Présentée et soutenue par Yang LIU
Le 02 Juin 2010
Acknowledgement
Special gratitude goes to Prof. Dahua Chen. Thanks for his care and support on my work and my life. I am not able to finish my PhD program without his considerable aid and supervision.
Special gratitude goes to Prof. Georges Zissis, Associated Prof. David Buso for their patient discussion and direction on my work. Also thanks for their bounteous help on my life in France, which makes it easier for me to fninish my work there. Thanks for their efforts during the preparation of thesis defence.
Appreciation also goes to Sounil, Robert, Anca and Jasmine. You are like my big family in France. The parties, the activities we joined together became important sources of happiness and enjoyment in France. You make my life in France colorful and impressive.
I should also thank Zein, Mohamad, Hughes, Julliens, Marie, Xiao Yu, Feihu Zheng, Dongchang Sun. You are all my good friends in France. Your accompanying is important for me.
Table of Contents
Table of Contents ...1
Abstract 3 Chapter 1 Introduction...5
1.1 Striations in gas discharge...5
1.1.1 Background ...5
1.1.2 Early research on striations ...6
1.1.3 Recent research on striations...16
1.2 Striations in low pressure rare gas and mercury discharge ...20
1.2.1 Introduction to fluorescent lamps...20
1.2.2 Research on striations in low pressure rare gas and mercury discharge...22
1.3 Efforts from the present thesis ...25
1.4 Creative points ...26
Chapter 2 Experimental investigation on moving striations in low pressure rare gas and mercury discharge ...34
2.1 Introduction ...34
2.2 Experiments ...34
2.2.1 Electrode heating...34
2.2.2 Spectra...38
2.2.3 ICCD High speed imaging ...49
2.2.4 Monochromator...52
2.3 Summary ...59
Chapter 3 Introduction to simulation of low pressure gas discharge...63
3.1 Introduction ...63
3.2 Category of models on low pressure gas discharge plasma ...64
3.2.1 Particle model...64
3.2.2 Kinetic model ...65
3.2.3 Fluid model ...65
3.2.4 Hybrid method ...67
3.3 Examples: simulation on low pressure gas discharge plasma ...67
3.3.1 Simulation on variation of plasma parameters versus cold spot temperature .67 3.3.2 Quantitative simulation on high frequency low pressure rare gas and mercury discharge 76 3.4 Summary ...83
Chapter 4 Kinetic model on striation in low pressure Ar-Hg discharge ...87
4.1 Introduction ...87
4.2 Model establishment and solution...87
4.2.1 Governing equations and macroscopic parameters of plasma ...87
4.2.2 Solution conditions...90
4.2.3 Numeric method...92
4.3 Results and discussion...94
Chapter 5 Conclusion ...107
Appendix AIntroduction to FEMLAB ...109
Appendix BElastic and inelastic collision cross sections of Ar and Hg ... 114
Appendix CMatlab code for the kinetic model (part) ... 118
Abstract
Stratified discharge was fisrt discovered by Michael Faraday in 1930s. Research on striations in low pressure gas discharge has witnessed considerable achievements. Nevertheless, most of the works focused on pure rare gas discharge, research on striations in AC discharge of gas mixtures still remains to be done. In the present thesis, investigation on moving striations in low pressure rare gas and mercury discharge is performed, where reasons and properties of this phenomenon are explored. By doing this work, we hope that reasons for this phenomenon can be discovered; properties of low pressure rare gas and mercury discharge can be better understood. Thereby, this phenomenon can be removed from fluorescent lamps in the future.
In our experiment, we collect emissive spectra of the lamp under different cold spot temperature. We find that strong moving striations always coincide with substantial ratio of rare gas radiation in total spectrum. Theoretical analyses reveal that moving striations in low pressure rare gas and mercury discharge are incurred due to dominance of stepwise ionization of rare gas atoms in ionization balance of the plasma. Then we perform high-speed imaging to the lamp with an ICCD cameara and find that moving striations only appear on the rising edge of lamp current. On the falling edge, the discharge is uniform. This phenomenon is rarely mentioned in previous works. We couple the ICCD cameara with a monochromator and record emissive atomic lines in the working period of the lamp. Results demonstrate that on the rising edge of lamp current, radiation from both rare gas atoms and mercury atoms is strong; on the falling edge, radiation from both species become weak. Therefore, we can expect that on the rising edge of lamp current, external electrical energy is injected into the plasma, which causes excitation and ionization frequently happen. During this periond, lack of mercury atoms may result in dominance of stepwise ionization of rare gas atoms in ionization balance, which incurs moving striations. In our theoretical investigation, electron response to spatially periodical electric field in low pressure Ar-Hg discharge is examined in the framework of kinetic theory. The simulation is based on non-local stead-state Boltzmann, which is numerically solved with Crank Nicholson scheme. Simulation results depict in detail the distribution of electrons with different energy in spatially periodical electric field and how non-local
effect influences the discharge. The EEDF can be divided into two parts: bulb part and tail part, which stand for slow electron and fast electron. These two kinds of electrons have different response to electric field. Slow electrons almost drift along the electric field, while fast electrons tend to collide with and pass their energy to Ar and Hg atoms. Simulation also infers that macroscopic parameters of the plasma such as normalized electron density, electron temperature, excitation frequency and ionization frequency react anomalously to the electric field, which provides the necessary motivation for the propagation of the fluctuation.
According to experimental and simulation results, major causes of striations come from stepwise ionization of metastable rare gas atoms dominating ionization balance. This leads to non-local EEDF, which enables amplification and propagation of instabilities. Therefore, the feasible method to eliminate striations is to suppress production of metastable rare gas atoms. This can be realized by increasing discharge current, increasing Hg vapor pressure; and increasing discharge frequency.
This thesis bears creative points as follow:
1. Provide electrode heating current to the lamp to suppress disturbances in cathode region; then proves that under the experimental condition, striations in low pressure rare gas mercury discharge are not originated from cathode region.
2. ICCD high speed imaging reveals that striations only appear on the rising edge of the light signal; on the falling edge, striations disappear.
3. Solve the Boltzmann numerically by Crank-Nicholson scheme and simulate electron response to spatially periodic electric field in low pressure Ar-Hg discharge. Motivation of propagation of striations is discussed.
Key words: moving striations, fluorescent lamp, low pressure rare gas and mercury discharge, metastable rare gas atoms, stepwise ionization
Chapter 1
Introduction
1.1
Striations in gas discharge
1.1.1
Background
Striations, or stratified instabilities, or ionization waves are the most common phenomena in gas discharge [1].They are featured by bright and dark intervals along the discharge axis (shown by Figure 1.1). Stratified discharge is first recorded by Michael Faraday in the 1930s; after that striations in different gas discharges under different conditions are discovered in succession [1].
Figure 1.1 Striations in Gas discharge
Stratified discharges can be categorized according to different criteria. If striations come themselves, they are named self-excited striations. If they are induced by artificial means, then they are called artificial striations. If the bright and dark intervals do not move, then we name them as standing striations; otherwise, we call them moving striations. For moving striations, if direction of the group velocity is toward cathode, then we say that it is positive striation; otherwise, we say that it is negative striation. According to the magnitude of group velocity, we can classify the striations into slow type striation (p-type) and fast type striation (r and s-type).Table 1.1 shows the comparison between group velocity of different moving striations in a Ne discharge, where the radius of discharge tube is 1 cm, filling gas pressure is 2 Torr
and discharge current is 3.4 mA.
Table 1.1 Comparison between group velocity of moving striations in a Ne discharge [1]
Type of Striations Group velocity (m/s)
p r s 231 1570 4520
Striations appear in many application fields and bring about negative influences. In laser cutting, striations may cause coarse cutting [2]-[4]. In lighting industry, striations seriously affect lighting effects; furthermore, the flickering frequency locates at sensitive area of human eyes, which leads to visual fatigue [5].
1.1.2
Early research on striations
Research on stratified discharges has a history over more than a century. We consider the period to be the early phase of research on striations, from the very beginning when Faraday recorded striations for the first time until 1960s Pekarek published reviewed papers [1] - [7] on striations. Most of the work during this time was mainly concentrated on self-excited striations. Existing condition, properties and factors that might influence stations consisted of the dominant part of the research. Theoretical efforts were also made. Later, artificial striations gradually became interesting topics. Measurement on properties of artificial striations and theoretical work were performed.
Research on self-excited striations——Ranges of occurrence
Pupp has found that for a fixed filling pressure if discharge current was beyond a certain value, striations in the plasma would disappear ([6], pp. 162). Therefore, he depicted the curve for this critical current and filling pressure (Figure 1.2). This curve is called the Pupp’s limit. From the figure we can see that critical current increases when gas pressure decreases. They comply with the equation as follow:
/ c
i =c p
where c is an empirical constant.
Figure 1.2 Pupp’s Limit
Zaitsev et al discovered that in Ne discharge there existed a special current-pressure region (current less than 20 mA and pressure less than 6 Torr), where striations did not appear ([6], pp.16). This region was entitled to be the Quiet Region. Achtergerg and Michel depicted this region, which is shown in Figure 1.3. The part enclosed by dash lines is the so-called quiet region. The solid lines mark the discharge condition for striations with the same frequency. Michel et al also found this region in Ar discharge; while Zaitsev discovered in He discharge the similar region ([6], pp. 166).
Figure 1.3 the Quiet region in Ne discharge depicted by Achterberg ([6], pp. 166) Pfau investigated striations in hydrogen discharge and depicted the i – p limit (shown by Figure 1.4) ([6], pp. 169). In the A area, observation with bared eyes came up with uniform discharge, but instrument detection revealed it to be stratified. In the B area,
standing striation often appeared, however sometimes, moving striations also appeared. In the C area, the discharge is uniform. In pure nitrogen discharge, Pfau found that the existing region of striations on the i – p plot was quite smaller. The size of this region was very sensitive to the radius of discharge tube. Figure 1.5 presents the existing region of moving striations in nitrogen discharge with tube radii of 0.55 cm and 1.55 cm.
Figure 1.4 Existing region of striations in hydrogen discharge with tube radius 1.1 cm. In area A there are moving striations; in area B there are standing striations; in area C
the discharge is uniform. ([6], pp. 169)
Foulds witnessed self-excited moving striations in Hg discharge when vapor pressure was less than 0.01 Torr. The striations were attenuated towards the direction of anode. He thought that disturbance in cold spot might be the reason for the phenomenon ([6], pp. 171). Bandelin excited artificial striations in Hg discharge and he found that the instabilities were damped along the direction pointing to anode. Thereby, he concluded that in Hg discharge, self-excited moving striations hardly came unless there were disturbances in cathode region ([6], pp. 171).
Hakeem and Robertson have found that in alkali metal vapor discharge there were no moving striations. Disturbances could be witnessed near anode region if strong anode oscillation came into being. But these disturbances did not survive for long distances. Rutscher and Wojaczek carried out research on gas mixtures. They witnessed obvious decrease in Pupp’s limit in a Ne discharge dosed by a small amount of He. However, if Ne and Ar were mixed with the ration of 1 to 4, then the Pupp’s limit of the discharge exhibited no differences with that of pure Ar discharge ([6], pp. 172). Gundermann found that adding little Ar to Ne led to significantly lower Pupp’s limit and striations were suppressed ([6], pp. 173). Garscadden et al observed moving striations in He-Ne laser. Its direction was from anode to cathode, its frequency was about 380 kHz and its group velocity was 3.15×10³ m/s, which was one order bigger than those of normal rare gas discharges. This might be due to higher axial electric field [8], [9].
Novak measured the distances between two bright intervals of striations (wavelength of the striation) and the electric field in this region in low current rare gas discharge [10]. He found that for a certain type of striation, the product ϕλ of its wavelength λ and the electric field E was constant. We called it the Novak’s Law. Figure 1.6 presents the λ - E relation of different striations in a Ne discharge with filling pressure 1.0 - 5.5 Torr and discharge current 0.2 - 8.0 mA. From the figure we can see that no matter the striations are fast or slow, they all obey the Novak’s Law well. Table 1.2 lists the ϕλ of the above Ne discharge and the deviations from the standard value. We can tell that measured ϕλ deviates little from the standard value.
frequencies locate at the same band. Therefore, anode oscillation was once considered to be the cause of striations. However, Pupp found in his experiment that striations in positive column remained the same even if anode oscillation was removed with an auxiliary electrode. This means that anode oscillation has nothing to do with striations [1]. Later efforts by Rademacher and Cooper also proved that there were no essential connections between anode oscillation and striations ([6], pp. 188).
Figure 1.6 Relation between wavelength and electric field in a stratified Ne discharge Table 1.2 Novak’s measurement on striations in a Ne discharge
Type of striations ϕλ(V) Number of points Average deviation (%) Maximum Deviation (%) p r s 9.20 12.67 19.48 105 34 13 1.6 2.7 0.94 7 9 2
Most of gas discharge plasmas have negative resistance property. Therefore, a ballast is needed to work with the discharge component. According to some research, frequency of moving striation is not determined by circuit parameters. Nevertheless, disturbances in circuit may be coupled to the plasma and become sources of instabilities. Stewart testified the above point by his experiments ([6], pp. 190). Lakatos and Bito considered the plasma as an equivalent LC series, and they deduced the condition under which the plasma was free from the circuit disturbance ([6], pp. 191).
which is tube radius. Pupp found that fitting striation frequency f and filling pressure p for discharges with different tube radii led to a curve deviating from most of the data points. If fitting with frequency×radius (f×r) and pressure×radius (p×r), almost all the data points locate on the same curve, which has no dependency on discharge current ([6], pp. 191). Kenjo and Hatta observed striations in a cone discharge tube. They found that wavelength of the striation had nothing to do with direction of discharge current and filling pressure. It only depended on n-th power of tube radius (n is between 1.5 and 2.0) ([6], pp. 193).
Besides tube radius, striations also depend on tube length. Gertzenstein and Potemkin proposed that self-excited striations resembled a self-oscillating system. Only when discharge gap was integral multiple of striation wavelength, might the oscillation in the system result in positive feedback, by which the oscillation could survive. Therefore, when discharge gap changed, wavelength of striation followed suit so that the system could kept its positive feedback ([6], pp. 194).
Research on artificial striations——Theoretical research
Watanabe and Oleson tried to use continuous equations and diffusive equations of electron and ion and disturbing method to infer wave number and frequency of striations. They found that when charged particles slightly suffered from dipole diffusion, striations might be incurred ([6], pp. 198).
Robertson used particle balance equations to deduce the cause of striations in DC rare gas discharge. His equation system included electron, ion and metastable atoms. Ionization balance not only took into account direct ionization of atoms from ground state, but it also included stepwise ionization. According to the simulation results, when there were no metastable atoms, local perturbation of electric field might cause variation in ionization frequency, which would propagate along the direction of electric field. This instability would be quickly damped due to dipole diffusion and volume recombination. If there were metastable atoms, the instability might not be easily attenuated and would be continuously propagated because these kinds of atoms could be easily ionized. This could be the reason for the appearance of striations in discharge ([6], pp. 200; [11]).
Stewart deduced radial distribution of electron density in Ar discharge from electron continuous equation and variable separation ([6], pp. 204):
2 2 0 a a D R R D AR r r r ∂ + ∂ + = ∂ ∂ 1.2 where R is radial distribution of electron density, Da is dipole diffusive coefficient, A is constant from variable separation. By assuming that electron density is zero at the tube wall, the solution R(r) of the above equation follows 0-class Bessel function. Compared the simulation with his measurement results, good agreement was found. He then concluded that even if there was moving striation along the discharge axis in the positive column, radial motion of electrons was dominant by dipole diffusion.
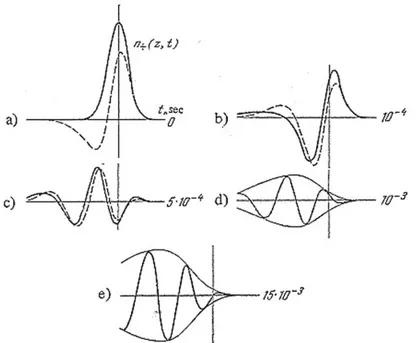
Pekarek researched propagation of pulse disturbance in plasma [1], [12]. In his simulation, he assumed a local instantaneous perturbation in the plasma, which led to variation of plasma density, electric field and electron energy in this region (shown by Figure 1.7). He considered that ionization rate coefficient was function of electron energy and charged particles were mainly lost by dipole diffusion. Then he got:
1 2 ( ) 2 ( ) a z a z n n D n A e n d t z ξ α ∞ − ξ ξ + + + + ∂ = ∂ + − ∂ ∂
∫
1.3 whereα =Z b kTϑ' 1 − /q0, A=Z b kT aϑ' 1( − 1 /q0 +E0), Zϑ' was electron energy derivative of ionization frequency. Figure 1.8 shows the solution of equation 1.3 in 15 ms after perturbation. Anode is on the left and cathode is on the right. From the figure we can tell that perturbation of ion density goes in the direction of anode, i.e. group velocity points to the anode. Motion of phase has the opposite situation, the direction of which points to the cathode.Wojaczek once pointed out that moving striations with small amplitude could be put into the form as ei Kx( −Ωt) ([1]; [6], pp.226). He also found in his experiment that only when the frequency of external excitation source was close to the frequency of self-excited moving striation, would artificial striation appear. Otherwise, local external disturbance would be quickly damped. This means that a dispersion curve may be used to describe the artificial striation. Wojaczek presented this relation as:
( , ) 0
1.4 where k is wave number, Ω is frequency. Normally, these two parameters are negative, thereby can be put as:
K = +k id Ω = +ω ϕi
1.5 where d is spatial amplification and φ the temporal amplification. In the range of discharge parameters in which moving striations of small amplitude are observed, the following inequalities always hold: d << k , ϕ << ω . Under this circumstance the wavelength is essentially determined by the frequency, i.e. k =k( )ω . Then equation 1.4 can be written as
Re ( , )F k ω = f k( , )ω =0
1.6
Figure 1.7 Pulse disturbance in a plasma where A is anode, K is cathode, n- is electron density, n+ is ion density, ρ is net charge density, e is electric field and θ is electron
energy.
Because plasmas have sharp frequency response to external disturbance, sources of perturbation with frequency far from central response frequency of the plasma contribute little to the appearance of striation. Therefore, if we assume external excitation follows the form of Dirac function, then we can get instantaneous wave
2 2 1 1 1 1 1 1 1 ( ' ) ( ' ) ( , ) exp{ }cos[ ] 4 2 4 4 z t z t C S z t t k z t g t b t B t ω ω ω ω ψ π − − = − + − + − 1.7 Finally, putting all the conditions together, we can get dispersion curve of artificial striation.
Figure 1.8 Development of pulse disturbance in 15 ms. Dashed lines correspond to later moment (0.01 ms later) than solid lines
Novak and Wojaczek excited artificial striation in Ne discharge in order to testify the aforementioned dispersion theory. In their experiment, gas pressure was 1.9 Torr and discharge current was 4.2 A. Figure 1.9 presents the measured wavelength-frequency relation of the artificial striation.
Figure 1.9 Wavelength-frequency relation measured by Novak and Wojaczek Rutscher assumed that wave number k is function of frequency ω, i.e. k = f( )ω . He expanded this relation near the optimum frequency ω0 and finally obtained the dispersion relation as follow:
2 0 0 0 0 1 ( ) ( ) k k b u ω ω ω ω = + − + − 1.8 where k0, ω0, u0, b could be acquired through experiment. Figure 1.10 depicts Rutscher’s dispersion curve of artificial striation ([6], pp. 241).
Figure 1.10 Dispersion curve of artificial curve calculated by Rutscher. The radius of discharge tube is 2 cm, filling pressure is 1.4 Torr and discharge current is 5 mA.
Circles on the figure were measured wave number and frequency [6]
Other references on striations include: Lee and his colleague’s efforts on essence of artifical striation [13]; Ewald and Duncan’s research on striations in the positive column of low pressure gas discharge with magnetic field [14]-[16]; Drouet measured electron temperature in striations [17]; Garscadden’s research on properties and dispersion curve of striations in He-Ne laser [18]-[20]; Gentle’s experimental and theoretical efforts on striations [21][22]; Munt’s simulation on striation propagation [23]; Nakata’s research on striation dispersion [24]; Watanabe and Olesen’s efforts
[25]; Takeyama’s measurement on striations in high frequency discharge [26][27].
1.1.3
Recent research on striations
In 1970s, as research on striations going deeper, scientists found that electron kinetics became inevitable in analyzing reasons and mechanisms of striations [28]. Therefore, kinetic theory was more and more involved in research of striations.
Rohlena et al composed an equation system with Boltzmann equation (BE) of electron and fluid equations of metastable atoms and ions in order to describe the moving striation in ne discharge [29], [30]. He found six solutions from the system which corresponded to six different types of striations. Four of them then had been discovered (three types were correlated with electron spatial resonance, the other one were the result of spatial drift of metastable atoms).
Rayment measured temporal variation of the electron energy distribution function (EEDF) of different types of moving striations (p, r and s type) in Ne discharge [31]. He found that under small discharge current, p, r and s-type striation came from the spatial resonance of electrons. This mechanism also provided explanation to Novak’s Law. Under big discharge current, colossal electron – electron (coulomb collision) collision might weaken temporal variation of EEDF. Under this condition, striations occur due to variation of ionization rate along with electron density.
Skoblo et al numerically solved the BE and simulated striations in 1 Torr Ne discharge. They analyzed modulation depths of electron density, electron temperature and other plasma parameters corresponding to different striations. Meanwhile, they deduced s and p type moving striation; and they also proved that r type striation resulted from electron spatial resonance [32].
Tsendin solved the BE in a spatially periodic electric field [33]. He put the problem into space-total energy (kinetic energy + potential energy) phase space and assumed that once electrons’ kinetic energy exceeded excitation level of atoms, electrons lost their energy by inelastic collision with the atoms. That means there is a “black wall” in the phase space, none of the electrons bore energy bigger than excitation level of
and fast electrons exhibited non-local behavior. Therefore, he attributed appearance of striations to this non-local effect of EEDF.
Golubovskii developed Tsendin’s theory: he dropped the “black wall” assumption and solved the BE in a spatially uniform and spatially periodic electric field [34]. He found that in the absence of channels of energy dissipation connected with energy loss in elastic impacts and in the presence of several excited states, information about the initial EDF injected in a field of arbitrary configuration, can be transmitted over an unlimited distance. The process of the relaxation has the nature of undamped oscillations. The introduction of channels of energy dissipation results in a damped oscillatory relaxation character of the EDF injected into a uniform field and in the establishment of a homogeneous EDF in this field. The relaxation of an EDF injected into a spatially periodic resonance field (shown by Figure 1.11, where z is spatial coordinate, ε is total energy of electron) results in the distribution function having specific maxima which change in energy and coordinates along the resonance paths in accordance with the potential distribution (the so-called bunching effect). This effect can be used for the interpretation of EDF formation in S- and P-striations in inert gas discharges at low pressures and currents [35]. He also pointed out that non-local effect of EEDF might lead to phase difference between electron density peak and ionization frequency nadir, which provided the necessary motivation for striations. In [36] and [37], he researched the electron kinetics and density of excited atoms in s and p-type striation. In [38], he simulated striations in intermediate pressure rare gas discharge. In [39], he measured the temporal and spatial variation of axial and radial plasma potential in s and p-type striations in low pressure Ne discharge. In [40], measurement and simulation on the r striation in Ne discharge were performed. In [41], research on s and p striation in Ne discharge based on kinetic theory was performed.
Signeger and Winkler devised a numerical method to solve the BE based on Crank-Nicholson scheme [42].With this method hey performed detailed theoretical investigation on s and p-types striation in DC glow discharge [43] [44]. They found that the initial injected EEDF would evolve into a certain distribution, which was only determined by the spatially periodic electric field. Changing the initial EEDF would not influence the final distribution of the EEDF.
Figure 1.11 The Phase space used by Golubovskii to solve the BE in [34]
Arslanbekov performed 2D simulation on moving striation in lower pressure DC Ar discharge [45]. His model was based on continuous equations of all particles and Poisson Equation. Rate coefficients and diffusive coefficients of electron were beforehand obtained by solving BE. The simulation result is shown in Figure 1.12. Arslanbekov thought that ionization frequency’s dependency on electron density was the reason for the appearance of striation.
Siefert carried out diagnostics on electron density in a low pressure Ar discharge with microwave technology [46]. The subject plasma presents self-excited striation. According to the measurement, electron density in the positive column varied periodically with time (shown by Figure 1.13) and peaks of electron density did not coincide with that of the metastable Ar. Siefert supposed that stepwise ionization of Ar atoms was the main reason for the self-excited striation.
Sukhinin and Fedoseev established a 1D self-consistent model of striation in a Ne plasma [47]. The discharge pressure was 1.6 Torr, average electric field was 4 V/cm, and discharge gap was 20 cm. Electron was described with kinetic theory, ions followed the continuous equation and electric field obeyed the Poisson Equation. The model did not take into account excited atoms. Results revealed that electric field and particle density in striation evolved periodically in space. But the profile of these parameters deviated from sinusoid. Departure from electric neutrality i.e. ( i e)
i
n n
n
− ranged between 100 and 0.001.
Figure 1.13 Temporal variation of electron density in low pressure Ar discharge diagnostic by microwave technology by Siefert [46]
LEE et al researched mechanism of striations in PDP (Plasma Display Panel). They thought that accumulation of charged particles on anode surface and non-local effect of electron kinetics contributed together to the appearance of striation [48], [49]. Muraoka et al performed simulation on striations in PDP and results agreed quite well
with previous experiments [50].
Recent research on striations also include: Feng He’s research on striations in PDP [51] [52]; Iza’s research on formation mechanism of striations in PDP [53]; Ohe’s efforts [54]-[57]; Muraoka’s simulation on striations in PDP [58]; Nerushev’s research on stratified spherical discharge[59]; Sergey’s efforts on striations in spherical discharge [60]; Dinklage’s simulation on hysteresis in striations [61]; Kumar’s research on pillared striations in Ar surface wave plasma [62]; Shkurenkov’s simulation [63]; Bae’s fluid model on striations in PDP [64]; and Yang’s research on striations in PDP anode region [65].
In the year 2006, Kolobov summarized progresses in research on striations since 1970s [28]. He pointed out that our newly obtained insight into striation mainly came from the development of electron kinetic theory and computer science. Meanwhile, he called for attention to striations in some new modes of discharges such as DBD. Kolobov thought that diagnostic on plasma through striation might be feasible since electron density and ionization processes were all very sensitive to striation. Therefore, in the future, striation might accord us with deeper understanding of plasma sources.
1.2
Striations in low pressure rare gas and mercury
discharge
1.2.1
Introduction to fluorescent lamps
In the year 1938, George Inman and his research group in GE invented low pressure Hg vapor discharge lamp, i.e. linear tube fluorescent lamp. Afterwards performance of this kind of lamp was greatly improved due to the development of science and technology. Now, fluorescent lamps have become the most widely used light sources.
Fluorescent lamp can be classified according to many standards: judging by tube shapes there are linear tube fluorescent lamps, compact fluorescent lamps, ring-like fluorescent lamps; judging by tube radius, there are T12, T8, T5 and T2 lamps; judging by working frequency, there are DC fluorescent lamps, low frequency AC fluorescent lamps, high frequency AC fluorescent lamps; judging by discharge
mechanism, there are electroded fluorescent lamps, inductively coupled fluorescent lamps and DBD fluorescent lamps.
Figure 1.14 Inside a fluorescent lamp
The structure of linear tube fluorescent lamp is shown in Figure 1.14. The discharge chamber is enclosed by a glass shell, inside which there fills rare gas and mercury. Hg is the main player of discharge; while rare gas (Ar or Ar, Kr mixture) ensures the necessary electrical properties. Discharge is excited by the electrodes located on the both end of the lamp. UV radiation produced by the excited Hg atoms will be transferred into visible light by the phosphor coated on the inner wall of the tube. Early lamps often use calciumhalophosphate phosphor. It is less expensive but suffers from low efficacy and low stability. Now triband phosphor becomes prominent due to its high maintenance of flux, high efficacy and high color rendering. Correlated color temperature of the lamp may also be changed by altering the composition of the phosphor.
Fluorescent lamp has negative resistance property, therefore should be operated with a ballast. Figure 1.5 presents typical working circuit of a fluorescent lamp driven by line power. Because ignition of the lamp requires high voltage, there is no current inside the lamp right after the switch is on. The line power is directly applied on the starter. Afterwards a high voltage will be produced by the ballast on the both ends of the lamp so that discharge is established. Once the lamp begins to work, starter will stop working.
Figure 1.15 Typical circuit of a low frequency AC operated fluorescent lamp
1.2.2
Research on striations in low pressure rare gas and
mercury discharge
Donahue and Dieke did research on striations in low pressure Ar-Hg discharge ([6], pp. 172). Measurements were made, however, for only a few isolated mixtures (saturated mercury vapor in 4 Torr argon and in 15 Torr of argon and neon, in tubes of diameter 15 and 13 mm, respectively). Moving striations were found over the entire range of investigation, up to 60 mA discharge current. No control was maintained over the mercury partial pressure, and cataphoretic separation of gases was not mentioned.
Oleson and Found observed the upper critical current for a discharge in 7 Torr argon with saturated vapor pressure of mercury at 40 centigrade maintained in a water bath. The critical current in this case showed a hysteresis effect, changing from 0.25 A when approached from above (i.e., from the homogeneous condition) to 1.4 A when approached from below ([6], pp. 172).
Rutscher and Wojaczek reported a stabilizing effect on the discharge (i.e., suppression of the moving striations) due to the addition of mercury to discharge in the inert gases in a tube of 14 cm diameter. In view of the measurements already discussed, such a stabilizing effect must be strongly dependent on tube geometry ([6], pp. 172).
Yoshimoto have deduced wave function of light intensity due to striation in an Ar-Hg discharge. However, he did not give any numeric results ([6], pp. 202).
Van den Heuvel has done research on artificial striation in low pressure Ar-Hg discharge [66]. The discharge tube is 0.6 m long with diameter 12 mm. Inside the tube there fills 400 Pa Ar and saturated Hg. Figure 1.16 shows the experimental circuit. The discharge tube is connected with a DC source. An oscillation source, an adjustable resistor and a capacitor are connected in parallel with the discharge tube. The oscillation source and capacitor are used to excite striation in the discharge. The resistor can control the feedback from the external circuit. Light output from the lamp is collected by a photomultiplier. Van den Heuvel found that in his experiment the striation came from the current oscillation in cathode region. Feedback from the external circuit played an important role in the formation of striation.
Figure 1.16 Circuit layout in van den Heuvel’e experiments [66]
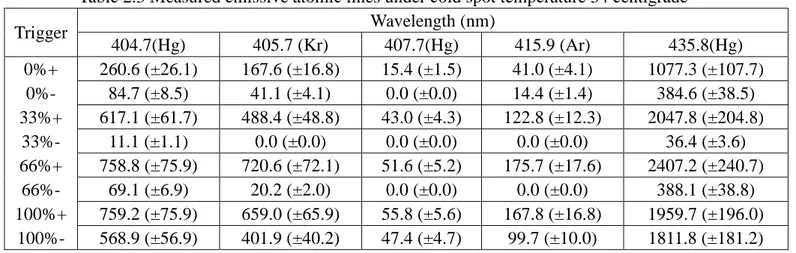
Kajiwara and Anzai once investigated moving striations in low pressure Kr-Hg discharge driven by 50 Hz 200 V AC source [67]. In their experiment, discharge tubes were filled with 1 – 5 Torr Kr and saturated Hg. They measured wavelength, frequency and other parameters of the striations under different cold spot temperature. Table 1.3 summarized relation between frequency and wavelength of striations for different Kr pressure. They put forward that Kr filling pressure and cold spot temperature of the discharge tubes might shed important influences on striations. Given the striation frequency’s relation with cold spot temperature and discharge current, they categorized striations in their experiment into r-type moving striation. What was noted also was that when striations appeared, excitation and ionization of Kr became more frequency; radiation from Hg atoms became weaker.
Table 1.3 Measurement of frequency and wavelength of striations under different cold spot temperature and Kr filling pressure by Kajiware et al [67]
Kr pressure * 5 ℃ 10 ℃ 15 ℃ 20 ℃ 25 ℃ 30 ℃ 35 ℃ f(Hz) 200 250 280 380 550 690 900 1 Torr λ (cm) 9.2 8.8 8.6 7.8 7.0 5.3 5.0 f(Hz) - 200 200 250 350 520 - 2 Torr λ (cm) - 7.5 7.3 7.0 6.0 4.7 - f(Hz) 200 220 240 280 340 560 - 3 Torr λ (cm) 6.2 6.2 6.0 5.5 5.0 4.8 - f(Hz) - - 200 210 250 420 - 4 Torr λ (cm) - - 6.1 6.1 5.5 4.4 - f(Hz) 200 200 200 200 200 240 500 5 Torr λ (cm) 4.0 4.0 4.0 4.0 4.0 4.0 3.8
Kajiwara and Sano measured moving striations in T8 fluorescent lamps under different cold spot temperature [68]; they also analysed how striations were incurred and propagated [69]. Kajiwara et al thought that when cold spot temperature was low, Hg atom density inside the lamp went lower, which resulted in more electron collision with Ar. Since Ar has much higher excitation and ionization level than Hg, higher electron temperature was needed in order to sustain the discharge. Especially, under AC condition, lamp current passed zero periodically and the lamp must restart. In this period, disturbances might appear due to high electron temperature, thus became source of instabilities.
Bian and Zhu deducted dispersion relation from particle continuous equations and disturbing method, based on which wavelength, velocity, spatial amplification, and temporal amplification were calculated under different cold spot temperature [70]. Experiments were also made to verify the calculation. Table 1.4 lists calculation results.
Table 1.4 Parameters of striations versus cold spot temperature calculated by Bian et al Cold spot temperature ℃ Wavelength cm Wave number m-1 Velocity m/s Spatial amplification cm-1 Temporal amplification s-1 15 10 62.8 90.0 ~ 100 0.2 1800 ~ 2000 20 9.5 66 85.5 ~ 95 0.2 1710 ~ 1900 24 8.4 75 75.6 ~ 84 0.19 1436 ~ 1596 30 6.8 92.4 61.2 ~ 68 0.19 1162 ~ 1292 35 5.5 114 49.5 ~ 55 0.19 940 ~ 1045 40 4.1 153 36.9 ~ 41 0.19 701 ~ 779
Zhang and Zhu measured Hg atomic lines in the bright and dark parts of striations in a T8 fluorescent lamp by using monochromator and photomultiplier. Correlated theoretical analyses were also developed. According their results, bright parts of the striations had higher electron temperature (difference of electron temperature between bright part and dark part of the striation was about 900 K), higher electric field and higher density of excited atoms [70].
Langer et al investigated variation of propagating speed of ionization waves versus voltage and gas composition in a DC fluorescent lamp with serials of photomultipliers [72]. Results revealed that negative charged particles accumulated on discharge tube wall might strongly affected propagation of ionization waves. Different buffer gas might also influence ionization waves: gases with smaller elastic collision cross sections coincide with faster ionization waves.
1.3
Efforts from the present thesis
Research on striations has passed more than a century. Major efforts were poured in pure rare gas discharge due to simple atomic structure and rich atomic data. Fluorescent lamps are the most widely used light sources nowadays. They are based on low pressure rare gas and mercury discharge, in which striations may also be found sometimes, especially when current is low or ambient temperature is low. Compared
with research works on striations in rare gas discharge, correlated efforts on rare gas and mercury discharge appear to be minor. Experimental and theoretical work is urgently needed. In the present article, we will make our efforts to clarify the reasons for the appearance of moving striation in low pressure rare gas and mercury discharge. New experimental and theoretical method will be used. We hope that we can gain deeper understanding of low pressure rare gas and mercury discharge and make good preparation for eliminating striations from fluorescent lamps.
In this thesis we will carry out experimental and theoretical research on moving striations in a 50 Hz AC operated rare gas and mercury discharge lamp (A T8 fluorescent lamp ballasted by a magnetic gear). The first chapter of the article introduces background and state of art of striations. In the second chapter, we will try different methods to investigate properties of the striation in the experimental lamp and try to find out the possible reasons for this phenomenon. In the first experiment, extra heating current will be provided to the lamp to suppress disturbances in cathode region. We will check if striations are incurred by disturbances in cathode region. In the second experiment, we collect emissive spectra of the lamp under different cold spot temperature. We will see how cold spot temperature may influence the striation. In the third experiment, variation of striation in the working period of the lamp is recorded by a high speed ICCD camera, based on which analyses will be made. In the fourth experiment, a monochromator is coupled with the ICCD camera to collect atomic radiation in the working period of the lamp. Then further analyze on the third experiment will be performed. All the experiments were accomplished in LAPLACE, University Paul Sabatier, France. The third chapter introduces commonly used plasma models: single particle model, collisional-radiative model (CR model), fluid model and kinetic model. Examples are also provided. The fourth chapter provides kinetic explanation on striations. Electron response to spatially periodic electric field will be investigated. In the final chapter, summary of the entire thesis will be given.
1.4
Creative points
cathode region; then proves that under the experimental condition, striations in low pressure rare gas mercury discharge are not originated from cathode region.
2. Trigger the high speed ICCD camera with light output of the lamp and record variation of striation in the working period of the lamp. It turns out that striations only appear on the rising edge of the light signal; on the falling edge, striations disappear. Couple the monochromator with ICCD and trigger the system with light output of the lamp. Atomic radiation from the lamp during the working period of the lamp is recorded.
3. Solve the Boltzmann numerically by Crank-Nicholson scheme and simulate electron response to spatially periodic electric field in low pressure Ar-Hg discharge.
References
[1] Pekarek L. Ionization waves (Striations) in a discharge plasma [J]. Soviet Physics Uspekhi, 1968, 11(2): 188-208.
[2] Wee L M,Crouse P L,Li L. A statistical analysis of striation formation during laser cutting of ceramics [J]. Int J Adv Manuf Technol,2008,36:699-706.
[3] Sobih L,Crouse P L,Li L. Striation-free fibre laser cutting of mild steel sheets [J]. Appl. Phys. A,2008,90:171-174.
[4] KOIWAI TOMOYUKI,et al. Observation of the striation formed on the laser cutting surface of mild steel plates [J]. Nihon Kikai Gakkai Tokai Shibu Chiku Koenkai Koen Ronbunshu,2003,2003:64-65.
[5] Masaki Ogata, Kazuhiko Ukai, and Takashi Kawai. Visual Fatigue in Congenital Nystagmus Caused by Viewing Images of Color Sequential Projectors [J]. Journal of Display Technology,2005,1(2):314.
[6] Oleson N L, Cooper A W. Moving Striations [J]. Advances in Electronics and Electron Physics, 1968, 24: 155-278.
[7] Nedospasov A V. Striations [J]. Soviet Physics Uspekhi,1968, 11(2):174-186. [8] Garscadden A, Bletzinger P. Moving Striations in a He-Ne Laster [J]. Journal Applied Physics, 1964, 35(12): 3432-3433.
[9] Garscadden A. Moving Striations and Cataphoretic Effects in a He-Ne Laser [J]. Applied Physics Letter, 1966, 8(4): 85-87.
[10]Novak M. Spatial Period of Moving Striations As Function of Electric Field Strength in Glow Discharge [J]. Czech. J. Phys. B, 1960, 10:954-959.
[11]Robertson H S. Moving Striation Direct Current Glow Discharge [J]. Physical Review, 1957, 105(2): 368-377.
[12]Pekarek L. The Development of A Pulse-Disturbance in a DC Discharge Plasma [A]. Proc. 6th Int. Conf. Ion. Phen. Gas.,Paris [C], 1963, 2: 133-136.
[13]LEE D A,Bletzinger P,Garscadden A. Wave nature of moving striations [J]. Journal of Applied Physics,1966,37(1):377-398.
[14]Ewald H N,Crawford F W,Self S A. Low-frequency waves and instabilities on the positive column in a magnetic field I.analysis and study of axisymmetric modes [J]. The Physics of Fluids,1969,12(2):303-315.
[15]Duncan A J et al. Low-frequency waves and instabilities on the positive column in a magnetic field III.experiments on the m=1 azimuthal mode [J]. The Physics of Fluids,1969,12(2):2607-2615.
[16]Duncan A J et al. Low-frequency waves and instabilities on the positive column in a magnetic field V. axisymmetric ionization waves [J]. The Physics of Fluids,1969,14(9):1973-1983.
[17]Drouet J. Direct display of electron temperature variation in moving striations [J]. J. Sci. Instrum.,1967,44:1023-1024.
[18]Garscadden A,Bletzinger P. Moving striations in a He-Ne laser [J]. Journal of Applied Physics,1964,35(12):3432-3433.
[19]Garscadden A. Moving striations and cataphoretic effects in a He-Ne laser [J]. Applied Physics Letters,1966,8(4):85-87.
[20]Garscadden A,Bletzinger P. Dispersion and stability of moving striations [J]. The Physics of Fluids,1969,12(9):1833-1844.
[21]Gentle K W. Moving striations in the Ar positive column I. theory [J]. The Physics of Fluids,1966,9(11):2203-2211.
[22]Gentle K W. Moving striations in the Ar positive column II. experiments [J]. The Physics of Fluids,1966,9(11):2212-2218.
[23]Munt R,Ong R S B,Turcotte D L. On the propagation of ionization waves [J]. Plasma Physics,1969,11:739-749.
[24]Nakata J et al. Dispersion relation of moving striation [J]. J. Phys. Jan. Japan,1964,19:143-144.
[25]Watanabe S,Oleson N L. Travelling density waves in positive columns,1955,Physical Review,99(6):1701-1704.
[26]Takeyama M. Moving striation in microwave discharge plasma [J]. J. Phys. Soc. Japan,1961,16:1255.
[27]Takeyama M. Moving striation in high frequency discharge plasma [J]. J. Phys. Soc. Japan,1966,21:2415-2416.
[28]Kolobov V I. Striations in Rare Gas Plasmas [J]. Journal of Physics D: Applied Physics, 2006, 39: R487-R506.
[29]Garscadden A. Ionization Waves in Glow Discharges [A]. In: Merle N Hirsh, Oskam H J. Gaseous Electronics [M]. New York: Academic Press, 1978: 65-105. [30]Rohlena K, Ruzicka T, Pekarek L. An Exact Theory of Ionization Waves (Striations) [J]. Physics Letters, 1972, 40A(3): 239-241.
[31]Rayment S W. The role of the electron energy distribution in ionization waves [J]. Journal of Physics D: Applied Physics, 1974, 7: 871-879.
positive column of a discharge [J]. Physical Review E, 2005, 72: 026414.
[33]Tsendin L D. Electron kinetics in non-uniform glow discharge plasmas [J]. Plasma Sources Sci. Technol, 1995, 4: 200-211.
[34]Golubovskii Y B, Porokhova I A, Behnke J, Nekutchaev V O, On the bunching effect of electrons in spatially periodic resonance fields [J]. Journal of Physics D: Applied Physics, 1998, 31: 2447-2457.
[35]Golubovskii Y B, Maiorov V A et al. On the Non-local Electron Kinetics in Spatially Periodic Striation-like Fields [J]. Journal of Physics D: Applied Physics, 1999, 32: 1391-1400.
[36]Golubovskii Y B, Kozakov R V et al. Nonlocal Electron Kinetics And Densities Of Excited Atoms In S And P Striations [J]. Physical Review E, 2000, 62(2): 2707-2720.
[37]Golubovskii Y B, Maiorov V A et al. On The Density of Metastable and Resonance Atoms In A Stratified Positive Column In Neon [J]. Journal of Physics D: Applied Physics, 2001, 34: 1963-1973.
[38]Golubovskii Y B, Maiorov V A et al. Kinetic model of ionization waves in a positive column at intermediate pressures in inert gases [J]. Physical Review E, 2001, 63: 036409-1 - 036409-10.
[39]Golubovskii Y B, Kozakov R V, Wilke C et al. Oscillations of the positive column plasma due to ionization wave propagation and two-dimensional structure of striations [J]. Plasma Sources Sci. Technol., 2004, 13: 135–142
[40]Golubovskii Y B,Skoblo A Y. The Structure of the Electron Distribution Function in R Striations [J]. Technical Physics Letters,2007,33(8):711-714.
[41]Golubovskii Y B,Kozakov R V,Nekuchaev V O,Skoblo A Y. Nonlocal electron kinetics and radiation of a stratified positive column of discharge in neon [J]. J. Phys. D: Appl. Phys.,2008,41:105205(9pp).
[42]Sigeneger F, Winkler R. Response of the Electron Kinetics on Spatial Disturbances of the Electric Field in Nonisothermal Plasmas [J]. Contrib. Plasma Phys., 1996, 36(5): 551-571.
[43]Sigeneger F, Golubovskii Y B. On the Nonlocal Electron Kinetics in s- and p-Striations of DC Glow Discharge Plasmas: I. Electron Establishment in Striation-like Fields [J]. Plasma Chemistry and Plasma Processing, 1998, 18(2): 153-180.
of DC Glow Discharge Plasmas: II. Electron Properties in Periodic States [J]. Plasma Chemistry and Plasma Processing, 2000, 20(4): 429-451.
[45]Arslanbekov R R, Kolobov V I. 2-D Simulations of Striations in Direct Current Glow Discharges in Argon [J]. IEEE Transactions On Plasma Science, 2005, 33(2): 354-355.
[46]Siefert N S, Sands B L, Ganguly B N. Electron and metastable state interactions in two-step ionization waves [J]. Applied Physics Letter, 2006, 89: 001502-1 – 001502-3.
[47]Sukhinin G I, Fedoseev A V. A Self-Consistent Kinetic Model of the Effect of Striation of Low-Pressure Discharges in Inert Gases [J]. High Temperature, 2006, 44 (2): 157-165.
[48]Iza F, Yang S S, Kim H C, Lee J K. The mechanism of striation formation in plasma display panels [J]. Journal Of Applied Physics, 2005, 98: 043302.
[49]Lee J K, Dastgeer S et al. Striation mechanism and triggered striation in dielectric microdischarge plasma [J]. Jpn. J. Appl. Phys., 2001, 40(2): 5B, L528-L531. [50]Muraoka K, Azumi M, Suzuki K et al. A model for striation formation in ac PDP discharges [J]. J. Phys. D: Appl. Phys., 2006, 39: 2135–2139.
[51]Jiting Ouyang,Feng He et al. Striation in large-gap coplanar plasma display cells [J]. Physics Letters A,2007,360:619–623.
[52]HE Feng et al. Effect of Wall Charge on Striation in Plasma Display Cells [J]. Plasma Science and Technology,2007,9(2):198-201.
[53]Iza F,Yang S S,Kim H C,Lee J K. The mechanism of striation formation in plasma display panels [J]. Journal of Applied Physics,2005,98:043302.
[54]Ohe K,Takeda S. Two modes of moving striations in neon glow discharge [J]. J. Phys. D: Appl. Phys.,1978,11:2257-2265.
[55]Ohe K,Hashimoto M. Evolution of nonlinear ionization wave packets excited in glow discharges [J]. Phys. Fluids.,1984,7:1863-1868.
[56]Ohe K,Hashimoto M. Propagation of envelope soliton of ionization waves [J]. J. Appl. Phys.,1985,58(8):2975-2980.
[57]Ohe K. Large amplitude wave packets of ionization waves [J]. Appl. Phys. Lett.,1982,41(4):338-340.
[58]Muraoka K et al. A model for striation formation in ac PDP discharges [J]. J. Phys. D: Appl. Phys.,2006,39:2135–2139.
Review E,1998,58(4):4897-4902.
[60]Sergey A. Novopashin,Vjacheslav V. Radchenko,Salavat Z. Sakhapov. Three-Dimensional Striations of a Glow Discharge [J]. IEEE Transactions On Plasma Science,2008,36(4):998-999.
[61]A. Dinklage,B. Bruhn,H. Testrich,C. Wilke. Hysteresis of ionization waves [J]. PHYSICS OF PLASMAS,2008,15,063502:1-8.
[62]Rajneesh Kumar,Sanjay V. Kulkarni,Dhiraj Bora. Cylindrical stationary striations in surface wave produced plasma columns of argon [J]. PHYSICS OF PLASMAS,2007,14,122101:1-8.
[63]Shkurenkov I A,Mankelevich Y A,Rakhimova T V. Simulation of diffuse, constricted-stratified, and constricted modes of a dc discharge in argon: Hysteresis transition between diffuse and constricted-stratified modes [J]. Phys. Rev. E,2009,79 (4):046406.
[64]Bae,Hyun Sook,Jeong,Dong Cheol,Whang,Ki-Woong. Analysis of the discharge characteristics in an AC plasma display panel using energy fluid model [J]. IEEE Transactions on Plasma Science,2008,36(4):1890-1898.
[65]Yang Zhilong,Tu Yan,Yang Lanlan,Liu Delong,Ling Ling,He Wanwan. Anode striatum in shadow mask plasma display panels [J]. Journal of Vacuum Science and Technology,2008,28(5):399-403.
[66]van den Heuvel F C, Vrehen Q H F. Striations of the convective type and feedback in low-pressure mercury / noble-gas discharges [J]. Phys. Fluids, 1985, 28 (10): 3034-3039.
[67]Kajiwara T, Anzai Y. Investigation of moving striations in the low pressure krypton-mercury vapor discharges [J]. J. Light & Vis. Evn, 1981, 5(2): 11-18. [68]Kajiwara T, Sano M. Investigation of Moving Striations in a Low-Pressure Ar-Hg Discharge: I. Evaluation of Electron Temperature near the Reignition Region [J]. Jpn. J. Appl. Phys, 1999, 38: 905-908.
[69]Kajiwara T, Sano M. Investigation of Moving Striations in a Low-Pressure Ar-Hg Discharge: II. Study of the Mechanism of the Occurrence [J]. Jpn. J. Appl. Phys, 1999, 38: 918-919.
[70]Bian J, Zhang SD, Liu YQ and Zhu SL. Studies on the striations in T8 fluorescent lamps [J]. Journal of Fudan University (Natural Science), 2000, 39 (2): 201-204. [71]Zhang SD and Zhu SL. The Spectrum and Plasma Properties of Striation Discharge [J]. Journal of Fudan University (Natural Science), 2001, 40 (3):313-316.
[72]Langer R, Garner R, Hilscher A et al. Propagation of Ionization Waves in Compact Fluorescent Lamps [A]. In: Proceedings of the 11th International Symposium on the Science and Technology of Light Sources [C]. Shanghai: Fast-LS Ltd., 2007: 321-322.
[73]Lister G G, Lawler J E et al. The Physics of Discharge Lamps [J]. Reviews Of Modern Physics, 2004, 76: 541-598.
Chapter 2
Experimental investigation on
moving striations in low pressure rare gas
and mercury discharge
2.1
Introduction
Previous research on striations was mainly limited to DC pure rare gas discharge. More often than not, discharge of gas mixtures and AC discharge did not become subjects. Since nowadays fluorescent lamps are widely used and striations inside these lamps not only bring unpleasant effects to lighting environment, but they also cause visual fatigue [1][2], it is meaningful to find out reasons for these phenomena and try to eliminate them.
In this chapter, we will try to look into moving striations in a 50 Hz AC operated fluorescent lamp through different experiments. We will try to find out why striations form and how they will behave inside the lamp. All the contents of this chapter have been published in [3], part of the contents have been reported in the IEEE IAS annual meeting in 2008 [4].
2.2
Experiments
2.2.1
Electrode heating
Under DC condition, stably operated fluorescent lamps have constant lamp voltage and lamp current. Under 50 Hz AC condition, lamp voltage and current pass zero every half period, shown as Figure 2.1. This is the essential difference from DC operation. When lamp current passes zero, discharge inside the lamp becomes weak and plasma density considerable decreases. The lamp should go for reignition, during which cathode region may bear some disturbances due to sputtering [5]. Therefore, this disturbance in cathode region can be sources of instabilities inside the lamp [6]
and [7]. In this section, we will check this point.
What we should notice is that in low pressure rare gas and mercury discharge, there is oscillation in anode region. According to [1], [6], this oscillation is not the reason for striations.
Figure 2.1 Plot of lamp voltage and current of a 50 Hz, 58W linear tube fluorescent lamp
1. Experimental Setup and method
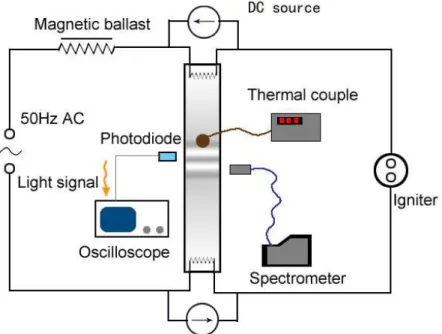
Figure 2.2 depicts the layout of experimental setup. A T8 fluorescent lamp is used as discharge tube. The dimension of the tube resembles that of Philips TLD 36W/840. Inside the lamp, there fill 400 Pa buffer gas (80% Ar and 20% Kr) and small amount of Hg. The inner wall of the tube is coated with phosphor. A 50 Hz adjustable power source is used to drive the lamp. A ballast and igniter are used to ignite and operate the lamp. Light output of the lamp is collected by a photodiode and sent into an oscilloscope. Two DC sources (shown by Figure 2.3) are employed to provide 400 mA heating current to the electrodes of the lamp so that disturbances in cathode region can be suppressed.
When the experiment starts, we regulate the output of the power source to 150 V. Moving striations appear and the cold spot temperature of the lamp is about 34 centigrade. Figure 2.4 tells the lamp voltage and light signal collected. We used “AC coupling” in the oscilloscope; so the DC component of light signals was filtered out. From the figure we can see that there is small amplitude of high frequency fluctuation
superposed on the flickering of light output. This fluctuation comes from the striations in the lamp. Detail information of the striations can be revealed by filtering light signal.
Figure 2.2 Layout of experimental setup Figure 2.3 The DC source
Figure 2.5 Variation of striations versus lamp voltage with (a) or without (b) electrode heating
2. Results and discussion
Figure 2.5 describes variation of the striations versus lamp voltage when electrodes are or are not heated by the DC current. The striation signals are obtained by inputting light signal from the photodiode into Origin software and performing 800 Hz high-passing filtering. The reason for choosing 800 Hz high-passing filter is that according to [10] and [11], frequency of the moving striation in the discharge is bigger than 800 Hz.
matter electrode heating is provided or not. Therefore, we can come up with such conclusion that moving striations inside the experimental lamp are not caused by disturbances in cathode region. There is an intrinsic mechanism in the plasma, which gives birth to and sustains this stratified instability, i.e. this is a kind of self-excited striation.
2.2.2
Spectra
In this experiment, we use a cooling spray to cool down a part of the lamp to see how cold spot temperature affects moving striation. In the cooled region, striations can be clearly seen. We use spectrometer and light signal to respectively record the emissive spectra and light output of the lamp. Meantime, a thermal couple is used to detect temperature evolution with time. Then we can establish links between cold spot temperature and striations.
1. Experimental setup and method
Figure 2.6 shows experimental setup of this section. Basic components of the experiment such as discharge tube and ballast are the same as the previous section. A thermal couple is attached to the cold spot of the lamp, which located close to the center of the tube. The spectrometer used is USB2000, manufactured by Ocean Optics. It can cover 200 nm – 1000 nm radiation with FWHM resolution of 1.5 nm. In our experiment, the integration time of the spectrometer is fixed at 7 ms and each measurement comes from average result of 30 measurements.
At the beginning of the experiment, keep the lamp normally operated for 15 min and at this time cold spot temperature of the tube is 42 centigrade. The discharge is uniform and there is no striation. Cool the region where the thermal couple is attached (dark region in Figure 2.6). Right after cooling, the temperature of this region can reach below 5 centigrade. Afterwards, the temperature gradually goes up and finally becomes stable. We record the spectra and light signals when the temperature returns to 16, 20.8, 25.4, 28.9 and 31 centigrade.
Figure 2.6 Experimental setup for measurement of emissive spectra and cold spot temperature of the lamp
2. Results and discussion
Figure 2.7 shows measured spectra under different cold spot temperature. Figure 2.8 (a) depicts variation of Hg vapor pressure and radiation of Hg 365 nm, Hg 435.8 nm and Ar/Kr 811 nm versus cold spot temperature. Hg 365 nm line comes from deexcitation from Hg 6-3D2, 3 to Hg 6-3P2. Hg 435.8 nm line results from deexcitation from Hg 7-3S1 to Hg 6-3P1. Radiation of 811 nm comes from deexciation of Ar and Kr 4 [ ]5 3
2
p to3 [ ]3 2 2
s . The reason for choosing 365 nm and 435.8 nm atomic lines is
to avoid the remanence from the phosphor. From the figure we can see that under higher cold spot temperature, Hg vapor pressure is higher and radiation from excited Hg atoms is also higher. Radiation from the excited rare gas atoms is on the contrary. When cold spot temperature gets lower, Hg radiation reduces substantially; while rare gas emits more radiation.
that striation frequency ranges from 560 Hz – 580 Hz under cold spot temperature of 16 centigrade. Correlated amplitude is beyond 0.5. When the temperature climbs up to 20.8 centigrade, striation frequency comes to about 600 Hz; while amplitude goes down to about 0.2. When the temperature rises to 25.4 centigrade, striation frequency reaches 720 Hz and amplitude descends to about 0.15. As cold spot temperature increases even higher, the FFT plot hardly tells information of striations. Frequency of striations goes up when cold spot temperature goes up; and goes down when cold spot temperature goes down. This coincides with phenomena in experiment [10]. In [12], van den Heuvel et al witnessed striations moving faster than those in our experiments. In their experiment, FFT results revealed that striation frequency located between 2 kHz and 3 kHz. That’s because striations that they observed were stirred up by external sources and amplified by circuit loop, whose mechanism was different from that of ours.
Figure 2.8 (a)Variation of Hg vapor pressure and radiation of Hg 365 nm, Hg 435.8 nm and rare gas 811 nm versus cold spot temperature; (b) FFT of light output of the
lamp, peaks are marked by arrows
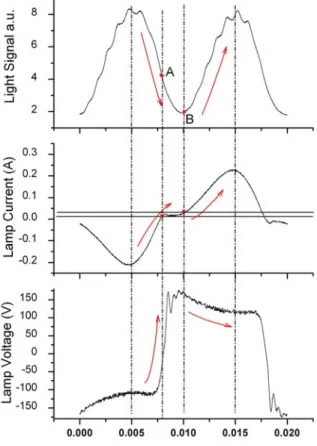
Figure 2.9 describes lamp current and light signals from the photodiode under different cold spot temperature. From the figure we can see that when cold spot temperature is low, striations seriously perturb light output of the lamp. Amplitude of striation even overweighs flickering (shown by Figure 2.9 (a) and (b)). As cold spot temperature goes higher, striations are attenuated, thus disturbances caused by them are weaker. What we should also noticed is that profile of lamp current keeps the same no matter what cold spot temperature is high or low. Only the RMS value changes slightly, from 192 mA at 16 centigrade to 162 mA at 31 centigrade.
(a) (b)
(c) (d)
(e)
Figure 2.9 Lamp current (purple) and light signals (yellow) under different cold spot temperature; (a)-(e) correspond to cold spot temperature of 16, 20.8, 25.4, 28.9 and 31
centigrade
![Figure 1.13 Temporal variation of electron density in low pressure Ar discharge diagnostic by microwave technology by Siefert [46]](https://thumb-eu.123doks.com/thumbv2/123doknet/2222687.15056/25.892.226.659.627.935/temporal-variation-electron-pressure-discharge-diagnostic-microwave-technology.webp)


![Figure 2.17 Part of emissive spectra of Newport 6035 Ar-Hg calibration lamp measured by MS257 1/4m monochromator with aperture width of 50 µ m [26]](https://thumb-eu.123doks.com/thumbv2/123doknet/2222687.15056/60.892.256.638.206.489/figure-emissive-spectra-newport-calibration-measured-monochromator-aperture.webp)