HAL Id: hal-02909300
https://hal.archives-ouvertes.fr/hal-02909300
Submitted on 26 Dec 2020HAL is a multi-disciplinary open access archive for the deposit and dissemination of sci-entific research documents, whether they are pub-lished or not. The documents may come from teaching and research institutions in France or abroad, or from public or private research centers.
L’archive ouverte pluridisciplinaire HAL, est destinée au dépôt et à la diffusion de documents scientifiques de niveau recherche, publiés ou non, émanant des établissements d’enseignement et de recherche français ou étrangers, des laboratoires publics ou privés.
Reactive uptake of NO2 on volcanic particles: A
possible source of HONO in the atmosphere
Manolis Romanias, Yangang Ren, Benoit Grosselin, Véronique Daële,
Abdelwahid Mellouki, Pavla Dagsson-Waldhauserova, Frédéric Thévenet
To cite this version:
Manolis Romanias, Yangang Ren, Benoit Grosselin, Véronique Daële, Abdelwahid Mellouki, et al.. Reactive uptake of NO2 on volcanic particles: A possible source of HONO in the atmosphere. Journal of Environmental Sciences, Elsevier, 2020, 95, pp.155-164. �10.1016/j.jes.2020.03.042�. �hal-02909300�
1
Reactive uptake of NO
2on volcanic particles: a possible source of HONO in the
1
atmosphere
2 3
Manolis N Romanias
1,*, Yangang Ren
2, Benoit Grosselin
2, Véronique Daële
2, Abdelwahid
4
Mellouki
2, Pavla Dagsson-Waldhauserova
3,4, Frederic Thevenet
15
1. IMT Lille Douai, Univ. Lille, SAGE, F-59000 Lille, France
6
2. CNRS-ICARE/OSUC, 45071, Orléans, France
7
3. Agricultural University of Iceland, Keldnaholt, Reykjavik 112, Iceland
8
4. Faculty of Environmental Sciences, Czech University of Life Sciences, Prague 165 21,
9
Czech Republic
10 11 12 13 *Corresponding author. E-mail:
emmanouil.romanias@imt-lille-douai.fr
(Manolis N
14
Romanias)
15
2
Abstract
17
The heterogeneous degradation of nitrogen dioxide (NO2) on five samples of natural Icelandic 18
volcanic particles has been investigated. Laboratory experiments were carried out under simulated 19
atmospheric conditions using a coated wall flow tube (CWFT). The CWFT reactor was coupled to a 20
blue light nitrogen oxides analyzer (NOx analyzer), and a long path absorption photometer (LOPAP) to 21
monitor in real time the concentrations of NO2, NO and HONO respectively. Under dark and ambient 22
relative humidity conditions, the steady state uptake coefficients of NO2 varied significantly between 23
the volcanic samples probably due to differences in magma composition and morphological variation 24
related with the density of surface OH groups. The irradiation of the surface with simulated sunlight 25
enhanced the uptake coefficients by a factor of three indicating that photo-induced processes on the 26
surface of the dust occur. Furthermore, the product yields of NO and HONO were determined under 27
both dark and simulated sunlight conditions. The relative humidity was found to influence the 28
distribution of gaseous products, promoting the formation of gaseous HONO. A detailed reaction 29
mechanism is proposed that supports our experimental observations. Regarding the atmospheric 30
implications, our results suggest that the NO2 degradation on volcanic particles and the corresponding 31
formation of HONO is expected to be significant during volcanic dust storms or after a volcanic 32 eruption. 33 Keywords: 34 volcanic dust 35 HONO 36 Uptake coefficients 37 Product yields 38
Simulated atmospheric conditions 39
3
1. Introduction
40
Nitrogen dioxide (NO2) is an important atmospheric pollutant that contributes to the formation of 41
photochemical smog, (von Schneidemesser et al., 2015). NO2 acts as an intermediate species in several 42
gas phase photochemical cycles occurring in the troposphere affecting the radical budgets for 43
hydroperoxyl radicals (HOx) and Peroxy radicals (ROx), as well as that of ozone (O3). In addition, the 44
chemistry of NO2 is involved in the formation of organic nitrates (Nault et al., 2016; Perring et al., 45
2013; von Schneidemesser et al., 2015). Besides gas phase chemistry, the heterogeneous reactivity of 46
NO2 with atmospheric particles has been shown to play an important role in atmospheric processes. 47
NO2 reacts with aerosols forming nitrous acid (HONO), a key atmospheric species, precursor of the 48
major atmospheric oxidant: OH radicals (Mellouki et al., 2015). So far, atmospheric simulation 49
models fail to reproduce the unexpectedly high daytime concentrations of HONO reported in field 50
campaigns, suggesting the existence of new, yet unknown, sources of HONO (Kleffmann, 2007; 51
Romer et al., 2018). Therefore, it has been suggested that the heterogeneous conversion of NO2 to 52
HONO could possibly explain the discrepancies between atmospheric models and field observations 53
(Romer et al., 2018). 54
The heterogeneous reaction of NO2 on various type of atmospheric particles, e.g. salts, soot, mineral 55
dust and proxies, has been already reported in literature (Crowley et al., 2010; George et al., 2015; 56
Tang et al., 2017). However, the interaction of NO2 with volcanic particles under simulated 57
atmospheric conditions has not been studied. Actually, the role of volcanic aerosols on tropospheric 58
chemistry has not been thoroughly evaluated yet. Volcanic aerosols may act as platforms for the 59
scavenging or conversion of key atmospheric species (e.g. NO2, O3, SO2 etc.), and thus, impact the 60
tropospheric oxidation capacity regionally, or in a larger scale such as during massive volcanic 61
eruptions or during extreme dust storms of volcanic dust as reported for instance in Iceland (Arnalds et 62
al., 2016; Arnalds et al., 2013; Moroni et al., 2018; Ovadnevaite et al., 2009). 63
Considering that nearly 10% of the world population is living in the vicinity of active volcanos (Auker 64
et al., 2013), it is expected that pollutants emitted from anthropogenic sources, such as nitrogen oxide 65
species (NOx), O3 etc. can interact or react with naturally emitted volcanic gases or volcanic aerosols. 66
4
A prime example is Mexico City, known as one of the most polluted city in the world, situated 70 km 67
away from the frequently erupting Popocatépetl volcano. Besides, distal urban environments can also 68
be impacted by volcanic pollution. Resuspension of volcanic ash, defined as volcanic dust, or v-dust, 69
for the following of the paper, can prolong the effects of volcanic eruptions several months after the 70
eruption is finished (Arnalds et al., 2013; Butwin et al., 2019; Wilson et al., 2011). The recent 71
eruptions of Icelandic volcanoes Eyjafjallajökull (2010) and Grimsvötn (2011) resulted in the dispersal 72
of massive loads of ashes and aerosols over a large part of Europe and Northern Atlantic 73
(Gudmundsson et al., 2012; Ilyinskaya et al., 2017). Holuhraun (2014-2015) was an effusive eruption 74
occurring in the center of volcanic dust hot spot, but volcanic dust was frequently suspended during 75
the eruption (Pfeffer et al., 2018; Vignelles et al., 2016). Therefore, volcanic aerosols are regularly 76
emitted in the atmosphere and recent studies have shown that their lifetime is significantly longer than 77
it has been estimated (Boichu et al., 2016). 78
Consequently, the objective of the current study is to determine experimentally how efficiently NO2 is 79
scavenged on volcanic particles and to evaluate whether this interaction can be a significant source of 80
HONO in the atmosphere - on local or regional scale - during severe volcanic dust storms or volcanic 81
eruptions. To that end, laboratory experiments have been carried out under simulated atmospheric 82
conditions (temperature, relative humidity, NO2 concentrations and simulated sunlight radiation) 83
employing a flow tube coupled with state of the art instrumentation for the simultaneous detection of 84
NO2, NO and HONO. The reactive uptake coefficients of NO2 are measured and the yields of the 85
products formed, and the mechanism of the reaction are addressed. 86
2. Materials and methods
87 88
2.1 Materials
89
2.1.1 Origin of the volcanic samples
90
In the current paper, Iceland was chosen as a case study. Iceland is a very active geological site of 91
Earth with more than 30 active volcanoes and large eruptions occurring every 3 to 5 years. Hence it is 92
considered as the largest volcanic desert on Earth (Arnalds et al., 2016) with estimated dust deposition 93
5
of 31 - 40 million tons per year (Arnalds et al., 2014), that could represents up to 7% of total global 94
dust emissions and up to 21% of the Saharan dust emissions (Arnalds et al., 2014; Engelstaedter et al., 95
2006). Remote sensing studies have evidenced that volcanic plumes formed after a volcanic eruption 96
in Iceland can travel thousands of kilometers impacting urban populated areas of northern Europe 97
(Boichu et al., 2016). Moreover, Iceland is one of the most active aeolian areas on the planet, where 98
unstable sandy surfaces are widespread and are subjected to frequent high-velocity winds, resulting in 99
numerous wind erosion events and massive volcanic dust storms (Arnalds et al., 2016). In Iceland, 100
around 100 dust events are reported each year (Arnalds et al., 2014); up to 300,000 tons of dust can be 101
emitted in a single storm. Particulate matter 10 micrometers or less in diameter (i.e. PM10) mass 102
concentrations during dust storms can exceed 7000 μg/m3 with a 1000 μg/m3 24-h average 103
concentration (Dagsson-Waldhauserova et al., 2015; Thorsteinsson et al., 2011) striking populated 104
areas such as Reykjavik (Dagsson-Waldhauserova et al., 2016). Satellite images confirm that during a 105
dust storm, v-dust particles can travel distances longer than 1000 km impacting the air quality of 106
central Greenland and northern Europe (Arnalds et al., 2016). In a recent study (Đorđević et al., 2019) 107
it has been shown that volcanic dust from Iceland can be transported to even central Balkans, and 108
authors pointed at the fact that Icelandic dust can contribute to impaired air quality in mainland 109
Europe. Icelandic dust is also transported towards Arctic (Groot Zwaaftink et al., 2017; Moroni et al., 110
2018). 111
The volcanic samples investigated in the present work were collected from different desert regions of 112
Iceland, so called dust hot spots Hagavatn, Mýrdalssandur, Maelifellssandur and Dyngjusandur, while 113
the fifth sample of Eyjafjallajökull volcanic ash, named typical ash in the following of the article, was 114
collected several hours after the eruption of the Eyjafjallajökull in 2010 (Gislason et al., 2011). 115
Details about the characterization of the physical and chemical properties of the samples can be found 116
elsewhere (Baratoux et al., 2011; Dagsson-Waldhauserova et al., 2014b; Moroni et al., 2018; Urupina 117
et al., 2019) and for clarity are briefly discussed in Appendix A. Supplementary data. 118
6
2.1.2 Gases
119
The laboratory experiments were carried out using dry zero air as bath gas (moisture level ca. 2 ppmV) 120
inside a photochemical flow tube. For experiments requiring humid air, an extra flow of zero air 121
passing through a bubbler containing ultrapure water (milli-Q, resistivity 18.2 MΩ·cm) was mixed 122
with the dry air flow, in proportions required to reach the targeted relative humidity (RH). The exact 123
RH in the gas flow is determined and monitored using a temperature and RH probe (KIMO HQ 210, 124
KIMO instruments, United Kingdom). Certified gas cylinders were used as NO2 source. For low 125
concentration experiments, aiming to determine uptake coefficients in the flow tube, a NO2 cylinder of 126
200 ppbV in air (Air Liquide, France) was used. As far as concerns the experiments carried out to 127
determine the irradiance intensity inside the flow tube reactor, rather high concentrations of NO2 were 128
used supplied from a NO2 cylinder of 50 ppmV in N2 (Praxair, Belgium). 129
2.1.3 Surface preparation.
130
A few mg of the volcanic sample was placed inside a Pyrex tube (20 cm length, 0.98 cm internal 131
diameter) and, depending on the volcanic sample mass, diluted in 0.5 to 2 mL of water. Then the tube 132
was hand-shaken, so that the water/dust suspension homogeneously spreads on the walls of the tube 133
without any trace of the suspension to be removed after the deposition. Thereafter, the tube was heated 134
at 120℃ with a heat-gun for several minutes and further dried overnight in an oven at 100℃. It should 135
be noted that potential modifications of the volcanic dust upon its dissolution in water in the process of 136
slurry preparation and subsequent drying process are expected to be of limited extend (Urupina et al., 137
2019), and not to influence the uptake coefficients measured in the current study. 138
2.2 Experimental set up
139
The uptake experiments of NO2 on the volcanic samples were performed using a horizontal 140
double wall Pyrex atmospheric pressure coated wall flow tube reactor (CWFT) (Fig. 1). Further details 141
of the experimental set up have been described in previous publications (Lasne et al., 2018; Urupina et 142
al., 2019). The Pyrex tube with the inner coated surface was introduced into the main reactor along its 143
axis. Two Viton O-rings were placed in both ends of the Pyrex tube to set its position. NO2 was 144
introduced in the reactor by means of a movable injector with internal diameter 0.3 cm. The injector 145
can be moved along the main axis of the coated Pyrex tube, allowing the variation of the v-dust 146
7
sample length exposed to NO2 and consequently the contact time (t). The total flow rate was regulated 147
between 200 and 400 mL/min, ensuring laminar flow conditions (Reynold number, Re, < 140). 148
The outlet gas flow was then mixed with a dry zero air flow (to compensate the sampling flow of the 149
analytical instruments) and was either sent to a NOx analyzer (Teledyne T 200UP, Teledyne API, 150
United States) equipped with a blue light converter for the detection of NO2 (detection limit 50 pptV), 151
and nitrogen oxide (NO that appeared as reaction product), or to a long path absorption photometer 152
(LOPAP, QUMA, Germany) to monitor HONO (reaction product) with a limit of detection of 1-2 153
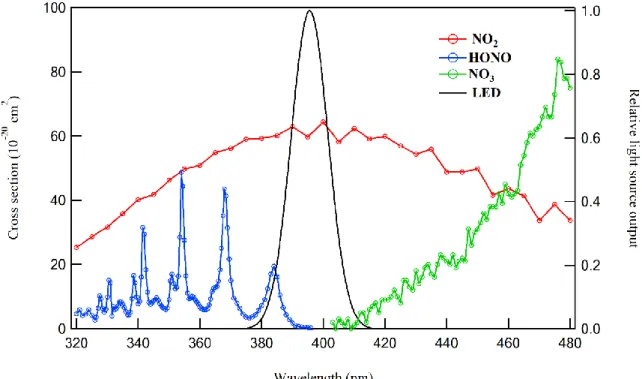
pptV. Teledyne T 200UP NOx analyzer uses photolysis in its conversion process; the gas flow passes 154
through a conversion chamber and it is exposed to a blue light from two high powered ultraviolet light 155
emitting diodes (LEDs) characterized by narrow emission bands centered at 395 nm as reported in Fig. 156
2 (bell curve area). The emission band of the LED includes NO2 absorption band with negligible 157
interferences expected from other gases such as HONO or NO3 radicals. Consequently, unlike NOx 158
analyzers relying molybdenum converters, the selective detection of NO2 is achieved. Based on the 159
LED output intensity and wavelength range as well as the absorption cross section of HONO given in 160
Fig. 2, we estimated that the HONO interference to NO2 concentration to be lower than 3%. 161
To further evaluate possible interferences to NO2 concentration measured along the uptake 162
experiments, in a dedicated set of experiments a cavity attenuated phase shift (CAPS) NO2 analyzer 163
(AS32M, ENVEA S.A, France) was additionally coupled with the reactor. The NO2 CAPS (detection 164
limit 100 pptV) provides a direct absorption measurement of nitrogen dioxide at 450 nm and does not 165
require any conversion of NO2 to another species. Thus, no interference from other N-containing 166
species are possible. Therefore, comparing the concentrations of NO2 monitored with the NOx analyzer 167
and the CAPS we concluded that the possible interference of HONO is around 2% and thus included 168
in our experimental uncertainties. 169
2.3 Light source characterization.
170
The CWFT reactor was surrounded by 3 Ultraviolet A lamps (UVA, Philips lighting 18 Watt; 315–400 171
nm with maximum emission at 352 nm) (Romanias et al., 2017). In order to characterize the irradiance 172
intensity in the flow tube, the NO2 photolysis frequency was measured as a function of the number of 173
8
lamps turned on. These experiments were carried out with rather high NO2 concentrations of ca. 1015 174
molecule/cm3, i.e. 50 ppmV, using dry N2 as bath gas. NO2 concentration was monitored with a 175
chemical ionization mass spectrometer (SIFT-MS, Syft Technology, new Zealand) (Romanías et al., 176
2016; Romanias et al., 2016; Zeineddine et al., 2017). The values of NO2 photolysis frequency, jNO2 177
(sec-1), determined from the exponential decays of NO2 for different numbers of lamps switched on 178
were in the range of 4 to 15 10-3 sec−1 (Appendix A Fig. S2). Thus it overlaps with the values of JNO2 179
measured in the atmosphere from cloudy to clear sky conditions (Barnard et al., 2004; Bohn et al., 180
2005; Topaloglou et al., 2005). Further information regarding the light source characterization 181
experiments are reported in Appendix A. Supplementary data. 182
It has to be noted that under the experimental conditions where the uptake experiments were carried 183
out, the gas phase loss of NO2 due to its photodissociation is negligible. Indeed, for only 1 UV lamp, 184
i.e. jNO2 = 4.5 × 10⁻³ sec-1, denoted as simulated sunlight conditions in the following of the article, and 185
with a residence time of 2 sec, the gas phase loss of NO2 due to its photolysis was lower than 0.8%. In 186
case more than one UV lamp was used, the flow in the reactor was increased to maintain gas phase 187
consumption due to photolysis below 1.5% to avoid any impact on the measured uptake coefficient 188
values. To conclude, our experimental measurements of the uptake coefficients and the product yields 189
discussed below are not expected to be biased from interferences or experimental artifacts. 190
2.4 Uptake of NO
2on volcanic samples
191
2.4.1 Experimental procedure
192
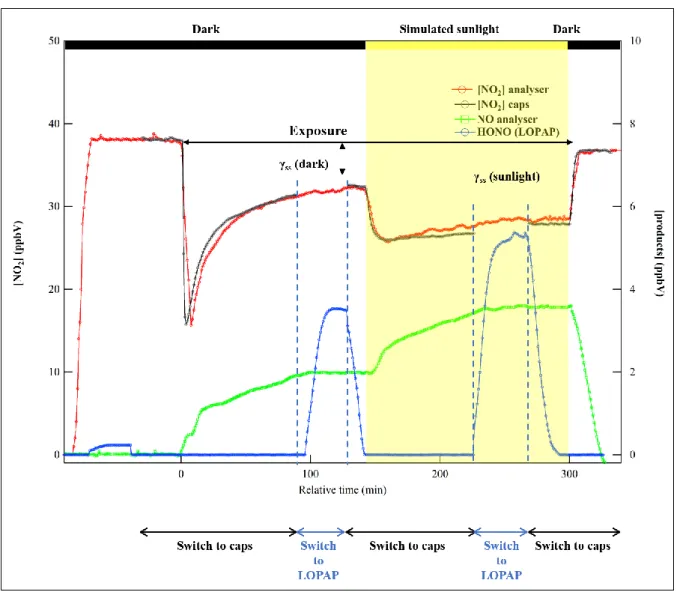
A typical uptake profile of NO2 on Hagavatn sample under 30% of RH and 293 K is presented in Fig. 193
3. It was selected to present breakthrough profiles with all instruments coupled with the flow tube to 194
analyze the outlet flow. In these experiments, the gas phase was continuously monitored with the NOx 195
analyzer, while either the NO2 CAPS or the LOPAP were coupled to the flow tube (Fig. 3). First, the 196
injector is placed at the downstream position of the reactor, ensuring no contact of the gas flow with 197
the v-dust coating. At this stage the background concentration levels for all instruments is recorded. 198
Afterwards, NO2 is introduced in the reactor and a steady state concentration is achieved within a few 199
minutes. The NO levels are close to zero while a very low formation of HONO was observed, 200
9
probably due to hydrolysis of NO2 on the wet Teflon lines (Finlayson-Pitts et al., 2003). This 201
contribution was taken into account for further calculations of the product yields. Thereafter, the 202
LOPAP was bypassed and the gas stream was driven through the NO2 CAPS; as displayed in Fig. 3, 203
the NO2 concentrations measured with the analyzer and the CAPS are in excellent agreement. 204
Subsequently, the injector is pulled out (t = 0 in Fig. 3) and the whole dust coating is exposed to the 205
gas flow. A fast consumption of NO2 was observed due to NO2 uptake on the volcanic sample, and a 206
gradual recovery to higher outlet concentrations was noticed. Simultaneously, NO was formed as a 207
product of the heterogeneous reaction. After achieving a steady state consumption of NO2 and 208
formation of NO, the CAPS was bypassed to monitor the concomitant concentration of HONO with 209
the LOPAP for ca. 25 min. Then, the flow was sent back to the CAPS. The next step in the 210
experimental protocol was the irradiation of the surface with simulated sunlight; the initiated photo-211
induced processes on the surface of the volcanic particles lead to an extra consumption of NO2 and an 212
additional formation of NO. During the sample irradiation, the gas flow was sent to the LOPAP to 213
determine the HONO concentrations formed and then switched back to the CAPS. In the last step, the 214
injector is pushed back in, to control the NO2 level. The steady state consumption of NO2 and the 215
formation products such as NO and HONO under dark and simulated sunlight conditions, were used to 216
determine the corresponding uptake coefficients (γss) and product yields. 217
2.4.2 Uptake coefficients and data analysis
218
The uptake coefficient of NO2 on the v-dust surface can be derived from the following expression: 219
(1) 220
where γgeom is the geometric uptake coefficient, kkin is the first order reaction rate loss of gas-phase 221
NO2 (s-1) in the kinetic regime, rtube is the radius of the tube, and CNO2 is the average molecular 222
velocity (cm/sec). Both the radius of the tube (0.49 cm) and the average molecular speed at 293 K are 223
known parameters, therefore only kkin needs to be determined. Further information about the 224
calculations of uptake coefficients and diffusion corrections can be retrieved elsewhere (Romanias et 225
al., 2013, 2012; Tang et al., 2014) and are also given in Appendix A. Supplementary data. 226
10
The determination of the uptake coefficient using the geometric surface area (Sgeom) can be considered 227
as an upper limit (Crowley et al., 2010). An alternative way for the calculation of the uptake 228
coefficient is using the specific surface area (As) of the solid, considering that all surface sites are 229
accessible to the gas phase molecules. For the determination of the Specific surface area (SSA), the 230
Brunauer-Emmett-Teller (BET) isotherm approach is applied and the corresponding uptake coefficient 231
( ) is given by the following expression: 232
(2) 233
where SBET (m2/g) is the product of the specific surface area (As) of the solid with the deposited mass 234
(g). 235
3. Results and discussion
236
3.1 Determination of NO
2uptake coefficients on v-dust samples
237
This section includes the results of the kinetic measurements performed under simulated atmospheric 238
conditions aiming to determine the uptake coefficients of NO2 on the volcanic samples. Initially, the 239
impact of experimental conditions on the uptake is discussed using dust from Hagavatn collection spot 240
as a model volcanic sample; this choice is based on two criteria. First, Hagavatn dust hot spot is in 241
close vicinity to Reykjavik - the most densely populated area in Iceland - and secondly, the air quality 242
in Reykjavik is very frequently impacted from massive loads of v-dust particles originating from 243
Hagavatndust hot spot. Therefore, it was considered as the most representative sample to study with 244
the ultimate objective to evaluate the corresponding impacts of NO2 aged volcanic dust to the 245
chemistry of the local/regional atmosphere. Finally, at the end of this section a thorough comparison 246
between the uptake coefficients determined on the five volcanic samples under the same experimental 247
conditions is performed. 248
3.1.1 Dependence of NO2 uptake coefficient on the sample mass 249
In this series of experiments, the steady state uptake coefficient was investigated as a function of 250
Hagavatn v-dust mass exposed to the NO2 flow. The objective was to determine the v-dust surface 251
area involved in the interaction with NO2 molecules. The experiments were performed under both dark 252
11
and simulated sunlight irradiation conditions (jNO2 = 4.5 ×10⁻³ sec-1) at temperature (T) = 293 K, 100 253
ppbV of NO2 and dry conditions. The obtained results are presented in Appendix A Fig. S3. A linear 254
increase of the geometric uptake coefficient (γss,geom) was observed as a function of the mass of 255
Hagavatn coated on the tube. This trend points out that the entire surface area of the solid sample is 256
accessible to NO2, and consequently, the BET specific surface area should be used for the 257
determination of the true uptake coefficient (Crowley et al., 2010). Furthermore, under UV light 258
conditions, the observed linear increase also indicates that the sample surface is homogeneously 259
irradiated, irrespectively of the sample mass (Herrmann, 2005). Similar trends were observed for the 260
remaining volcanic samples and have been also reported in literature for mineral oxides and natural 261
mineral dusts (El Zein et al., 2013a, 2013b; Romanias et al., 2016; Zein et al., 2014). 262
3.1.2 Dependence of uptake coefficients on the irradiance intensity
263
To evidence potential photocatalytic or photoinduced processes on the surface of the volcanic samples, 264
the irradiance intensity of the incident light was varied inside the reactor. The experiments were 265
carried out at 30% of RH, 293 K using 20 ppbV of NO2 as inlet concentration and the steady-state 266
uptake coefficient was measured as a function of the number of UV lamps switched on, varying from 267
0 to 3 lamps. Appendix A Fig. S4 displays the results on Hagavatn sample. A linear increase of the 268
uptake coefficient with the irradiance intensity was observed. It varied almost by a factor of 10 269
comparing the values under dark and 3 UV lamps, pointing out that NO2 degradation rate is linearly 270
driven by the radian flux (Herrmann, 2005). However, if photons clearly induce specific 271
photoactivated phenomena on the v-dust surfaces it cannot be determined at this point whether they 272
are photocatalytic or photochemical. Nevertheless, similar trends have been noted in literature for 273
mineral oxides and natural mineral dusts (El Zein and Bedjanian, 2012; Tang et al., 2017; Zein et al., 274
2014). 275
3.1.3 Dependence of uptake coefficients on NO2 concentration 276
The dependence of the steady state uptake coefficient on the inlet concentration of NO2 was studied in 277
the range of 20 to 140 ppbV. In this set of experiments Hagavatn volcanic sample was exposed to NO2 278
at T = 293 K, 30% of RH under both dark and UV irradiation conditions and the results are displayed 279
in Fig. 4. The simulated sunlight irradiation of the surface has promoted the uptake of NO2 by a factor 280
12
of three in the entire concentration range. Furthermore, under both dark and light conditions, the 281
uptake coefficient was found to be almost constant for concentrations below 40 ppbV, however, above 282
that limit a slight decrease was observed; the latter may be attributed to the surface saturation by the 283
adsorbed intermediates. The solid lines of Fig. 4 correspond to the empirical power fit of results 284
according to the following expressions: 285
(3) 286
(4) 287
where and refer to dark and simulated sunlight conditions, 288
respectively, and [NO2] (ppbV) is the initial concentration of NO2. The quoted uncertainties 289
correspond to the two sigma (2σ) precision of the fit of experimental results. Therefore, one can 290
extrapolate the uptake coefficient of NO2 at any tropospheric concentration range. 291
3.1.4 Dependence of NO2 uptake coefficient on RH 292
The uptake coefficients of NO2 on Hagavatn sample were determined as a function of relative 293
humidity from dry conditions to 75% RH, the results are displayed in Fig. 5. Aiming to isolate the 294
effect of RH on the kinetic parameter, in this series of experiments the volcanic sample was always 295
exposed to 60 ppbV of NO2 at 293 K. Under dark conditions, the steady state uptake coefficient was 296
found to be independent of RH in the whole investigated RH range. The solid black line in Fig. 5, 297
corresponds to the mean value of the steady state coefficient in the entire RH range: 298
(5) 299
the quoted uncertainties correspond to the 2σ precision of the fit of experimental results. 300
As shown in Fig. 5, the UV irradiation of the sample surface promoted the consumption of NO2 in the 301
entire RH range compared to dark conditions; the γss,BET under simulated sunlight was promoted by a 302
factor of 3 compared to dark and was found to be independent of RH under ambient relative humidity 303
conditions i.e. RH higher than 10%. The dash black line in Fig. 5, corresponds to the mean value of 304
the steady state coefficient for ambient RH conditions: 305
13
(6) 306
Interestingly, under dry conditions, the enhancement of γss,BET upon surface irradiation was by a factor 307
of 6. 308
The independent nature of γss,BET on RH does not preclude that water molecules do not affect the 309
reaction mechanism. More precisely, under UV light irradiation, H2O is a well-known source of 310
radicals (i.e. OH, O2-) on mineral dust surfaces that contain photocatalysts (Chen et al., 2012; 311
Herrmann, 2005; Romanias et al., 2012; Schneider et al., 2014) and thus enhance the reactivity of the 312
surface towards NO2 (Herrmann, 2005; Romanias et al., 2012; Zein et al., 2014). On the other hand, 313
adsorbed water may also block some sorptive and reactive sites and induce a decrease to γss,BET 314
(Romanias et al., 2012, 2017; Zein et al., 2014). It seems that under ambient RH conditions (RH > 315
30%), the effect of sites blocking by water is probably compensated by its role as a source of radical 316
species on the surface of the dust. Under dark conditions, radical species are not expected to be 317
formed. However, the disproportionation of NO2 can occur on the surface of the volcanic sample 318
leading to a continuous consumption of NO2 (Finlayson-Pitts et al., 2003). Further details regarding 319
the reaction mechanism under both dark and light conditions versus relative humidity are given in 320
reaction mechanism section. 321
3.1.5 Comparison of NO2 uptake coefficients on various volcanic samples under defined 322
experimental conditions
323
Aiming to compare the uptake coefficients of NO2 on the different volcanic samples a series of 324
experiments were carried out under defined and atmospheric experimental conditions: 30% RH, NO2 325
concentration 60 ppbV, under both dark and simulated sunlight. The results obtained are displayed in 326
Fig. 6, where for comparison purposes the international union of pure and applied chemistry, IUPAC 327
recommended value on mineral oxides is also displayed. A significant variation of the γss,BET as a 328
function of the origin of the samples can be noted. In addition, the simulated sunlight radiation of the 329
volcanic samples induced an increase to the γss,BET for all samples indicating the existence of photo-330
induced processes on the surface of all dusts. 331
14
The dependence noted on the γss,BET values from one volcanic sample to another is significant. Despite 332
the fact that samples originate from close geographical regions, the chemical composition of the 333
magma that produced them is different (see SI materials) and thus variations in the composition of the 334
natural samples and contrasted surface properties are expected. Furthermore, taking into account that 335
their crystalline fraction is relatively low, ca. 20% for all samples beside Hagavatn, it makes any 336
correlation between mineralogical composition and reactivity challenging. The relative abundance of 337
elements could have been a base for comparison, however, it is quite similar for all samples, and no 338
relevant correlation trends were noticed. 339
Interestingly, a correlation between the uptake coefficients and the specific surface area was noticed 340
for both dark and light conditions (Appendix A Fig. 5); the highest the specific surface area, the 341
lowest the uptake coefficient. The latter could indicate that morphological parameters can play an 342
important role and affect the surface properties of the samples studied. It has been shown that the 343
specific surface area is inversely correlated with the particles size in literature (Ibrahim et al., 2018) – 344
and that small particles are more irregular. Moreover, it has been evidenced that the water monolayer 345
is formed at lower RH for natural mineral samples with small particle sizes due to higher OH group 346
surface density (Ibrahim et al., 2018; Tang et al., 2016). Therefore, a possible explanation could be 347
that the NO2 uptake or/and the abundance of intermediate surface species formed are influenced by the 348
presence of surface OH group density. 349
The γss, BET values measured for the volcanic samples are in the same order of magnitude but relatively 350
lower than the IUPAC recommendation. However, it should be stressed out that the IUPAC 351
recommended value is based on studies performed with mineral oxides and not natural samples under 352
low pressure and dry conditions, although RH is a governing factor for NO2 uptake. Recent studies 353
performed on oxides and natural or synthetic mineral dusts report uptake coefficients of NO2 in the 354
order of 10-9 (Crowley et al., 2010; Li et al., 2010; Ndour et al., 2009), and thus similar or even lower 355
than those determine in the current study. 356
15
3.2 Investigation of products formed along with NO
2uptake
357
The results presented in this section concern the determination of the gas-phase products of NO2 358
interaction with the volcanic surfaces. The yield of the detected products (PY) was determined as the 359
ratio of the product concentration formed (Δ[product]) to the concentration of NO2 consumed 360
(Δ[NO2]) after achieving steady state conditions: 361
PY = Δ[product]/Δ[NO2] (7)
362
To investigate the impact of experimental conditions, Hagavatn volcanic sample was used as model 363
volcanic sample. Finally, at the end of the section the product yields determined for all volcanic 364
samples under defined experimental conditions are presented and discussed. 365
3.2.1 Product yield as a function of NO2 initial concentration and relative humidity 366
The impact of experimental conditions, such as NO2 initial concentration (in the range of 40 to 140 367
ppbV) and relative humidity (from dry to 75% RH) on the yield of the products formed was 368
investigated at room temperature, under both dark and simulated sunlight, using Hagavatn as model 369
surface sample. In all cases, NO and HONO were measured as the only nitrogen containing gas phase 370
products. Regarding concentration dependence, the experiments were carried out at 30% of RH and 371
the yields of NO and HONO were 40% ± 10% and 60% ± 10%, respectively, independent on NO2 372
initial concentration. The product yield measurements as a function of RH were carried out at 60 ppbV 373
of initial NO2. As displayed in Fig. 7, NO and HONO were detected as primary gas phase products, 374
with almost identical values under both dark and simulated sunlight conditions, however, their 375
formation was highly dependent on relative humidity. As relative humidity increases, the formation of 376
HONO is favored while that of NO is diminished. The latter is in accordance with the literature where 377
similar trends have been reported for mineral oxides (Baltrusaitis et al., 2009; Bedjanian and El Zein, 378
2012) and results seems to justify the mechanism proposed about enhanced formation of HONO on 379
humid surfaces(Finlayson-Pitts et al., 2003; Rodriguez et al., 2001). In addition, for RH above 20% a 380
nitrogen mass balance evidenced the complete conversion of adsorbed NO2 to the gas phase products. 381
However, for RH below 10%, the nitrogen mass balance was not completed only considering the gas 382
phase products, thus the presence of nitrogen containing species on the surface, i.e. adsorbed NO2 or 383
16
surface reaction products, is expected. The latter indicates that water plays a key role on the sorption 384
and/or reaction mechanism facilitating the transformation of NO2 to gas phase products. Similar 385
formation yields and trend were noticed for the other volcanic samples and have been also reported in 386
literature on the surface of mineral oxides and natural desert dusts (Bedjanian and El Zein, 2012; Tang 387
et al., 2017). 388
389
3.2.2 NO and HONO product yields on various volcanic samples under defined experimental
390
conditions
391
In this series of experiments the volcanic samples were exposed to 60 ppbV concentration of NO2, 392
30% of RH under both dark and simulated sunlight irradiation conditions. The results are presented in 393
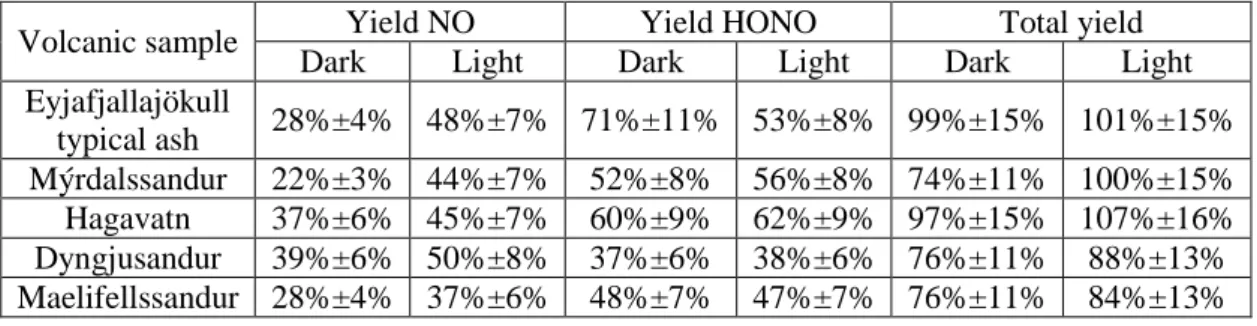
Table 1. Considering the experimental uncertainties, no significant variation was noticed to the 394
formation yield of NO between the 5 volcanic samples under dark and simulated sunlight conditions 395
although significant differences were observed for the uptake coefficients. On the contrary, the HONO 396
formation yields for Eyjafjallajökull typical ash, Mýrdalssandur and Hagavatn, were systematically 397
higher than those measured for Dyngjusandur and Maelifellssandur v-dusts. Interestingly, it seems that 398
HONO formation in the gas phase is promoted on volcanic dusts with higher NO2 uptake coefficients. 399
In addition, the irradiation of the surface increased the formation of NO for all samples while the 400
HONO yield was not influenced. The latter observation suggests that (i) either surface adsorbed 401
nitrogen species are photolysed or (ii) the surface is photoactivated and photocatalytic processes occur, 402
leading to the formation of NO. It should be noted that HONO photolysis in the gas phase is not 403
expected to occur in our system since the photolysis frequency of HONO is almost one order of 404
magnitude slower than NO2, thus it is not expected to occur in our reactor, and HONO yields didn’t 405
decrease upon surface irradiation. Concerning the total formation yields of gas phase products, under 406
surface irradiation a systematic increase was observed (except for typical ash sample) compared with 407
dark conditions, leading to an almost completion of the nitrogen mass balance for all samples within 408
the experimental uncertainties. 409
17
3.3 Proposed reaction mechanism
410
3.3.1 Dark conditions
411
The heterogeneous degradation of NO2 on the surface of volcanic samples resulted in the formation of 412
both NO and HONO in the gas phase. Several pathways have been proposed to occur for the 413
transformation of NO2 on mineral surfaces. In particular, NO2 can be initially physisorbed on metal 414
sites (SSn stands for surface site) of the mineral surface (Eq. (8)) and then disproportionate (Eq. (9)), 415
leading to the formation of surface nitrates (Eq. (9)) and gaseous NO (Eq. (10)) (Finlayson-Pitts et al., 416
2003; Rodriguez et al., 2001). Furthermore, NO2 can directly react with surface O atoms, SS-O, and 417
form surface nitrates (Eq. (11)) (Baltrusaitis et al., 2009). Alternatively NO2 can be chemisorbed and 418
reduced to NO2− by metal sites, i.e. ferrous iron sites Fe2+, expected to be relatively abundant in the 419
volcanic samples, in an electron transfer reaction that is facilitated by adsorbed water (Eqs. (12) and 420
(13)) leading to HONO formation (Kebede et al., 2016). In the presence of water, the abundance of 421
surface OH groups increases, SS-OH (Ibrahim et al., 2018; Joshi et al., 2017; Tang et al., 2016), and 422
according to literature, NO2 can form a hydrogen bond stabilized ONOOH species that could either 423
lead to the formation of gas HONO or isomerize and form adsorbed nitric acid (Eqs. (14) and (15)) 424 (Baltrusaitis et al., 2009). 425 426 SSn + NO2(g) ↔ SSn-NO2(ads) (8) 427
2 [SSn-NO2(ads)] SSn-NO3-(ads) + SSn-NO+(ads) (9) 428
SSn-NO+(ads) SSn + NO(g) (10)
429
SS-O + NO2(g) SSn+1-NO3-(ads) (11)
430
SSn + NO2(g) SSn+1-NO2-(ads) (12) 431
SSn+1-NO2-(ads) + H+ SSn-HONO(ads) (13)
432
SS-OH + NO2(g) SS-ONOOH(ads) SS-O + HONO(gas) (14) 433
18
SS-ONOOH SS-HNO3 (isomerization) (15)
434
The proposed reaction mechanism is in agreement with our experimental observations. Under dry 435
conditions, the dominant reaction pathways are: the disproportionation of NO2, leading to high 436
formation yields of NO(g) (Eqs. (8)-(10)); and reactions (11) and (12) respectively forming surface 437
nitrates and nitrites. Reactions (13)-(15) are still active pathways even under dry conditions, since the 438
removal of strongly adsorbed surface water requires a stronger thermal pretreatment method (> 500 K) 439
than the one followed in our study (Joshi et al., 2017). Consequently, the sequence of reactions 440
proposed seems to explain the high formation yields of NO, and the corresponding low HONO yields 441
observed for Hagavatn sample under dry conditions, as well as the absence of nitrogen mass balance 442
of the gas products due to the formation of surface adsorbed nitrogen containing species. 443
By increasing the relative humidity, the surface density of OH groups also increases considerably 444
(especially after water monolayer formation that is expected at RH greater than 25%-30% RH, (Joshi 445
et al., 2017), and thus reactions (13)-(15) which are competing to reactions (8), (9), (11) and (12) , 446
become the dominant pathways leading to an enhanced formation of HONO. Consequently, the 447
formation of NO is diminished similar with the concentration of surface adsorbed species and a 448
nitrogen mass balance is observed. 449
450
3.2.2 UV light conditions
451
Under simulated sunlight irradiation of the surface, and comparing the results obtained under fixed 452
experimental conditions (i.e. fixed NO2 concentration and 30% RH - see Table 1) the uptake of NO2 453
was enhanced, however unlike HONO the yield of NO was significantly influenced. These 454
observations could possibly point to the presence of photo-induced processes on the surface of 455
volcanic samples. Note that photocatalytic processes could also take place but considering that the 456
detailed mineralogical composition of the volcanic samples is not known and that samples are mostly 457
amorphous, the consideration of these processes is speculative and that they are not considered in the 458
proposed reaction mechanism. 459
19
The surface adsorbed nitrite species formed under dark conditions through reaction (12) could be 460
photolysed in presence of simulated sunlight (hv) producing gaseous NO and regenerating a SS-O 461
surface site according to reaction: 462
SSn+1-NO2-(ads) + hv SS-O + NO (g) (16)
463
Similarly, nitrates formed through reaction (11) can be the source of gaseous NO and NO2 through 464
reactions (17) and (18): 465
SSn+1-NO3-(ads) + hv SSn + NO(g) + O2 (17)
466
SSn+1-NO3-(ads) + hv SS-O + NO2(g) (18)
467
Reaction pathways (16)-(18) corroborate the photoinduced consumption of NO2 under simulated 468
sunlight conditions, as well as the slight but systematic photoenhanced formation of NO observed on 469
volcanic samples under 30% of RH. 470
4. Conclusions and atmospheric implications
471
Within the framework of the current study, the reactivity of Icelandic volcanic samples towards NO2 472
was studied as a function of several atmospheric parameters. Despite the relative close regions where 473
the samples were collected, the uptake coefficients varied significantly from one sample to another. It 474
is suggested that the origin of the magma and morphological differences between the samples could 475
possibly explain the variations noted. Besides the kinetics, the formation yields of NO and HONO 476
were also determined. The relative humidity was found to influence the balance between adsorbed and 477
gas phase products as well as the distribution of NO and HONO yields. Interestingly, under 478
atmospheric conditions (i.e. > 30% RH, ambient temperature) higher HONO formation yields were 479
noticed for the volcanic samples. Finally, based on the experimental observations of the current study, 480
a reaction mechanism was proposed. 481
Regarding the atmospheric implications, we estimate that the corresponding impacts of NO2 482
transformation to HONO is expected to be significant in cases of volcanic eruptions or during more 483
frequent events such as volcanic dust storms. Indeed, using Iceland as a case study, it has been 484
20
evidenced that volcanic dust storms are much more frequent than volcanic eruptions transporting 485
volcanic aerosols to central Europe or Arctic (Dagsson-Waldhauserova et al., 2014a). Interestingly, 486
about half of these events occur in winter (dark season) when NO2 concentrations in Reykjavik can 487
exceed 60 ppbV. 488
In an attempt to estimate the atmospheric significance of NO2 heterogeneous degradation on volcanic 489
particles, the rate coefficient of NO2 heterogeneous loss (khet (hr−1)) was calculated from the following 490 equation: 491 (19) 492 493
where, γ is the NO2 uptake coefficient, c (cm/hr) is the mean molecular velocity, and A the aerosol 494
surface area density (cm2/cm3). Using Iceland as case study, under typical PM10 concentrations during 495
a v-dust storm, i.e. ca. 300 μg/m3 (Arnalds et al., 2016, 2014; Dagsson-Waldhauserova et al., 2015; 496
Thorsteinsson et al., 2011), RH greater than 70%, NO2 concentrations of ca 8 ppbV (annual average 497
values) (Hazenkamp-von Arx et al., 2004) and extrapolating the uptake coefficient of NO2 under dark 498
conditions corresponding to winter season using Eq. (3), the heterogeneous loss of NO2 is relatively 499
low (in the order of 10-6 hr-1) and the estimated HONO formation rate is not expected to exceed 0.1 500
pptV/hr. Even considering the peak NO2 concentration of 60 ppbV the HONO formation rate is below 501
0.3 pptV/hr. However, during severe dust events (7000 μg/m3), the heterogeneous loss of NO2 could 502
be substantially higher (up to 10-4 hr-1) and HONO formation rate could reach 4 pptV/hr. Considering 503
the severe dust event scenario during the summer season up to 10 pptV/hr of HONO can be expected 504
and thus a significant impact to the oxidative capacity of the regional atmosphere. 505
To conclude, the significance of NO2 scavenging on the surface of volcanic particles is mainly 506
dependent on the v-dust atmospheric loads. Nevertheless, this study clearly evidences that volcanic 507
dust particles can efficiently uptake, scavenge and transform NO2. Similar trends could be expected 508
for other pollutants. Indeed, in the recent study of Urupina et al. (2019) it was evidenced an efficient 509
uptake and transformation of sulfur dioxide to sulfates on these Icelandic volcanic dusts. Therefore, 510
21
Icelandic v-dust aerosols should be considered as reactive components of the atmosphere; In the 511
context of their long range transportation to Europe and especially Arctic it is expected to transport, 512
scavenge and transform pollutants and thus to alter the corresponding air quality and chemistry of the 513
atmosphere. 514
Appendix A. Supplementary data 515
Supplementary data associated with this article can be found in the online version at xxxxxx. 516
517
Acknowledgments
518
This work was achieved in the frame of Labex chemical and physical properties of the atmosphere 519
(Labex CaPPA) project, funded by agence nationale de la recherché (ANR) through the programme 520
d'investissements d'avenir (PIA) (No. ANR-11-LABX-0005-01), and contrat de plan état-région 521
changement climatique dynamique de l'atmosphère impacts sur la biodiversité et la santé humaine 522
(CPER CLIMIBIO) project, funded by the hauts-de-france regional council and the european regional 523
development fund (ERDF). Work of
pavla dagsson-waldhauserova
was partly funded by the czech 524Science Foundation under the 'the role of high latitude dust in changing climate' (HLD-CHANGE) 525
project (Nr. 20-06168Y). Manolis N. Romanias is thankful to the INSU LEFE-CHAT program for 526
financial support. 527
22 References
528
Arnalds, O., Dagsson-Waldhauserova, P., Olafsson, H., 2016. The Icelandic volcanic aeolian 529
environment: Processes and impacts - A review. Aeolian Res. 20, 176-195. 530
Arnalds, O, Olafsson, H, Dagsson-Waldhauserova, P, 2014. Quantification of iron-rich volcanogenic 531
dust emissions and deposition over the ocean from Icelandic dust sources. Biogeosciences 11, 6623-532
6632. 533
Arnalds, O, Thorarinsdottir, E F, Thorsson, J, Waldhauserova, P D, Agustsdottir, A M, 2013. An 534
extreme wind erosion event of the fresh Eyjafjallajökull 2010 volcanic ash. Sci. Rep. 3, 1257. 535
Auker, M R, Sparks, R S J, Siebert, L, Crosweller, H S, Ewert, J, 2013. A statistical analysis of the 536
global historical volcanic fatalities record. J. Appl. Volcanol. 2, 2. 537
Baltrusaitis, J, Jayaweera, P M, Grassian, V H, 2009. XPS study of nitrogen dioxide adsorption on 538
metal oxide particle surfaces under different environmental conditions. Phys. Chem. Chem. Phys. 11, 539
8295-8305. 540
Baratoux, D, Mangold, N, Arnalds, O, Bardintzeff, J-M, Platevoët, B, Grégoire, M, et al., 2011. 541
Volcanic sands of Iceland - Diverse origins of aeolian sand deposits revealed at Dyngjusandur and 542
Lambahraun. Earth Surf. Process. 36,1789-1808. 543
Barnard, J C, Chapman, E G, Fast, J D, Schmelzer, J R, Slusser, J R, Shetter, R E, 2004. An evaluation 544
of the FAST-J photolysis algorithm for predicting nitrogen dioxide photolysis rates under clear and 545
cloudy sky conditions. Atmos. Environ. 38, 3393-3403. 546
Bedjanian, Y, El Zein, A, 2012. Interaction of NO2 with TiO2 surface under UV irradiation: Products 547
study. J. Phys. Chem. A 116, 1758-1764. 548
Bohn, B, Rohrer, F, Brauers, T, Wahner, A, 2005. Actinometric measurements of NO2 photolysis 549
frequencies in the atmosphere simulation chamber SAPHIR. Atmos. Chem. Phys. 5, 493-503. 550
Boichu, M, Chiapello, I, Brogniez, C, Pere, J C, Thieuleux, F, Torres, B, et al., 2016. Current 551
challenges in modelling far-range air pollution induced by the 2014-2015 Baroarbunga fissure 552
eruption (Iceland). Atmos. Chem. Phys. 16, 10831-10845. 553
Butwin, M K, von Löwis, S, Pfeffer, M A, Thorsteinsson, T, 2019. The effects of volcanic eruptions 554
on the frequency of particulate matter suspension events in Iceland. J. Aerosol Sci. 128, 99-113. 555
Chen, H, Nanayakkara, C E, Grassian, V H, 2012. Titanium dioxide photocatalysis in atmospheric 556
chemistry. Chem. Rev. 112, 5919-5948. 557
Crowley, J N, Ammann, M, Cox, R A, Hynes, R G, Jenkin, M E, Mellouki, A, et al., 2010. Evaluated 558
kinetic and photochemical data for atmospheric chemistry: Volume V – heterogeneous reactions on 559
solid substrates. Atmos. Chem. Phys. 10, 9059-9223. 560
Dagsson-Waldhauserova, P, Arnalds, O, Olafsson, H, 2014a. Long-term variability of dust events in 561
Iceland (1949–2011). Atmos. Chem. Phys. 14, 13411-13422. 562
Dagsson-Waldhauserova, P, Arnalds, O, Olafsson, H, Skrabalova, L, Sigurdardottir, G M, Branis, M, 563
et al., 2014b. Physical properties of suspended dust during moist and low wind conditions in Iceland. 564
Icel. Agric. Sci. 27, 25-39. 565
Dagsson-Waldhauserova, P, Arnalds, O, Olafsson, H, Hladil, J, Skala, R, Navratil, T, et al., 2015. 566
Snow–Dust Storm: Unique case study from Iceland, March 6–7, 2013. Aeolian Res. 16, 69-74. 567
Dagsson-Waldhauserova, P, Magnusdottir, A O, Olafsson, H, Arnalds, O, 2016. The Spatial Variation 568
of Dust Particulate Matter Concentrations during Two Icelandic Dust Storms in 2015. Atmosphere 7. 569
Đorđević, D, Tošić, I, Sakan, S, Petrović, S, Đuričić-Milanković, J, Finger, D C, et al., 2019. Can 570
volcanic dust suspended from surface soil and deserts of Iceland be transferred to Central Balkan 571
similarly to African dust (Sahara)? Front. Earth Sci. 7. 572
El Zein, A, Bedjanian, Y, 2012. Interaction of NO2 with TiO2 surface under UV irradiation: 573
measurements of the uptake coefficient. Atmos. Chem. Phys. 12, 1013-1020. 574
El Zein, A, Bedjanian, Y, Romanias, M N, 2013a. Kinetics and products of HONO interaction with 575
TiO2 surface under UV irradiation. Atmos. Environ. 67, 203-210. 576
El Zein, A, Romanias, M N, Bedjanian, Y, 2013b. Kinetics and products of heterogeneous reaction of 577
HONO with Fe2O3 and Arizona test dust. Environ. Sci. Technol. 47, 6325-6331. 578
Engelstaedter, S, Tegen, I, Washington, R, 2006. North African dust emissions and transport. Earth-579
Science Rev. 79, 73-100. 580
23
Finlayson-Pitts, B J, Wingen, L M, Sumner, A L, Syomin, D, Ramazan, K A, 2003. The 581
heterogeneous hydrolysis of NO2 in laboratory systems and in outdoor and indoor atmospheres: An 582
integrated mechanism. Phys. Chem. Chem. Phys. 5, 223-242. 583
George, C, Ammann, M, D’Anna, B, Donaldson, D J, Nizkorodov, S A, 2015. Heterogeneous 584
Photochemistry in the Atmosphere. Chem. Rev. 115, 4218-4258. 585
Gislason, S R, Hassenkam, T, Nedel, S, Bovet, N, Eiriksdottir, E S, Alfredsson, H A, et al., 2011. 586
Characterization of Eyjafjallajökull volcanic ash particles and a protocol for rapid risk assessment. 587
Proc. Nat. Acad. Sci. 108, 7307. 588
Groot Zwaaftink, C D, Arnalds, Ó, Dagsson-Waldhauserova, P, Eckhardt, S, Prospero, J M, Stohl, A, 589
2017. Temporal and spatial variability of Icelandic dust emissions and atmospheric transport. Atmos. 590
Chem. Phys. 17, 10865-10878. 591
Gudmundsson, M T, Thordarson, T, Höskuldsson, Á, Larsen, G, Björnsson, H, Prata, F J, et al., 2012. 592
Ash generation and distribution from the April-May 2010 eruption of Eyjafjallajökull, Iceland. Sci. 593
Rep. 2, 572. 594
Hazenkamp-von Arx, M E, Götschi, T, Ackermann-Liebrich, U, Bono, R, Burney, P, Cyrys, J, et al., 595
2004. PM2.5 and NO2 assessment in 21 European study centres of ECRHS II: annual means and 596
seasonal differences. Atmos. Environ. 38, 1943-1953. 597
Herrmann, J M, 2005. Heterogeneous photocatalysis: state of the art and present applications. Top. 598
Catal. 34, 49-65. 599
Ibrahim, S, Romanias, M N, Alleman, L Y, Zeineddine, M N, Angeli, G K, Trikalitis, P N, et al., 600
2018. Water interaction with mineral dust aerosol: Particle size and hygroscopic properties of dust. 601
ACS Earth Space Chem. 2, 376-386. 602
Ilyinskaya, E, Schmidt, A, Mather, T A, Pope, F D, Witham, C, Baxter, P, et al., 2017. Understanding 603
the environmental impacts of large fissure eruptions: Aerosol and gas emissions from the 2014–2015 604
Holuhraun eruption (Iceland). Earth Planet. Sci. Lett. 472, 309-322. 605
Joshi, N, Romanias, M N, Riffault, V, Thevenet, F, 2017. Investigating water adsorption onto natural 606
mineral dust particles: Linking DRIFTS experiments and BET theory. Aeolian Res. 27, 35-45. 607
Kebede, M A, Bish, D L, Losovyj, Y, Engelhard, M H, Raff, J D, 2016. The role of iron-bearing 608
minerals in NO2 to HONO conversion on soil surfaces. Environ. Sci. Technol. 50, 8649-8660. 609
Kleffmann, J, 2007. Daytime Sources of Nitrous Acid (HONO) in the Atmospheric Boundary Layer. 610
ChemPhysChem 8, 1137-1144. 611
Lasne, J, Romanias, M N, Thevenet, F, 2018. Ozone Uptake by Clay Dusts under Environmental 612
Conditions. ACS Earth Space Chem. 2, 904-914. 613
Li, H J, Zhu, T, Zhao, D F, Zhang, Z F, Chen, Z M, 2010. Kinetics and mechanisms of heterogeneous 614
reaction of NO2 on CaCO3 surfaces under dry and wet conditions. Atmos. Chem. Phys. 10, 463-474. 615
Mellouki, A, Wallington, T J, Chen, J, 2015. Atmospheric chemistry of oxygenated volatile organic 616
compounds: Impacts on air quality and climate. Chem. Rev. 115, 3984-4014. 617
Moroni, B, Arnalds, O, Dagsson-Waldhauserová, P, Crocchianti, S, Vivani, R, Cappelletti, D, 2018. 618
Mineralogical and chemical records of icelandic dust sources upon Ny-Ålesund (Svalbard Islands). 619
Front. Earth Sci. 6. 620
Nault, B A, Garland, C, Wooldridge, P J, Brune, W H, Campuzano-Jost, P, Crounse, J D, et al., 2016. 621
Observational constraints on the oxidation of NOx in the upper troposphere. J. Phys. Chem. A 120, 622
1468-1478. 623
Ndour, M, Nicolas, M, D’Anna, B, Ka, O, George, C, 2009. Photoreactivity of NO2 on mineral dusts 624
originating from different locations of the Sahara desert. Phys. Chem. Chem. Phys. 11, 1312-1319. 625
Ovadnevaite, J, Ceburnis, D, Plauskaite-Sukiene, K, Modini, R, Dupuy, R, Rimselyte, I, et al., 2009. 626
Volcanic sulphate and arctic dust plumes over the North Atlantic Ocean. Atmos. Environ. 43, 4968-627
4974. 628
Perring, A E, Pusede, S E, Cohen, R C, 2013. An observational perspective on the atmospheric 629
impacts of alkyl and multifunctional nitrates on ozone and secondary organic aerosol. Chem. Rev. 630
113, 5848-5870. 631
Pfeffer, M A, Bergsson, B, Barsotti, S, Stefansdottir, G, Galle, B, Arellano, S, et al., 2018. Ground-632
based measurements of the 2014-2015 Holuhraun volcanic cloud (Iceland). Geosciences 8. 633
24
Rodriguez, J A, Jirsak, T, Liu, G, Hrbek, J, Dvorak, J, Maiti, A, 2001. Chemistry of NO2 on oxide 634
surfaces: Formation of NO3 on TiO2(110) and NO2↔O vacancy interactions. J. Am. Chem. Soc. 123, 635
9597-9605. 636
Romanias, M N, Bedjanian, Y, Zaras, A M, Andrade-Eiroa, A, Shahla, R, Dagaut, P, et al., 2013. 637
Mineral oxides change the atmospheric reactivity of soot: NO2 uptake under dark and UV irradiation 638
conditions. J. Phys. Chem. A 117, 12897-12911. 639
Romanias, M N, El Zein, A, Bedjanian, Y, 2012. Heterogeneous interaction of H2O2 with TiO2 surface 640
under dark and UV light irradiation conditions. J. Phys. Chem. A 116, 8191-8200. 641
Romanias, M N, Zeineddine, M N, Gaudion, V, Lun, X, Thevenet, F, Riffault, V, 2016. 642
Heterogeneous interaction of isopropanol with natural Gobi dust. Environ. Sci. Technol. 50, 11714-643
11722. 644
Romanias, M N, Zeineddine, M N, Riffault, V, Thevenet, F, 2017. Isoprene heterogeneous uptake and 645
reactivity on TiO2: A kinetic and product study. Int. J. Chem. Kinet. 49, 773-788. 646
Romanías, M N, Ourrad, H, Thévenet, F, Riffault, V, 2016. Investigating the heterogeneous 647
interaction of VOCs with natural atmospheric particles: Adsorption of limonene and toluene on 648
Saharan mineral dusts. J. Phys. Chem. A 120, 1197-1212. 649
Romer, P S, Wooldridge, P J, Crounse, J D, Kim, M J, Wennberg, P O, Dibb, J E, et al., 2018. 650
Constraints on aerosol nitrate photolysis as a potential source of HONO and NOx. Environ. Sci. 651
Technol. 52, 13738-13746. 652
Schneider, J, Matsuoka, M, Takeuchi, M, Zhang, J, Horiuchi, Y, Anpo, M, et al., 2014. Understanding 653
TiO2 photocatalysis: Mechanisms and materials. Chem. Rev. 114, 9919-9986. 654
Tang, M, Cziczo, D J, Grassian, V H, 2016. Interactions of sater with mineral dust aerosol: Water 655
adsorption, hygroscopicity, cloud condensation, and ice nucleation. Chem. Rev. 116, 4205-4259. 656
Tang, M J, Cox, R A, Kalberer, M, 2014. Compilation and evaluation of gas phase diffusion 657
coefficients of reactive trace gases in the atmosphere: volume 1. Inorganic compounds. Atmos. Chem. 658
Phys. 14, 9233-9247. 659
Tang, M J, Huang, X, Lu, K D, Ge, M F, Li, Y J, Cheng, P, et al., 2017. Heterogeneous reactions of 660
mineral dust aerosol: implications for tropospheric oxidation capacity. Atmos. Chem. Phys. 17, 11727-661
11777. 662
Thorsteinsson, T, Gísladóttir, G, Bullard, J, McTainsh, G, 2011. Dust storm contributions to airborne 663
particulate matter in Reykjavík, Iceland. Atmos. Environ. 45, 5924-5933. 664
Topaloglou, C, Kazadzis, S, Bais, A F, Blumthaler, M, Schallhart, B, Balis, D, 2005. NO2 and HCHO 665
photolysis frequencies from irradiance measurements in Thessaloniki, Greece. Atmos. Chem. Phys. 5, 666
1645-1653. 667
Urupina, D, Lasne, J, Romanias, M N, Thiery, V, Dagsson-Waldhauserova, P, Thevenet, F, 2019. 668
Uptake and surface chemistry of SO2 on natural volcanic dusts. Atmos. Environ. 217, 116942. 669
Vignelles, D, Roberts, T J, Carboni, E, Ilyinskaya, E, Pfeffer, M, Dagsson Waldhauserova, P, et al., 670
2016. Balloon-borne measurement of the aerosol size distribution from an Icelandic flood basalt 671
eruption. Earth Planet. Sci. Lett. 453, 252-259. 672
von Schneidemesser, E, Monks, P S, Allan, J D, Bruhwiler, L, Forster, P, Fowler, D, et al., 2015. 673
Chemistry and the linkages between air quality and climate change. Chem. Rev. 115, 3856-3897. 674
Wilson, T M, Cole, J W, Stewart, C, Cronin, S J, Johnston, D M, 2011. Ash storms: impacts of wind-675
remobilised volcanic ash on rural communities and agriculture following the 1991 Hudson eruption, 676
southern Patagonia, Chile. Bull. Volcanol. 73, 223-239. 677
Zein, A E, Romanias, M N, Bedjanian, Y, 2014. Heterogeneous interaction of H2O2 with Arizona test 678
dust. J. Phys. Chem. A 118, 441-448. 679
Zeineddine, M N, Romanias, M N, Gaudion, V, Riffault, V, Thevenet, F, 2017. Heterogeneous 680
interaction of isoprene with natural Gobi dust. ACS Earth Space Chem. 1, 236-243. 681
682 683 684
25
Tables.
685
Table 1: Product yields of NO and HONO determined for the five volcanic samples under fixed 686
experimental conditions [NO2] = 60ppbV and RH = 30% under dark and simulated sunlight radiation. 687
Volcanic sample Yield NO Yield HONO Total yield
Dark Light Dark Light Dark Light
Eyjafjallajökull typical ash 28%±4% 48%±7% 71%±11% 53%±8% 99%±15% 101%±15% Mýrdalssandur 22%±3% 44%±7% 52%±8% 56%±8% 74%±11% 100%±15% Hagavatn 37%±6% 45%±7% 60%±9% 62%±9% 97%±15% 107%±16% Dyngjusandur 39%±6% 50%±8% 37%±6% 38%±6% 76%±11% 88%±13% Maelifellssandur 28%±4% 37%±6% 48%±7% 47%±7% 76%±11% 84%±13% 688
26
Figures
689 690
Fig. 1: Schematic representation of the coated-wall flow-tube (CWFT) reactor used in this study. The 691
space filled with the coolant in between the two walls is shaded in blue. The volcanic sample coating 692
the inner surface of the Pyrex tube is shown in gray. The gas phase was monitored in real time with a 693
Nitrogen oxide (NOx) analyzer, a long path absorption photometer (LOPAP) and occasionally with a 694
cavity attenuated phase shift (CAPS) NO2 analyzer. 695
696 697 698
27
Fig. 2: Absorption spectra of NO2 and possible interferences (HONO, NO3) along with the spectral 699
output of the Light-emitting diode (LED) centered at 395 nm. 700
701 702 703 704
28
Fig. 3: Typical experiment of NO2 adsorption/reaction on Hagavatn volcanic sample where all 705
instruments were coupled with the flow tube reactor. Left vertical axis corresponds to the 706
concentration profile of NO2, [NO2]. The concentrations profiles of NO and HONO, denoted as [NO] 707
and [HONO], respectively, are also displayed (right vertical axis). γss(dark) and γss(sunlight) refer to 708
the data averaged to determine the uptake coefficients under dark and simulated sunlight conditions, 709 respectively. 710 711 712 713
29
Fig. 4: Uptake coefficients of NO2 (γss,BET) on Hagavatn volcanic sample as a function of initial 714
concentration under dark (γss,BET (dark)) and simulated sunlight irradiation (γss,BET (simulated 715
sunlight)). Error bars denote the overall uncertainty on γss,BET determination (ca. 25%) that arise mostly 716
from the determination of Specific surface area (SSA). The solid and dashed lines corresponds to the 717
fit of experimental data using an empirical power function, under dark and simulated sunlight 718
radiation respectively. Temperature was set at T = 293 K, and relative humidity, RH = 30% 719
720 721 722
30
Fig. 5: Uptake coefficients of NO2 on Hagavatn volcanic sample as a function of relative humidity 723
under darkand simulated sunlight irradiation. Error bars reflects the overall uncertainty on γss,BET 724
determination (ca. 25%) that arise mostly from the determination of SSA. The solid and dashed lines 725
corresponds to the average value of the γss,BET. 726
727 728 729
31
Fig. 6: Uptake coefficients of NO2 as a function of volcanic samples origin under dark and simulated 730
sunlight irradiation. For comparison purposes, the recommended uptake coefficient value proposed by 731
the international union of pure and applied chemistry (IUPAC) panel for mineral oxides under dark 732
and dry conditions is given. 733
32 735
Fig. 7: Product yields of NO (cycles) and HONO (squares) formation determined as a function of 736
relative humidity upon reaction of NO2 with Hagavatn volcanic sample under dark and simulated 737
sunlight radiation. Error bars reflects the overall uncertainty on the product yields (ca. 15%). The solid 738
and dashed lines are the empirical fit of experimental results (both dark and simulated sunlight) to 739
demonstrate the corresponding trends of NO and HONO yields versus RH. 740