HAL Id: hal-02357412
https://hal.univ-angers.fr/hal-02357412
Submitted on 20 Oct 2020
HAL is a multi-disciplinary open access
archive for the deposit and dissemination of sci-entific research documents, whether they are pub-lished or not. The documents may come from teaching and research institutions in France or abroad, or from public or private research centers.
L’archive ouverte pluridisciplinaire HAL, est destinée au dépôt et à la diffusion de documents scientifiques de niveau recherche, publiés ou non, émanant des établissements d’enseignement et de recherche français ou étrangers, des laboratoires publics ou privés.
Distributed under a Creative Commons Attribution| 4.0 International License
to 24-year-old
Sandrine Gaymard, Thomas Besson, Mathieu Bessin, Angel Egido, Nolwen
Coutelle, Rose Eberhardt, Noémie Hennequin
To cite this version:
Sandrine Gaymard, Thomas Besson, Mathieu Bessin, Angel Egido, Nolwen Coutelle, et al.. Driving and use of the mobile phone: a study among 18 to 24-year-old. Advances in Social Sciences Research Journal, 2019, 6 (3), pp.109 - 125. �10.14738/assrj.63.6247�. �hal-02357412�
Advances in Social Sciences Research Journal – Vol.6, No.3 Publication Date: Mar. 25, 2019 DoI:10.14738/assrj.63.6247. Gaymard, S., Besson, T., Bessin, M., Egido, A., Coutelle, N., Eberhardt, R., & Hennequin, N. (2019). Driving and use of the mobile phone: a study among 18 to 24-year-old. Advances in Social Sciences Research Journal, 6(3) 109-125. Copyright © Society for Science and Education, United Kingdom 109
Driving and Use of The Mobile Phone: A Study Among
18 to 24-Year-Old
Gaymard Sandrine University of Angers, Laboratoire de Psychologie des Pays de la Loire (LPPL, EA 4638). SFR Confluences, Univ Angers-Univ Nantes. France Besson Thomas University of Angers, Laboratoire de Psychologie des Pays de la Loire (LPPL, EA 4638). SFR Confluences, Univ Angers-Univ Nantes. France Bessin Mathieu University of Angers, Laboratoire de Psychologie des Pays de la Loire (LPPL, EA 4638). SFR Confluences, Univ Angers-Univ Nantes. France Egido Angel Catholic University, Laboratoire de Psychologie des Pays de la Loire (LPPL, EA 4638). SFR Confluences, Univ Angers-Univ Nantes. France Coutelle Nolwen University of Angers, Laboratoire de Psychologie des Pays de la Loire (LPPL, EA 4638). SFR Confluences, Univ Angers-Univ Nantes. France Eberhardt Rose University of Angers, Laboratoire de Psychologie des Pays de la Loire (LPPL, EA 4638). SFR Confluences, Univ Angers-Univ Nantes. France Hennequin Noémie University of Angers, Laboratoire de Psychologie des Pays de la Loire (LPPL, EA 4638). SFR Confluences, Univ Angers-Univ Nantes. France ABSTRACTWhile we know that using the telephone when driving increases the risk of accidents and that 18 to 24 year-olds are a fringe of the population that is particularly affected by fatal accidents on the road, we lack information concerning the use of the mobile phone in this age group. This study carried out with 208 young drivers aims to gather data, analyses their behavior at the wheel with the mobile plus their beliefs and awareness of risk. Three contexts are focused on: stopping at the red light, driving during the rush hour and highways. The findings highlight the importance of messaging and the influence of the context on the use of the mobile. We observe an inverse effect between the speed and messaging. While young people declare they are aware of certain risks, it concerns more the risks penalties and accordingly they appear to be impervious to road safety campaigns concerning the mobile phone behind the wheel. On this subject few major differences are to be found between male and female drivers and between very young and young drivers. The use of the mobile while driving among 18 to 24-year-olds therefore presents universal characteristics of use from moment or the driver (male or female) is a little more experimented
INTRODUCTION: YOUNG DRIVERS AND THE PROBLEM OF THE PHONE WHILE DRIVING
Road insecurity has been clearly identified since the 1970s as a global public health issue [1]. According to the latest report of the World Health Organization [2], in 2013, 1.25 million people died in a road accident in the world. This figure has grown steadily since 2007 with the increase in motorization worldwide and population growth. While road accidents are among the leading causes of death in all age groups, they are the leading cause of death among 15-19 year olds. According to WHO (2015), more than a thousand children and young adults under the age of 25 every day are victims of road accidents, making road insecurity the leading cause of death among 10-24 years. In France, according to the National Interministerial Road Safety Observatory (ONISR) [3], 18-25 year olds are particularly exposed since they represent only 9% of the population but 20% of those killed on the roads. According to ONISR, in 2015, of all the young drivers involved in a bodily injury, 75% are men. Note that men account for 85% of killed drivers while the ratio of passengers killed is more balanced (47% of passengers killed being women). Men are also clearly in the majority in road accidents with alcohol or drugs, accounting for 92% of drivers under the influence of alcohol and 91% under the influence of drugs involved in a fatal accident. As a result, young men are according to the statistics, clearly over-risky on the road, the ONISR (2017) indicates that 82% of invalidated driving license concern men.
While behavioral factors of road insecurity, such as speeding or the use of psychoactive substances have been well known for many years, the use of a phone or smartphone has been identified more recently and concerns, according to the ONISR (2017), 10% of the bodily accidents. In recent years, the mobile phone has become an integral part of our lives, with mobile subscriptions totaling more than seven billion worldwide in 2016 [4]. In the early 2000s, the use of mobile phones was limited to calls and text messaging, however, the current smartphones allow other functions through Internet access, games, social networks, television, photography or geolocation.
According to Lopez-Fernandez et al (2017) [5], mobile phones have become the most widely used technology in the history of humankind, with 2.08 billion users of 4G networks in the world and more than 5 billion expected in 2019. Studies, particularly in Asia, address the perceived addiction and addictive use of mobile phones among young adults and suggest that the use of smartphones as socialization tools [6] can cause "over-attachment" [7] and be considered excessive or addictive behavior. Although the increased use of addictive mobile phones is attracting more and more attention, the data available on young adults in Europe are relatively scarce. Existing studies tend to focus on adolescence and have been conducted in southern European countries, such as Spain [8-10] and Italy [11]. According to Arnett (2000) [12], emerging adults (aged 18 to the late twenties) are more prone to risky behaviors, including the use of dangerous substances and excessive gambling [13]. However there is a lack of knowledge about how young adults use mobile phones in light of rapid technological change. In France, a survey by the Deloitte Cabinet1 indicates that in 2016, 77% of French
people aged between 18 and 75 years old say they own a smartphone. This survey also reveals that the French check their smartphone on average 26.6 times a day and that for 18-24 years, this figure almost doubles with an average of 50 times per day. This intensive use, especially among the youngest, can generate risky behavior: according to this survey, 58% of French people recognize that they sometimes consult their smartphone while driving and 66% while
1
Copyright © Society for Science and Education, United Kingdom
111
they cross the street. According to a study carried out by the Association Road Prevention, phoning while driving increases the risk of having an accident by 3 because the attention of the driver who calls is diverted from the driving task. In France there are few studies that report the use of the phone while driving by the drivers themselves. Gaymard et al. (submitted) [14] studied the practices of a group of salespeople of all ages and showed that the risks taken were important. In Australia, Pennay (2006) [15] reports that 3 in 5 drivers aged 18 to 24 report having sent or received an SMS while driving compared to 1 in 3 drivers aged over 25. The use of the mobile phone is thus particularly marked among young people and represents an increased risk for their safety and a major source of distraction [16]. These distractions can be of different types: first physical when the hand of the driver is moved from the steering wheel to take the phone, answer, end the call or compose a message; then visual when the driver's eyes are diverted from the road to look for the phone, see the buttons, read a message, etc., then cognitive, even the best drivers find it difficult to process two or more information at the same time.
Talking with a mobile phone while driving can lead to attention, focus and judgment errors because the driver's attention is divided between the driving task and the conversation [17-18]. It is precisely this type of cognitive distraction that has major consequences on driver behavior. When the driver is distracted, his attention is temporarily divided between the cognitive resources: the capacity of reflection serves on the one hand to analyze the driving situation and on the other hand the current conversation. As shown in the Redelmeier and Tibshirani (1997) [19] epidemiological study of 699 Canadian drivers involved in material road accidents due to mobile phone use, distractions lead drivers to drive several meters without paying attention. So when they travel at 60 km/h dialing a number, they drive 140 meters more in 5 seconds while committing more errors. Work on eye movements demonstrates the impact of the dual task (driving and telephone) on the detection of visual elements [20-23].
This distraction caused by the use of the phone while driving seems to vary according to the gender. Indeed, Irwin, Chekaluk and Geaghan (2011) [24] using a driving simulation task examined the effects of mobile phone conversation on the number of errors made by the driver. This study showed gender differences, with female drivers appearing to be more distracted on the phone than men. Conversely, the men seemed more distracted when they were talking with a passenger. Female drivers were particularly inclined to deviate from their road trajectories, while male drivers tended to commit more errors related to speeding or signaling. Finally, at the regulatory level, the Highway Code clearly prohibits the use of the "hand-held" telephone and headphones. A call to the ear or the sending of an SMS thus corresponds to an offense punishable with a fourth class fine of 135 € and a withdrawal of 3 points on the driving license. This 3-point withdrawal is a particularly dissuasive measure for a young driver who in the first 3 years of his (her) driving career only has a probationary license with a starting credit of 6 points.
As part of a tightening of measures to ban the phone from driving, measure number 13 of the Interdepartmental Committee on Road Safety of 09/01/2018, states that from 2019, "when the phone is held in hand and that at least one other infraction of the Highway Code is committed at the same time ", the driving license may be retained by the police and an administrative suspension of the driving license by the prefect may follow. The issue of "Bluetooth connection" is more problematic because it is difficult for the police to identify.
Nevertheless in the event of an accident, the driver's liability may be incurred if it is established that the driver's inattention is the cause of the loss of control of the vehicle. In this case, a driver found responsible for an accident while phoning will be criticized for non-compliance with Article R412-6 of the Highway Code which states that "Every driver must be constantly in good position to execute conveniently and without delay all the maneuvers incumbent on it."
In this research, the aim is to evaluate the use of mobile phones while driving at the age of 18-24, depending on the traffic context. To this end, the characteristics of the young men and women surveyed, their perceptions of the risks and driving experiences due to a misuse of the mobile phone were collected. After the presentation of the method and results, these will be discussed in the light of the literature and in a preventive perspective. METHOD Population The sample consists of 208 young male and female drivers aged between 18 and 24-years-old. The average age is 21.33 years (standard deviation = 1.59). Tool The questionnaire was designed with young male and female drivers as part of tutorials. It is composed of 27 closed questions. Six relate to socio-demographic criteria (gender, age, occupation, years of driving license, possession of a personal vehicle and duration). Nine questions relate to the use of the telephone: frequency of use, uses, equipment, call handling behaviors / SMS according to three specific contexts (red light, rush hour city, highway).
Three questions relate to the self-assessment of the driver on his (her) driving, his (her) definition of the good driver and the attribution of dangerousness according to the profiles (men/women and age of the drivers). Three questions concern the experience of sanctioned offenses and the link with telephone usage as well as the accident experience (victim/responsible), two other questions related to the impact of an accident/sanction and the impact of an awareness campaign on the use of the phone while driving. Finally, three questions focused on perception and knowledge of risks. In order to have more specific access to young people, the questionnaire was posted on social networks, a collection technique that has largely developed in recent years [25].
RESULTS. Characteristics of the population
Among the 208 youth, 155 women (74.5%) and 53 men (25.5%) responded to the questionnaire. The respondents are 70% students and 18% employees. For the other categories of workers, we have 7 intermediate professionals, 5 respondents for managers and intellectual professions and 5 others for craftsmen, traders and head of a company. We then have 3 people without professional activity (other than students) and finally 1 agric farmer. Respondents have had a driving license for an average of 3.19 years (standard deviation = 1.57). Looking at the duration of the driving license, 64 have been licensed for less than 3 years and 144 people have been licensed for at least 3 years. 79.81% of respondents (166) have had personal cars on average for 3.01 years (standard deviation = 1.66). Use of the phone General use and accessories Regarding the frequency of using the mobile phone while driving (scale from 1 = never to 10 = all the time), the average of the sample is 4.04 with a standard deviation of 2.52. There is a significant difference between young people with a personal car (average of 4.33) and those
Copyright © Society for Science and Education, United Kingdom
113
who do not (average of 2.93 ; U = 2252, p <0.001). With regard to the various uses of the phone while driving, the young people questioned answer to use on average their mobile for 2.37 uses (standard deviation=1.28), the recorded minimum being "no use" up to 8 maximum (messages, calls, social networks, mails, music, games, GPS and others).The phone is first used for GPS, the following functions being messages, calls and music. The other uses are lesser with social networks, mails, games, and 0.5% for the photo, for the Siri vocal assistant of the Apple brand as well as for the Youtube video streaming platform (Figure 1). Figure 1: Use of the phone functions while driving While some drivers claim to own up to four accessories associated with the phone, others say they use none while driving. The average number of declared accessories is 1.25 (standard deviation = 0.98). Just like the different uses, some are more present in car interiors than others. We find more speakers, phone holders and Bluetooth accessories. 26.4% of the respondents answered that they did not have any. Then come those who answer having a hands-free kit and a jack plug.
Table 1. The accessories (in %)
Bluetooth Hands-free kit Phone holders Speakers Jack plug None
I have 32.2 11.5 37.5 41.8 1.0 26.4
Use of phone while driving in specific contexts
Three specific contexts were studied: behavior while stopping at a red light, behavior in the city center during rush hour and behavior on the highway. Regarding the reception of an SMS in these three contexts, the behaviors are significantly different. Those stopped at a red light are less likely to ignore the message (they consult it more or answer); on the other hand they look more around. In the case of city traffic in rush hour and on highway, the message is more ignored and the phone less used. However, young interviewed say they are more likely to read the message on the highway and respond it more easily in city (Table 2). 56.7 50.5 10.1 49 1.4 63.9 4.8 0.5 0.5 0.5 0 10 20 30 40 50 60 70 Messages/SMS Calls Social networks Music Games GPS Mails Photos Siri vocal assistant Youtube
Table 2: Behavior following receipt of an SMS according to the 3 contexts (in percentage). Global results. Red light RL City during rush hour RH Highway H Chi-squared (Friedman test) p-value I read only the SMS 49.5*** 26.4*** 32.7*** 31.61 p<0,001 I read and I answer 29.3*** 19.7*** 15.9*** 20.46 p<0,001 I look around and I answer 26.4*** 16.8*** 7.2*** 35.82 p<0,001 I stop the car to consult 0 1.0 0.5 2.0 p=0,368 I ignore the message 21.2*** 52.4*** 52.4*** 76.82 p<0,001 Other 1.4 0.5 1.4 1.33 p=0,513 When we look more closely at the comparison of different contexts two-by-two, we see that for conditions "read only SMS", "read and answer to SMS", "ignore SMS", the significant differences are between the Red Light [RL] and city during Rush Hour [RH] contexts and between the RL and Highway [H] contexts. These conditions do not show significant differences between the RH and H contexts. Finally, for the condition "I look around and I answer", comparisons of the two-by-two contexts show significant differences between each context (Table 3). Table 3 : Behavior following receipt of an SMS according to the 3 contexts: comparison of different contexts two-by-two
Behavior situations Z p-value I read only SMS RL – RH -5.18 <0.001*** RH – H -1.69 0.091 RL – H -3.71 <0.001*** I read and I answer to SMS RL – RH -3.16 0.002** RH – H -1.33 0.182 RL – H -4.13 <0.001*** I Look around and I answer RL – RH -2.95 0.003** RH – H -3.43 0.001*** RL – H -5.44 <0.001*** I stop the car to consult RL – RH -1.41 0.157 RH – H -0.58 0.564 RL – H -1.0 0.317 I ignore the SMS RL – RH -7.41 <0.001*** RH – H 0 1.0 RL – H -7.51 <0.001*** Other RL – RH -1.0 0.317 RH – H -1.0 0.317 RL – H 0 1.0
Concerning the reception of a call, one finds very significant differences according to the contexts. There is significantly more responses at the red light (Table 4).
Copyright © Society for Science and Education, United Kingdom 115 Table 4: Behavior following receipt of a call according to the 3 contexts (in percentage). Red light RL City during rush hour RH Highway H Chi-squared (Friedman test) p-value I answer with one of the aforementioned accessories 47.6*** 38.5*** 39.9*** 13.91 p=0.001 I answer the phone by hand 10.6 6.7 8.2 4.67 p=0.97 I look around and I answer 10.6*** 7.2*** 3.4*** 18.78 p<0.001 I stop the car to answer 4.8 2.9 2.4 2.80 p=0.247 I ignore the call 38.0*** 53.8*** 51.9*** 34.14 p<0.001 Other 2.4 2.9 2.4 0.40 p=0.819 When we look more closely at the comparison of different contexts two-by-two, we see that for the conditions "I answer with accessory" and "I ignore the call", the significant differences are between the contexts RL and RH and between the RL and H contexts. These conditions do not show significant differences between the RH and H contexts. For the condition "answer the phone by hand" the significant differences are between the RL and RH contexts; we answer significantly less with the phone by hand in the latter context. Finally, for the condition "look around and answer" the significant differences are between the 3 contexts taken two-by-two (Table 5).
Table 5: Behavior following receipt of a call according to the 3 contexts: comparison of different contexts two by two
Behavior situations Z p-value I answer with one of the aforementioned accessories RL – RHRH – H -3.66-0.56 <0.001***0.577 RL – H -2.74 0.006** I answer the phone by hand RL – RH -2.31 0.021* RH – H -0.90 0.366 RL – H -1.15 0.251 I look around and I answer RL – RH -2.11 0.035* RH – H -2.53 0.011* RL – H -3.87 <0.001*** I stop the car to answer RL – RH -1.26 0.206 RH – H -0.38 0.705 RL – H -1.39 0.166 I Ignore the call RL – RH -5.28 <0.001*** RH – H -0.65 0.516 RL – H -4.77 <0.001*** Other RL – RH -0.45 0.655 RH – H -0.58 0.564 RL – H 0 1.0 Pearson χ² tests or Fisher exact tests were performed to compare the gender variable. The data did not allow us to find significant differences except for one situation: during a call, men (17%) are more likely than women (5.1%) to answer the phone by hand on the highway (Fisher's exact test, p = 0.016).
Evaluation of the driving and estimated danger according to the profiles.
Young male and female drivers had to do self-assessment of their driving on a scale of 1 (extremely bad driver) to 10 (extremely good driver). The average obtained is 6.90 (standard deviation = 1.28) with a minimum of 2 and a maximum of 10. A Mann-Whitney test emphasizes that a significant difference exists between men and women. Men self-report better drivers (7.30) than women (6.77) (U = 3282.500, p = 0.023). Respondents then had to choose the criteria defining a good driver. The criteria most chosen are anticipation, caution and not driving while having drunk. The least chosen are: do not drive while tired, regular maintenance of the vehicle and non-use of the phone while driving (Figure 2).
Figure 2: The characteristics that best define a good driver according to young male and female drivers (in percentage).
Pearson χ² tests were performed. The data show significant results depending on the possession of a personal car but also according to gender. Young people with a personal car choose more "respect of the others" than those who do not have one (χ² = 4.24, df = 1; p-value = 0.039). On the other hand, those who own a personal car choose less respect for roadsigns than those who do not have a car (χ² = 7.32, df = 1; p-value = 0.007) (Table 6). With regard to gender, men choose more the term “anticipation” than women (χ² = 6.09, df= 1, p-value = 0.014). Similarly, the term “attention” is a criterion more chosen by men (χ² = 4.02, df = 1, p-value = 0.045). But women choose more the term “caution” than men (χ² = 5.32, df = 1, p-value = 0.021) (Table 6). 49.5 43.6 28.9 35.1 24 12 23.5 4.3 9.1 36.1 3.6 0 10 20 30 40 50 60 Anticipation Caution Attention Liability Respect of the others Respect of speed limit Respect of roadsigns Regular maintenance of the vehicle Non-use of the phone while driving Not driving while having drunk Do not drive while tired
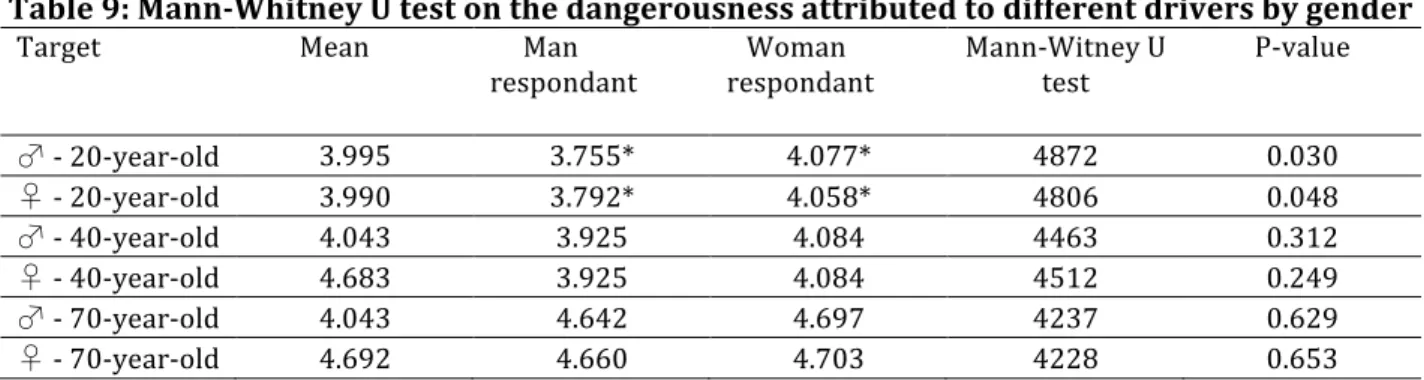
Copyright © Society for Science and Education, United Kingdom 117 Table 6. Criteria defining a good driver according to gender and owning or not a car (in %) General (n = 208) I have a own car Gender No (n = 42) Yes (n = 166) Women (n = 155) men (n = 53) Anticipation 49.5 59.5 47.0 44.5* 64.2* Caution 43.6 47.6 42.8 48.4* 30.2* Attention 28.9 26.2 29.5 25.2* 39.6* Liability 35.1 33.3 35.5 34.8 35.9 Respect of the others 24.0 11.9* 27.1* 24.5 22.6 Respect of speed limit 12.0 9.5 12.7 11.0 15.1 Respect of roadsigns 13.5 26.2** 10.2** 11.6 18.9 Regular maintenance of the vehicle 4.3 2.4 4.8 5.2 1.9 Not use the phone while driving 9.1 9.5 9.0 8.4 11.3 Not driving while having drunk 36.1 28.6 38.0 36.8 34.0 Not driving being tired 3.6 4.8 3.6 3.2 5.7 Respondents were asked to rate dangerousness of the phone while driving (ranging from 1 = very low to 5 = very high) depending on age and gender. Following a very significant Friedman test (Friedman test = 466.73, df = 5, p <0.001), Wilcoxon tests were performed to determine what was different. Thus, 70-year-old male and female drivers are perceived to be significantly more dangerous than male and female drivers aged 20 and 40 (Table 7). If we do not observe a significant difference between men aged 20 and 40, or between women aged 20 and 40, each age group following gender is significantly different with male and female drivers 70-year-old (Table 8). If we look more closely at the ratings of young male and female drivers in different age groups following gender, we can see that there are significant differences in the attribution of their own age group. In particular, we note that young female drivers attribute to the profile "20-year-old female driver" a significantly higher level of dangerousness than that attributed to the "20-year-old male driver" profile. Table 7. Attribution of dangerousness in the use of phone while driving according to age and gender of the driver. Male driver at phone Female driver at phone
Mean Standard deviation Mean Standard deviation 20-year-old 4.0 0.84 3.99 0.84 40-year-old 4.04 0.83 4.04 0.82 70-year-old 4.68*** 0.68 4.69*** 0.67 Table 8 : Age-gender comparison test Compared categories W de Wilcoxon P Men 20-year-old/ Men 40-year-old -1.27 0.204 Women 20-year-old / Women 40-year-old -1.41 0.159 M2 403 / M 70 -9.89 <0.001 W4 40/ W 70 -9.99 <0.001 M 20/ M 70 -9.66 <0.001 W 20/ W 70 9.80 <0.001 2 Men 3 Year-old 4 Women
Table 9: Mann-Whitney U test on the dangerousness attributed to different drivers by gender
Target Mean Man respondant Woman respondant Mann-Witney U test P-value - 20-year-old 3.995 3.755* 4.077* 4872 0.030 - 20-year-old 3.990 3.792* 4.058* 4806 0.048 - 40-year-old 4.043 3.925 4.084 4463 0.312 - 40-year-old 4.683 3.925 4.084 4512 0.249 - 70-year-old 4.043 4.642 4.697 4237 0.629 - 70-year-old 4.692 4.660 4.703 4228 0.653 Experiences with offenses, accidents and behavioral changes
Among the 208 respondents, 3.4% report being arrested or punished for phoning while driving. Respondents were then asked about their status as responsible or victim of an incident/ accident; they are more numerous in the latter case (Table 10). A non-mandatory question asked about the relationship between incident/accident experienced and phone use; among the 175 respondents, 6.3% confirm the link with the use of the phone. Table 10 : Experiences of sanctions/accidents reported by the young N Yes (%) Has been arrested/punished (fine, loss of points) for using phone while driving. 208 3.4 Has already been responsible of an incident/accident on the road. 208 13.5 Has already been victim of an incident/accident on the road. 208 29.3
The questions about behavior change report mostly a resistance to change (Table 11). This resistance to change appears to be more pronounced in the condition of "change of behavior following an accident or a penalty ..." (case 1) than in the condition "behavioral change following the viewing of awareness campaigns" (case 2); however, in the latter condition, 16.8% say they have never seen a phone campaign while driving. Once again differential tests were set up but the data did not allow to obtain significant differences. Table 11: Impacts on behavior (in %) Yes and I decreased the use Yes and I stopped the use I did not change my habits I have never seen any awareness campaign concerning the phone at the wheel Case 1= Incident/accident/ arrest/punishement in relation with the phone (n = 123) 14.6 6.5 78.9 / Case 2= Awareness campaigns (n = 208) 30.3 5.3 47.6 16.8
Copyright © Society for Science and Education, United Kingdom
119
Awareness and knowledge of risks.
In the questionnaire, respondents were asked if they were aware of the risks caused by the phone while driving. Of the total of 208 respondents, only 8 young people (3.9%) responded negatively. We can then see that on the risk related to the use of SMS while driving, 38.9% of people give the correct answer among the proposed choices. For the calls, 18.3% gave the correct answer (Table 12). The data did not allow us to find any significant difference in terms of age, gender, car ownership and frequency of use of the mobile phone while driving. Table 12: Multiplied risk awareness for an SMS and a driving call (in %) SMS Multiplied per 5 per 12 (good answer) per 23 per 51 Answers 7.21 38.5 38.9 15.4 CALL (good answer)
Multiplied per 3 Per 8 per 11
Answers 18.3 42.3 39.4
It is important to note that the data did not reveal any significant differences between very young drivers (under 3 years of driving license) and young drivers (3 years of driving license or higher) on all points of the questionnaire. Only one data, by Fisher's exact test, is significantly different between these two groups: very young drivers (17.2%) are more likely to answer "do not use your mobile phone while driving" than young people drivers (5.6%) on the question of criteria defining a good driver (p = 0.007). DISCUSSION This study about using the phone while driving with a group of 208 young people aged 18 to 24 provides important information on their driving behavior. The choice of a survey via social networks is all the more appropriate as the target population is statistically the one who uses social networks the most5. The fact that the majority of respondents are students is not surprising because the survey is started from a university network. The gender disparity (74.5% vs. 25.5%) could not be controlled and is a limitation. The experience of networks in this area shows that in general, women are more mobilized to respond to this type of survey [26].
First, the average frequency of using the phone while driving does not appear to be very high compared to that reported by salespeople [14]. It is not impossible that young drivers had some scruples to declare some of their practices since they also say they are aware of the risks (especially the risk of sanctions) and recognize a lack of "legal" equipment. Earlier work shows that drivers have little scruple in reporting offenses committed [27], but research on the theory of conditionality and legitimate transgressions [28] also reveals that a legal and clear ban cannot justify non-compliance with the rule; the phone while driving is a situation conducive to legitimate transgressions because it is allowed in a condition (with Bluetooth equipment).
5 HTTPS://FR.STATISTA.COM/STATISTIQUES/480837/UTILISATION-RESEAUX-SOCIAUX-FRANCE-AGE/
Results showing a very significant difference in relation with the possession of a personal vehicle (average of 4.33 vs. 2.93) suggest that the overall average would have been higher if all drivers owned a vehicle (20.19% do not have a personal vehicle). This fact necessarily impacts the number of accessories used in the vehicle. Nevertheless, by looking at the frequencies of using the various functions of the telephone, it is found that the GPS function is the first use of the phone while driving (63.9%); these results were also observed in a survey conducted with professionals of all ages [14]. On the other hand, among young people, the messages (SMS) are ahead of the calls (56.7% vs. 50.5%) confirming the importance of text messaging. The music function with a percentage very close to that of calls (49%) is one of the uses that we believe is very specific to the group of young people. Gaymard and Tiplica [29] showed that listening to music was the most popular leisure activity for female students. It would be interesting to know more about the accessories used because only one young driver mentioned the jack plug. Regarding the "legal" equipment rate, it remains rather low despite the legislation that allows the phone while driving only with a Bluetooth system. We do not observe a significant difference in the frequency of use and number of uses of the phone while driving according to gender and the duration of driving license. This study was focused on three specific contexts that seemed appropriate for young people in the exploratory phase: use the phone when stopping at the red light (RL), while driving during the rush hours (RH) and on the highways (H) (SMS and calls). As for the behaviors following the reception of an SMS, they are significantly dependent on the context in which they are. Only the options "I stop my car to consult" and "other" do not show a significant difference depending on the context; the percentages in these two categories are derisory while a good behavior would be to park the car before using the phone.
The results show that young people use their phone much more when they are stopped at a red light, this is the context in which they say the least "I ignore the message" (21.2% against 52.4% for the 2 other contexts). At the red light, at least half of the young people go to read the message. Young people will be more likely to respond to the message when stopping at the red light (RL) (29.3%) than in the other two conditions (19.7% (RH) and highway (15.9% (H)).
When moving into a context of interaction that requires more attention for the driver (RH and H), more than half of the youth will ignore the message; nevertheless in the comparison of these last two contexts young people will dare to respond to SMS more in the context of "rush hour city" (RH) than in the context of "highway" (H); it is deduced that the higher the speed, the less comfortable they are at texting SMS. On the other hand, they are more comfortable for reading SMS when they are on the highway (32.7%) compared to the city context (RH, 26.4%); this can be interpreted by the steady and continuous rhythm that characterizes highway driving where the risks of falling asleep are also well identified [3]. So a monotonous driving environment because it generates boredom can accentuate transgressions [14]. We also observe an opposite effect between looking around before responding and the speed. Thus it is in the RL context, therefore at a standstill, where the percentage is the highest (26.4%) followed by the context RH (16.8%) and H (7.2%). To sum up, more the speed is high and less the young look around before answering. These results being also observed in the case of calls, we will discuss them below.
Young people also act differently depending on the context when they receive a call. If the modalities “I stop my car to answer” or "other" do not present as for SMS significant
Copyright © Society for Science and Education, United Kingdom
121
differences, the modality "I answer to the hand6" significantly differentiates the contexts RL (10.6%) and RH (6.7%). As for SMS, calls are less ignored at the red light (38%) than in other situations (RH = 53.8%, H = 51.9%). It is therefore clear that the red-light situation is associated with more legitimate transgressions [30, 28].
In other words, when one is stopped at a red light, it is more acceptable to disregard the rule and as has been shown, these transgressions are legitimate in the representation even if they constitute real transgressions with the Highway Code. It is interesting to note that young people aged 18-24 are more ignorant of calls than SMS; thus youth prevention should be strongly focused on the use of SMS while driving.
For the calls, we find a decreasing percentage in the modality "I look around and I answer" more pronounced in the RL context (10.6%) followed by the RH (7.2%) and the H (3.4%) contexts. These results can be interpreted by a certain mistrust of the young when they are stopped at the red light. As a reminder, their number of points can be quickly lost. It can be inferred that young people feel that they are less likely to be visible with the phone on the highway than in the city, but these results show that the fear of being seen inhibits the essential preventive behavior which is to evaluate the driving environment. We observe that the only difference that has been noted between men and women in phone management in different contexts is the fact of answering the phone by hand on the highway; men do it significantly more than women.
On the assessment of driving and dangerousness according to the profiles, our results show firstly that men consider themselves better drivers than women. This phenomenon of greater confidence is found in the literature and also explains that men are more subject to comparative optimism and that they take more risks than women [31-34]. However the reality is that male drivers have two to three times more likely to die from a car accident than female drivers7. In the choice of criteria defining a good driver and for the entire sample, we must first note a lack of consensus since no criterion reaches 50%. On the other hand young drivers are more in agreement on the criteria which for them do not have weight in the definition of a good driver. Thus, not regularly maintaining one's vehicle, not driving while tired and not using one's phone while driving are not considered as defining a good driver. Similarly, we observe that the respect of the speeds collects only 12% of choice. It goes without saying that the definition of the term "good driver" can be discussed, but what it represents for young people reflects a certain incompatibility between respect for the rules and the influence of the peer model [35,36]. If we take the case of the telephone, these results may explain the difficulties of reaching this audience in prevention campaigns. Recall that in our sample there are 7 young drivers who report being arrested / sanctioned for using the phone; they are also 61 to declare an accident experience in a driving situation and 11 to admit that it was related to the use of the telephone. In the end they declare in majority that these experiences have not changed their habits. There are few accurate studies of what motorists think of the phone while driving. Some sites like Turbo8 report an estimate of 51% considering that calling at the wheel is dangerous for 6 It should be noted that a decree of April 1, 2003 prohibits the use of a phone held in hand 7 Downloads/2016+05+26+Note+Accidentologie+hommes+femmes%20(1).pdf
oneself and those around him. In this study with young people, they are much more numerous since only 11% of male drivers and 8% of female drivers think that not using their phone while driving is an essential criterion for defining a good driver. In other words, valuing driving also involves using the phone while driving. On the other hand, driving under the influence of alcohol is considered antithetical to the definition of a good driver without, however, garnering an overwhelming majority (36%).
When we compare male and female drivers, we observe among men a more consensual percentage on the first criterion, which according to them defines a good driver since they choose anticipation up to 64.2%. The significant differences between men and women in the choice of criteria relate to anticipation, attention and caution. Men choosing significantly more the first two criteria and women the third. These results may confirm in part those of Irwin, Chekaluk and Geaghan [24] showing greater distraction among female drivers. For young drivers we see that the characteristics of "physical" skills are important. But the problem of lack of anticipation and attention among young drivers is well identified [37]; this could be interpreted as a distortion among male drivers who claim a score of 7.3 out of 10 (extremely good driver). Cautiousness, a criterion most often cited by female drivers reflects a reality: women take less risk while driving than men and have fewer accidents; however women evaluate themselves less good drivers than men do for themselves. When comparing the fact of owning a vehicle or not on these criteria, the differences relate to the respect of others significantly more cited by those who own a vehicle, and the respect of the roadsigns significantly more cited by those who do not have of vehicle.
We can interpret these results by the effect of the driving experience on young drivers. Those who own a vehicle drive more regularly and with experience, the management of interactions becomes more important than the respect of the roadsigns. Moreover, it appears that this experience variable has a negative impact on the phone because the youngest drivers associate significantly more to the definition of the good driver the fact of not using the phone while driving. The message is significantly more present in the minds of very young drivers at a theoretical level but it fades with the driving experience and the use of the phone while driving.
With respect to the attribution of dangerousness with the use of the phone while driving, young male and female drivers attribute significantly more dangerousness to 70-year-old drivers compared to 20-year-olds and 40-year-olds. There are also significant differences in the attribution to the 20-year-old male and female profiles that correspond to the age category of the respondents. Thus male and female respondents consider a 20-year-old male with the phone less dangerous than a woman of the same age. These different results can be interpreted in the light of work on stereotypes [38]. A number of studies show that older people are discriminated against in general and on the road [39, 40]. For example, in a Canadian study, they are considered a threat for road safety by more than 30% of respondents [41]. In fact, they are thought to be more prone to accidents [42]. These stereotypes are even more negative and widespread concerning senior female drivers [43, 44]. We do not observe this here, but it is more specifically about the use of the phone while driving. Seniors are not necessarily the most dangerous on the road according to statistics. We know that there is a decrease in driving performance with age. Work has focused on the problem of dual tasks. The study by Pereira, Bruyas and Simoes [45] shows that seniors in the task of driving with the mobile phone have lower performance compared to the youngest; other studies have ambivalent results among
8
Copyright © Society for Science and Education, United Kingdom 123 young drivers [46]. Research shows also that seniors tend to avoid driving situations in which they are less confident, such as driving at night or when it is raining [47,48]. Regarding the responses that the young female drivers of this study attributed to drivers of the same age group, we believe that the instruction was able to activate in women in particular the threat of stereotype [49]. For example, Spencer, Steele, and Quinn [50] have studied this effect on women on the effectiveness in solving mathematics tests. They found that when women were told that there was a difference in performance between gender (without specifying which one), their results decreased. Thus it is very likely that by asking women to assess the dangerousness of men and women of their age, they responded by internalizing the stereotype.
In this study, young people recognize the difficulty of multi-tasking and admit that the "stop at a red light" situation is more conducive to transgressions; however, their declared behavior also demonstrates that they are suspicious of the risk of punishment and that it makes them forget the basic principles of driving prevention. They are aware of the risks, but this knowledge does not lead to an awareness of the risks associated with using the telephone while driving, while the risk of accidents is multiplied by four [19]. In addition, the more young people have experience and the less their thoughts and behaviors go together to value the non-use of the phone while driving. In other words, the gap between social rules and legal rules [30] increases when they gain experience probably because they develop a self-confidence that conduces to a risk-desensitization-phenomenon. This study has limitations related in particular to the population and the method but it has the merit of providing knowledge about the habits of use of the mobile phone in driving situation. Currently this information is not accessible because it is difficult to know how young drivers behave with the phone while driving unless you put an onboard camera in each vehicle. The figures for the use of the phone while driving reported in the statistics are approximate and we think they are below reality. “The authors declare that they have no conflict of interest”. References World Health Organization. (2009). Rapport de situation sur la sécurité routière dans le monde : il est temps d'agir. from www.who.int/violence_injury_prevention/road_safety_status/2009 . World Health Organization. (2015). Renforcer la législation sur la sécurité routière : guide pratique pour les ateliers. from www.who.int/violence_injury_prevention/road_safety_status/2015 . Observatoire National Interministériel de la Sécurité routière (ONISR) (2017). Bilan de l'année 2016. Paris. Parasuraman, S., Sam, A. T., Yee, S. W. K., Chuon, B. L. C., & Ren, L. Y. (2017). Smartphone usage and increased risk of mobile phone addiction : A concurrent study. International journal of pharmaceutical investigation, 7(3), 125. Lopez-Fernandez, O., Kuss, D. J., Romo, L., Morvan, Y., Kern, L., Graziani, P., ... & Schimmenti, A. (2017). Self-reported dependence on mobile phones in young adults: A European cross-cultural empirical survey. Journal of behavioral addictions, 6(2), 168-177. Chen, L., Yan, Z., Tang, W., Yang, F., Xie, X., & He, J. (2016). Mobile phone addiction levels and negative emotions among Chinese young adults: The mediating role of interpersonal problems. Computers in Human Behavior, 55, 856-866. Walsh, S. P., White, K. M., & Young, R. M. (2008). Over-connected? A qualitative exploration of the relationship between Australian youth and their mobile phones. Journal of adolescence, 31(1), 77-92. Alonso, F., Esteban, C., Calatayud, C., Montoro, L., & Alamar, B. (2004). Los jóvenes y el tráfico. Circunstancias culturales, sociales y psicológicas. Cuadernos de reflexión Attitudes. Madrid, Attitudes. Astrain, I., Bernaus, J., Claverol, J., Escobar, A., & Godoy, P. (2003). Prevalencia del uso de teléfonos móviles durante la conducción de vehículos. Gaceta sanitaria, 17(1), 66-69.
Muñoz-Miralles, R., Ortega-González, R., López-Morón, M. R., Batalla-Martínez, C., Manresa, J. M., Montellà-Jordana, N., ... & Torán-Monserrat, P. (2016). The problematic use of Information and Communication Technologies (ICT) in adolescents by the cross sectional JOITIC study. BMC pediatrics, 16(1), 140. Martinotti, G., Villella, C., Di Thiene, D., Di Nicola, M., Bria, P., Conte, G., ... & La Torre, G. (2011). Problematic mobile phone use in adolescence: A cross-sectional study. Journal of Public Health, 19(6), 545-551. Arnett, J. J. (2000). Emerging adulthood: A theory of development from the late teens through the twenties. American psychologist, 55(5), 469. Nelson, L. J., & Padilla-Walker, L. M. (2013). Flourishing and floundering in emerging adult college students. Emerging Adulthood, 1(1), 67-78. Gaymard, S., Besson, T., Bessin, M., Rouzier, A., Carré, J., Robert, V., Delaunay, S. & Maillet, A. (soumis). L’utilisation du téléphone au volant chez les commerciaux : habitudes de conduite et prises de risque. Pennay, D. (2006). Community attitudes to road safety: Community attitudes survey wave18, (no. Cr 227). Canberra : ATSB Gauld, C., Lewis, I., Haque, M., & Washington, S. (2015) Impact of mobile phone use on speed selection by young drivers: A driving simulator study. Journal of the Australian College of Road Safety, 26(1), 40-46. Strayer, D.L., Cooper, J.M., & Drews, F.A. (2004) What do drivers fail to see when conversing on a cell phone? In the Proceedings of the 48nd Annual Meeting of the Human Factors and Ergonomics Society, 2213–2217. Strayer, D.L., Watson, J.M., & Drews, F (2011). Cognitive Distraction While Multitasking in the Automobile. Psychology of Learning and Motivation - Advances in Research and Theory, 54. doi:10.1016/B978-0-12-385527- 5.00002-4. Redelmeier, D. A., Tibshirani, R. J. (1997). Association between cellular-telephone calls and motor vehicle collisions. New England Journal of Medicine, 336(7), 453-458. Briggs, G. F., Hole, G.J., & Land, M.F. (2011). Emotionally involving telephone conversations lead to driver error and visual tunnelling. Transportation Research Part F: Traffic Psychology and Behaviour, 14, 313–323. Langham, M., Hole, G., Edwards, J., & O’Neil, C. (2002). An analysis of ’looked but failed to see’ accidents involving parked police cars. Ergonomics, 45, 167–185. Mack, A., & Rock, I. (1998). Inattentional Blindness. Cambridge, MA, US: The MIT Press. Recarte, M. A., & Nunes, L. (2002). Mental load and loss of control over speed in real driving: Towards a theory of attentional speed control. Transportation Research Part F: Traffic Psychology and Behaviour, 5(2), 111-122. http://dx.doi.org/10.1016/S1369-8478(02)00010-4 Irwin, J. D., Chekaluk, E., & Geaghan, L. (2011). Gender Effects in Mobile Phone Distraction From Driving. In D. Hennessy (Ed.), Traffic Psychology: An International Perspective (pp. 113–128). New York, NY: Nova Science Publishers, Inc. Frippiat, D., & Marquis, N. (2010). Les enquêtes par Internet en sciences sociales: un état des lieux. Population, 65(2), 309-338. Gaymard, S., & Tiplica, T. (2018). Workshop « Sécurité routière : recherche en psychologie sociale ». Maison de la recherche Germaine Tillion : Université d’Angers. Biecheler-Fretel, M.B., & Moget, M. (1989). Le comportement de base de l’automobiliste : un critère intermédiaire de prédictibilité du risque d’infraction et d’accident. Recherche Transports Sécurité, 24, 35-44. Gaymard, S. (2014). The theory of conditionality: an illustration of the place of norms in the field of social thinking. Journal for the Theory of Social Behaviour, 44(2), 229-247. doi: 10.1111/jtsb.12039 Gaymard, S., & Tiplica, T. (2016). Leisure, risk awareness and personality factors among female students. Journal of Public Health/Zeitschrift für Gesundheitswissenschaften, 24(6), pp. 521-534. doi: 10.1007/s10389-016-0752-5 Gaymard, S. (2007). La représentation de la conduite chez des jeunes conducteurs: Une étude de la conditionnalité routière. Recherche Transports Sécurité,97, 339-359. doi:10.3166/rts.97.339-359 Hanna, C. L., Taylor, D. M., Sheppard, M.A., & Laflamme, L. (2006). Fatal crashes involving young unlicensed drivers in the US. Journal of safety research, 37(4), 385-393. Özkan, T., & Lajunen, T. (2005). Why are there sex differences in risky driving? the relationship between sex and gender-role on aggressive driving, traffic offences, and accident involvement among young turkish drivers. Aggressive Behavior, 31(6), 547–558. http://doi.org/10.1002/ab.20062
Copyright © Society for Science and Education, United Kingdom 125 Waylen, A. & McKenna, F. (2002). Cradle Attitudes – Grave Consequences. The development of gender differences in risky attitudes and behaviour in road use. UK, Basingstoke: AA Foundation for Road Safety Yagil, D (1998) Gender and age-related differences in attitudes toward traffic laws and traffic violations. Transportation Research, Part F: Traffic Psychology and Behaviour, 1,123-135. Gaymard, S. (2009). Norms in social representations: two studies with french young drivers. The European Journal of Psychology Applied to Legal Context, 1(2), 165-181. Gaymard, S., & Bessin, M. (2017). La influencia de modelos normativos en la muestra social del ciclomotor entre los jóvenes adolescentes: un estudio piloto/The influence of normative models in the social representation of the moped among young teenage boys: A pilot study. Securitas Vialis. doi: 10.1007/s12615-016-9082-1 Gaymard, S., Boucher, V., Nzobounsana, V., Greffier, F., & Fournela, F. (2013). La perception des piétons par les conducteurs : corrélations entre les données d’un œil électronique et le verbatim des conducteurs/ Drivers’ perception of pedestrians : correlations between the data of an electronic eye and drivers’ verbatim. Canadian Journal of Behavioural Science/Revue canadienne des sciences du comportement, 45(2), 124-137. doi : 10.1037/a0025789 Lippmann, W. (1922). Public opinion. New-York: Harcourt, Brace Gaymard, S. (2006). The representation of old people: comparison between the professionals and students. International Review of Social Psychology, N°3-4, 69-91. Gaymard, S. (2017). Les seniors sur la route. Communication orale dans le cadre de la rencontre « Seniors, gardez les bons réflexes ». Ville d’Angers et CCAS. Joanisse, M., Gagnon, S., & Voloaca, M. (2012). Overly cautious and dangerous: An empirical evidence of the older driver stereotypes. Accident Analysis & Prevention, 45, 802-810. Adler, G., & Rottunda, S. J. (2010). Mandatory testing of drivers on the basis of age and degenerative diseases: Stakeholder opinions. Journal of Aging and Social Policy, 22, 304–319. doi:10.1080/08959420.2010.485530 Berger ML. (1986). Women drivers! The emergence of folklore and stereotypic opinions concerning feminine automotive behavior. Women’s Studies International Forum, 9, 257–263. doi: 10.1016/0277-5395(86)90061-0 Walsh M. (2007). Gender in the history of transportation services: An historiographical perspective. Business History Review, 81(3), 545–562. Pereira M., Bruyas M.P., Simões A., (2010). Are elderly drivers more at risk when interacting with more than one in-vehicle system simultaneously? Le Travail Humain, 73(1), 53-73. Hamama, H. (2010). Impact des situations d’attention partagée sur le traitement de l’information chez les conducteurs novices. Thèse de doctorat. Université de Lyon 2. Baldock M.R.J., Mathias J. L., McLeanb A.J., Berndt A. (2006). Self-regulation of driving and its relationship to driving ability among older adults. Accident Analysis and Prevention, 38, 1038-1045. Gaymard, S., Allain, P., Osiurak, F. & Le Gall, D. (2011). The conditions of respect of rules in young and elderly drivers : An exploratory study. The European Journal of Psychology Applied to Legal Context, 3(1), 11-28. Steele, C.M., & Aronson, J. (1995). Stereotype Threat and the Intellectual Test Performance of African Americans. Journal of Personality and Social Psychology, 69(5), 797-811. Spencer, S.J., Steele, C.M., & Quinn, D. (1999). Under suspicion of inability : Stereotype threat and women’s math performance. Journal of Experimental Social Psychology, 35, 4-28.