Effects of limestone fillers on surface free energy and
electrical conductivity of the interstitial solution of
cement mixes
Luc COURARD*, Frédéric MICHEL*, Sylwia PERKOWICZ** and Andrzej GARBACZ**
*University of Liege, ArGEnCo Department, GeMMe Building Materials, Belgium
**Warsaw University of Technology, Department of Building Materials Engineering, Poland
Abstract
Most of concrete formulations actually contain mineral additives that are used as an inert filler or supplementary cementitious material (as type II addition). These materials are generally used in order to increase concrete performances both in its fresh and hardened states. The mineral additives usually improve the consistency and workability of fresh concrete and reduce the water demand for a required concrete slump because of an additional volume of fines. The way of action depends on the physical and chemical characteristics of fillers. The study of surface free energies and electric conductivities of interstitial solutions of cement mixes modified by blast furnace slags and limestone fillers contributes to a better knowledge of hardening and interaction process.
Keywords: concrete, limestone fillers, blast furnace slags, electrical conductivity, surface free energy, dormant period
1. Introduction
Mineral filler can be defined as “inert material that is included in a composition for some useful purpose” [1]. It can be added to compounds to fulfil a large variety of final results or to improve specific properties like: hardness, brittleness, impact strength, compressive strength, softening point, fire resistance, surface texture, electrical conductivity, … etc [2, 3]. These effects are the result of the properties of the fillers, including chemical activity, hardness, particle size, shape and distribution, surface structure, colour, density [4, 5]. They may also be included in compounds to reduce the cost of the product.
Many types of fillers are largely used in concrete industry [6]. Specifically, the two essential properties of fresh Self-Compacting Concrete, i.e high fluidity and low segregation, can be achieved by using large amount of superplasticizer and fine particles [7, 8]. These are notably used as cement replacement materials (cement additives). Among additives, limestone fillers seem well-adapted, specifically for Belgian market, because of their local availability [3]. As the behaviour of fresh and hardened concrete depends on the intrinsic properties of fines [9, 10], the use of these by-products requires a thorough characterization. They usually differ from each other through their physical characteristics (Blaine fineness, particle size
distribution, water requirement) but also chemical and mineralogical characteristics (presence of impurities such as clay, quartz and dolomite) [3, 4].
The objective of this research is to analyse the potential effect of limestone fillers on the surface free energy and electrical conductivity of interstitial solutions of Portland and Blast Furnace Slag cement-based slurries. These properties are indeed very often used for monitoring the early stage of hardening of various types of cement binders (eg. [11,12]). As soon as cement and water are mixed, physico-chemical interactions appears for ion transfers, components dissolution and products crystallization: they finally induce strength development [13].
The surface free energies and their components between two interacting surfaces are extremely important since not only do they dictate the strength of interaction, but also control processes like the stability of aqueous colloidal suspensions, wetting, spreading and adhesion [14, 15]. The interactions solid-liquid are mainly controlled by the interfacial surface tensions between the two phases. The characterization of the surface properties and especially the surface free energy components of the solid are, therefore, recognized as the key to understanding the mechanism of surface-based phenomena [16]. This information provides essential insight into the mechanism of such interactions as the stability of colloidal suspensions, molecular self-assembly, wetting, spreading, bubble-particle, particle-particle interaction in the industrial applications [15, 16]. Moreover, electrical interactions, basically responsible for dissolution and combination of chemical species, maybe followed by means of electrical conductivity measurement: ion transfers will indeed induce modification of electrical resistivity of the solution. That’s the reason why this technique is suitable for the observation of hydration process in the early stage.
Consequently, the techniques used in this work to analyse these solutions are based on the surface free energy and the conductivity of the liquid phases, respectively. The measurements are realized on centrifuged solutions, without solid particles in suspension [17].
2. Experimental program
2.1. Materials
Slurries were considered as experimental materials because we intended to analyse the behaviour of the interstitial solution. Electrical conductivity may be different for concretes or mortars as inert materials can be considered as “insulating” materials [18].
The Portland cement of CEM I 42.5 R HES type was used. Blast furnace slag cement was re-composed with 65 % (by mass) of Portland cement (P) and 35 % of blast furnace slag (BFS). The limestone fillers can be classified in two groups: natural and synthetic mineral-derived fillers. The first group includes ground calcium carbonate and the second group precipitated calcium carbonate. In this work ground calcium carbonates as additives to cement slurry were tested. Characteristics of limestone filler include physical properties such as hardness, natural particle size and shape but also chemical composition, chemical reactivity. Characteristic of four different commercial fillers and two binders used for investigations are presented in Table 1 and Table 2 respectively.
Table 1. Characteristics of limestone fillers
Physical characteristics
Specific Gravity [kg/m3] 2.7 2.7 2.7 2.7
Hardness, Mohs’ Scale 3 3 3 3
x50 [µm] 12.00 9.00 12.58 7.27 Chemical characterictics CaCO3 [%] 98.20 98.20 98.10 98.86 MgO [%] 0.40 0.40 0.35 0.26 SiO2 [%] 0.40 0.40 0.53 0.16 Fe2O3 [%] 0.15 0.15 0.08 0.05 Al2O3 [%] 0.20 0.20 0.17 0.05 Mn3O4 [%] 0.02 0.02 - -
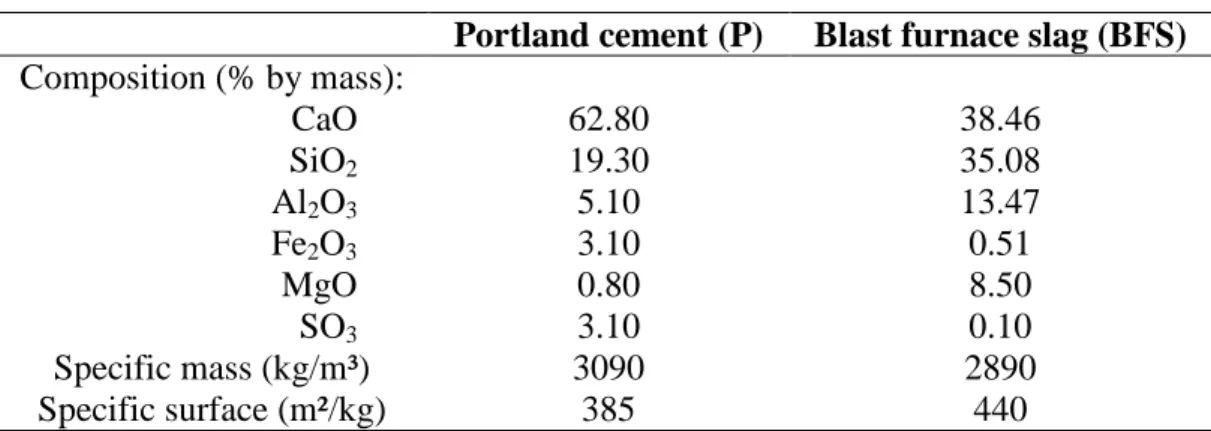
Table 2. Characteristics of cement (P) and blast furnace slag (BFS) binders
Portland cement (P) Blast furnace slag (BFS) Composition (% by mass): CaO 62.80 38.46 SiO2 19.30 35.08 Al2O3 5.10 13.47 Fe2O3 3.10 0.51 MgO 0.80 8.50 SO3 3.10 0.10 Specific mass (kg/m³) 3090 2890 Specific surface (m²/kg) 385 440
For all mixtures, the Water- to- Binder ratio (W/B) remained constant and equals to 0.45 (by mass). Replacement percentage of cement and BFS cement was fixed to 15% in mass. Table 3 presents the ten cement slurries that have been tested.
Table 3. Composition of the cement slurries
Cement Filler Mix Cement (%) BF Slags (%) Filler (%) Water (%) Portland (P) - P0 69 - - 31 F1 P/F1 58.50 - 10.50 31 F2 P/F2 58.50 - 10.50 31 F3 P/F3 58.50 - 10.50 31 F4 P/F4 58.50 - 10.50 31 Slags (BFS) - BFS0 44.85 24.15 - 31 F1 BFS/F1 38.15 20.50 10.35 31 F2 BFS/F2 38.15 20.50 10.35 31 F3 BFS/F3 38.15 20.50 10.35 31 F4 BFS/F4 38.15 20.50 10.35 31
Deionized water has been used to prepare the samples at constant temperature (25±1)°C. All the samples used for conductivity test were prepared in the same way:
• mix of cement, water (limestone filler and blast furnace slag) for 3 minutes at high speed;
• fulfilling of the conductivity cells with slurries; • registration of the temperature all along the test.
2.2 Measurement of surface free energy of liquids
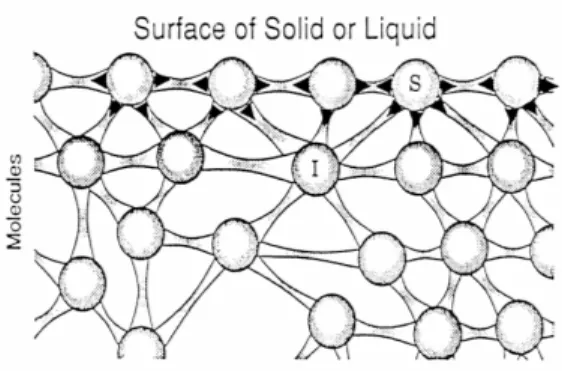
Surface free energy is the result of the attraction between molecules situated in the bulk material and in the surface layer [17, 19]. Molecules in the surface layer are not submitted to the same attraction forces than in bulk material (Fig.1).
Figure 1. The origin of interfacial energy.
Resultant force for the surface molecules is oriented to liquid and perpendicular to the surface. The force tends to reduce the number of molecules in the surface region and to obtain minimal “free surface of liquid”: this corresponds to the work necessary to surmount surface free energy (J/m2 or mN/m).
In this work, a tensiometer has been used for the tests. The tensiometer is based on the measurement of the weight necessary to pull out a platinum plate or ring from the analysed liquid. The measurement is realized in a temperature regulated system, with the container for the liquid, a moving system to put into contact the ring or the plate with the liquid and a balance which continuously registers the interfacial forces between the plate or the ring and the liquid.
V = lifted liquid volume
Figure 2. Cross section of the ring with liquid lamella.
The measurements with de Nouyï ring (Fig. 2) are done with horizontal hanging platinum ring of specific geometry; the ring is made of platinum-iridium due to good wetting properties, chemical resistance, temperature and high mechanical stability. The wetted length Lb is
determined by the radius of the ring. The platinum ring is dipped into the liquid and pulled out afterwards (Fig.2). Force acting on the ring is a function of the lamella-height. The maximum force appears when the contact angle between the surface of liquid and vertical is equal to zero. Surface energy can be determined according to Eq. (1):
θ ⋅ ⋅ = ⋅ σ = σ cos L F K F b max * (1) where:
σ − real surface free energy value (mN/m),
σ∗ − measured surface free energy value (mN/m), Kmax - maximum force (mN),
Lb - wetted circumference of the ring = 120mm,
θ - contact angle, F - correction factor.
A correction has however to be performed because the forces measured are always overestimated: when the ring is pulled above the level of the liquid surface, the measured force of the surface energy indeed includes the force that is created by the weight of the lifted liquid lamella (Fig.2). The correction factor can be determined according to Eq. (2):
(
D d)
Rr L F b 679 . 1 04534 . 0 4 01452 . 0 725 . 0 2 * − + − ⋅ ⋅ + =σ
(2) where:Lb - the wetted length of the ring (cm),
D - the density of heavy phase (g/cm³),
d - the density of light phase (air in our case, g/cm³). Results obtained with Ring method must take into account:
• high precision due to great wetted length;
• specific suitability for interfacial energy between two liquid phases; • possibility of deformations larger than plate;
• disturbance of surface area during measurement.
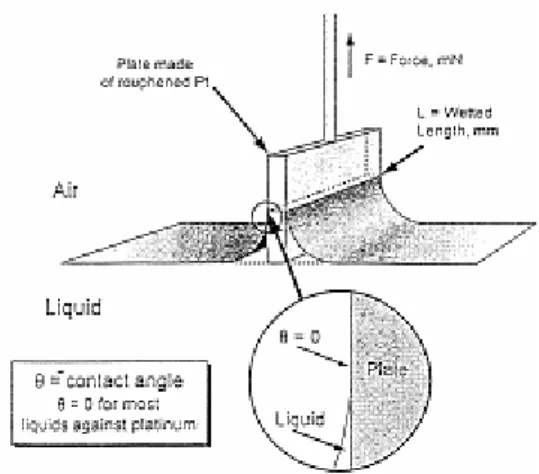
The plate method, also known as Wilhelmy plate method, is based on the measurement of the force necessary to pull out the plate of the liquid. The testing device is a vertically hanged platinum plate with exactly known geometry. The surface of the plate is roughened to improve its wettability. The lower edge of the plate is brought into contact with the liquid surface: the liquid jumps the plate and pulls it into it. The Wilhelmy force results from the wetting. It is measured by moving up the plate to the level of the liquid surface (Fig.3). The contact angle θ is the angle between the tangent at the wetting line and the surface plate (Fig.3). In this case, it is assumed that contact angle is equal to zero [9]. Surface free energy is calculated according to Eq. 3:
θ
σ
cos
⋅
=
w Wl
P
(3) where : σ − surface energy (mN/m),Pw - Wilhelmy force (mN),
lw - wetted length = 40mm.
Figure 3. Cross- section of the wetted plate
In the case of the plate method there is no hydrostatic correction because there is no disturbance of surface during measurement and it presents greater mechanical stability than ring as well. The plate method is suitable for measurement of surface free energy over time and for measurement of low concentration surfactants containing solutions. It allows higher range of measurement but less precision due to plate geometry.
2.3. Evaluation of electrical conductivity and resistivity
The conductivity of solutions is measured by applying a voltage between two electrodes in a conductivity cell [4]. At any time, anions are migrating to the positive electrode and cations to the negative one. The conductivity of solutions (mS/cm) is the conductance which would be measured in a standard cell containing two ring electrodes held 3 cm form each other. The conductivity of a dilute solution is the sum of the individual contributions to conductivity of all the ions multiplied by their concentration, as conductivity is indeed directly proportional to concentration: this is the so called Kohlraush’s law of independent migration [20]. The statement is that each ion contributes to the total conductivity without being affected by any other ion in solution (Eq. 4):
1000
∑
⋅ = ° i i cλ
κ
(4)where κ is the measured conductivity (mS/cm), ci is the concentration of the ions
(equivalents/l) and λ°i is the ionic limiting equivalent conductivity (Table 4), which is specific
for each ion. The Conductivity Meter CDM 210 we used is able to measure initial and maximal conductivity values and duration of the dormant period.
Table 4. Values of λ°i for some inorganic ions [
. equiv cm S⋅ 2 ]. Anions λλλλ°i Cations λλλλ°i OH- 198 H+ 350 Cl- 76 Na+ 50
SO42- 80 K+ 74
Ca2+ 60
3. Results and discussion
3.1. Surface energy
The liquid phase used for liquid surface free energies determination was obtained according to the following procedure [5]:
• mixing of water and cement (limestone fillers and blast furnace slags) for 3 minutes and dividing in 4 parts to fulfil containers of the centrifugation device;
• centrifuging for 20 minutes at 4000 rounds per min;
• collecting the centrifuged solutions (+/- 100 ml) into containers after filtration with Wathman paper nr. 41 (retention of 20-25 µm particles).
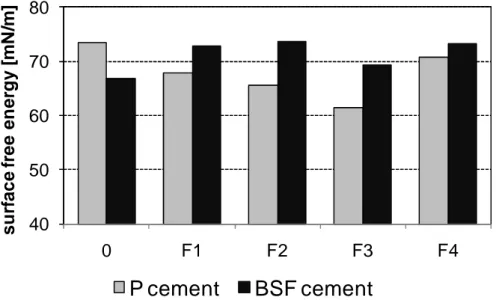
All samples were tested just after filtration. Tests are realized in thermal regulated conditions at the temperature of (24±1)°C. The results indicate that the four Portland centrifuged solutions (P/F1, P/F2, P/F3 and P/F4) give lower surface free energy values than BFS mixes (Fig.4). Only the “pure” solution BFS0 gives lower value of surface free energy than correspondent solution with Portland cement (P0).
40 50 60 70 80 0 F1 F2 F3 F4 s u rf a c e f re e e n e rg y [ m N /m ]
P cement
BSF cement
Figure 4. Comparison of surface free energy of slurries
The surface free energy analysis shows different behaviours between two compositions of Portland and BFS-based cement slurries in initial time. The results obtained on the Portland-based mixes are regularly lower than for BFS samples. Moreover, surface free energy was measured on two selected samples P0 and BFS0 in order to observe possible evolution of surface free energy with time. Figure 5 presents the surface free energy evolution of P0 and BFS0 mixes; the test has been performed during three weeks after preparation. Tests were realized in thermal regulated conditions at the temperature of (24±1)°C. The initial value of surface free energy - σ0 = 73.5 mN/m - is the highest; next surface free energies are
decreasing. After 5 days, the surface free energy of P0 tends to a constant value around σ≈70 mN/m, which corresponds to the surface free energy of water. For BFS0 mix, the initial value of surface energy σ0 = 66.98 mN/m was the lowest; it increased afterwards up to a constant
value of 72 mN/m after only 4 days. This investigation shows that surface free energy of mixes tends to surface free energy of water in a very short time.
60 65 70 75 80 0 5 10 15 20 25 30 s u rf a c e f re e e n e rg y [ m N /m ]
time [days]
P0 BSF0Figure 5. Evolution of surface energy versus time (P0 and BSF0 mixes)
Comparison of the two methods (Fig. 6) for surface free energy measurement shows quite good correlation, especially in the case of filler modified slurries. It means that each one may be used indifferently. 60 62 64 66 68 70 72 74 76 78 64 66 68 70 72 74 76
σσσσ
p la te [m N /m ]σ
σσ
σ
ring[mN/m] P0 P/F3 BFS0 BFS/F3 BFS/F2 P0 P/F3 BFS0 BFS/F3 BFS/F2 P0 P/F3 BFS0 BFS/F3 BFS/F2σ
σσ
σ
plate =σσ
σ
σ
ringFigure 6. Correlation between value of surface free energy of liquids measured with Ring method (σring) and Wilhelmy plate method (σplate)
3.3. Conductivity
Because it is dependent on the ions dissolved in the solution, the measurement of electric conductivity evolution with time can give information about the hydration process. The “dormant” period is representative of the setting time: at the end of this period, the setting really begins.
The initial conductivity is measured during 8 minutes after the contact between water and cement at the temperature of 25±1°C. Maximal conductivity and beginning of the “dormant” period were also registered.
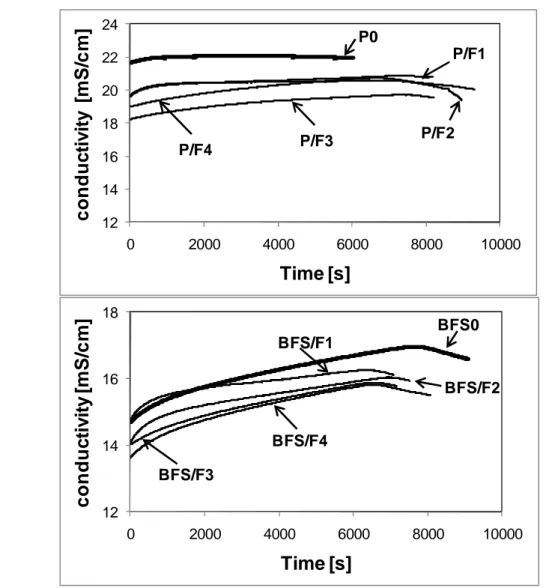
a) 12 14 16 18 20 22 24 0 2000 4000 6000 8000 10000 c o n d u c ti v it y [ m S /c m ] Time [s] P0 P/F1 P/F2 P/F4 P/F3 b) 12 14 16 18 0 2000 4000 6000 8000 10000 c o n d u c ti v it y [ m S /c m ]
Time [s]
BFS0 BFS/F1 BFS/F2 BFS/F4 BFS/F3Figure 7. Conductivity of Portland cement slurries (a) and BFS cement-based slurries (b) modified by limestone fillers
Some specific behaviour may be pointed out with regard to the conductivity of Portland cement and BSF modified slurries (Fig. 7a and b):
• initial dissolution of clinker components and gypsum is high. The slope at the beginning (0-1000s) is high and the ions passing into solution instantaneously increase the conductivity;
• in the case of Portland cement based mixes, the lowest value of conductivity - 18.7 mS/cm is obtained for P/F3, while the highest - 22.1-mS/cm - is obtained with P0. This value is not corresponding to the initial value but the maximum value observed on the curve: it represents the initial time of the so-called “dormant period”. One of the reasons of the lower value obtained for mixes with limestone is maybe related to the lower water-to-cement ratio: P0 is supersaturated with ions and reaches the maximum resistivity after one hour;
• in the case of BFS modified slurries, the conductivity is close to each other and lower in comparison to all the Portland cement-based mixes. The maximum conductivity - 16.96-mS/cm is observed for BFS0 and the lowest value of conductivity - 15.8-mS/cm - is obtained for BFS/F3 and BFS/F4;
The initial time of the dormant period significantly increases when limestone filler is added to the mix with Portland cement (Fig. 8). Moreover, the initial time of BFS0 dormant period is
more than two times higher than P0, which confirms the lower activity of slags. More interesting is the effect of fillers in BFS cement-based mixes: they induce a slight decrease of the initial time dormant period, which could be attributed to the formation of carboaluminates that accelerate the setting [2, 21] but also the so-called “nucleation effect” of the small limestone particles. This effect may contribute to the increase of the speed of hydration process. The type of limestone filler does not seem to have any discriminant effect.
0 3000 6000 9000 0 F1 F2 F3 F4
d
o
rm
a
n
t
p
e
ri
o
d
[
s
]
P cement
BFS cement
Figure 8. Comparison of the initial time of the dormant period for Portland (P) and blast furnace slag (BFS)-based cement slurries.
These results do not contredict previous observations where it is concluded that the reaction mechanism of the Portland cement is clearly influenced by the addition of the limestone filler: the setting time is reduced [22]. These phenomena are not found when a quartzite type filler is used in the mixes [23]. In this case, that’s the initial time of the dormant period that has been measured.
4. Conclusions
The following conclusions may be reached from the investigations:
• the results obtained confirmed usefulness of surface free energy and conductivity for monitoring of early stage of cement hydration at presence of various mineral additives and/or fillers
• the results of surface energy measured with plate method are very similar to the results with the ring method, particularly in the case of filler modified solutions;
• the results showed that the surface energy is always higher for blast furnace slag cement-based solutions than for Portland cement; the time induces an increase of the surface energy for BFS solutions while a decrease for Portland cement-based mixes; • the mixes with filler F1 gave the higher values of conductivity for Portland and BFS
cement. Mixes with filler F3 gave the lower values of conductivity in Portland and BFS cement. The induction of the dormant period of pure cement mix is more than two times higher for blast furnace slag cement mix, which confirms the lower activity of blast furnace slag cement;
• the initial time of the dormant period significantly increases when limestone filler is added to Portland mixes. It confirms the effect of limestone fillers on the hydration
process and the delay that can occur before attending dormant period. Positive effect of limestone fillers ill in this case happen during this dormant period;
• the fillers added to BFS mixes also induce a slight decrease of the dormant period, which could be attributed to the so-called “nucleation effect” of the small limestone particles, that could contribute to the increase of the hydration process.
Limestone fillers seem to be more effective in the case of BFS mixes in the very early time, i.e. before the dormant period. Literature usually indicates a positive effect of limestone fillers in reducing setting time for Portland cement mixes: the present research clearly show that this effect is not observed in the first minutes following mixing of products.
These conclusions are of course available for test conditions described here above and for the materials that have been tested. Other types of fillers (mineral and chemical compositions) could induce other types of behaviours and effects on the hydration process. Conductivity test however already gives clear indications on the effect of additives on the hydration process and the initial time of the dormant period. Moreover, surface free energy of the interstitial solutions gives us also the information of a more positive effect of the limestone fillers on electro-chemical activity of ions in the case of BFS mixes.
5. References
1. Severinghaus, N. (1983) Fillers, filters and Absorbents in Industrial Minerals and Rocks. 5th edition (ed. S.J. Lefond. American Institute of Mining, Metallurgical and Petroleum Engineers, Inc., New York): 243-257.
2. Courard, L., Degeimbre, R., Darimont, A., Michel, F., Willem, X. and Flamant, St. (2005). Some effects of limestone fillers as a partial substitute for cement in mortar composition. ConMat’05 Third International Conference on construction materials:
performance, innovations and structural implications (ed. N. Banthia). Vancouver,
Canada, (August 22-24, 2005), Theme 3-Chapter 5, 10p.
3. Meerseman, J., Descamps, P., Lucion, C., Piérard, J. and Pollet, V. (2006) Characterization of limestone fillers from Wallonia for using in concrete technology.
Ciments, Bétons, Plâtres, Chaux (CBPC) (882), 29-36 (in French).
4. Michel F. Physical characterization of limestone fillers. Master Thesis 2006. Faculté des Sciences Appliquées, Université de liège, Belgium: 204p (in French).
5. Michel, F., Pirard, E. and Courard, L. Particle size distribution of limestone fillers: granulometry and morphometry investigations. Particulate Science and Technology (sent
for publication).
6. Piérard J., Courard L. and Michel F. Durabilité des bétons additionnés de fillers calcaires. Journées scientifiques du Regroupement Francophone pour la Recherche et la Formation dans le domaine du béton, Lausanne, Suisse (28-29 septembre 2008), 10p. (in French). 7. Okamura, H., Maekawa, K. and Ozawa, K., ‘High performance concrete’, 1st ed., 1993,
323pp.
8. Baron, J. and Ollivier, J.-P. (1997) Les bétons : bases et données pour leur formulation. (ed. Eyrolles, Paris), 522pp. (in French).
9. Gallias, J.L., Kara-Ali, R. and Bigas, J.P. (2000) The effect of fine mineral admixtures on water requirement of cement pastes. Cement and Concrete Research, 30: 1543-1549. 10.Topcu, I. B. and Ugurlu, A. (2003) Effect of use of mineral filler on the properties of
concrete. Cement and Concrete Research, 33: 1071-1075.
11.Heikal, M., Aiad, I. and Helmy, I.M. (2002) Portland cement clinker, granulated slag and by-pass cement dust composites, Cement and Concrete Research, 32 (11): 1805-1812.
12.Haque M. N., Cook D. J., Morgan D. R., The influence of admixtures on the surface energy of Portland cement paste. Materials and structures, 9 (4), 1976: 291-296
13.Bishnoi, S. and Scrivener, K. Optimised continuum cement hydration modelling. 2nd
International Symposium on Advances in Concrete through Science and Engineering (ed. J. Marchand, B. Bissonnette, R. Gagné, M. Jolin, F. Paradis). Québec, Canada,
(September 11-13, 2006), 63-74.
14.Courard, L., Michel F. and Martin M. (2011) The evaluation of the surface free energy of liquids and solids in concrete technology. Construction Building Materials, 25(1): 260-266.
15.Comyn, J. (1992) Contact angles and adhesive bonding, International Journal of Adhesion
and Adhesives,12(3): 145-149.
16.Possart, W. and Kamusewitz, H. (1993).The thermodynamics and wetting of real surfaces and their relationship to adhesion, International Journal of Adhesion and Adhesives, 13(2): 77-84.
17.Courard, L. (2002) Evaluation of thermodynamic properties of concrete substrates and cement slurries modified with admixtures. Mater. Struct., 35, 149-155.
18.Tumidalski, P.J. (1996) Electrical conductivity of cement mortars. Cement and Concrete
Research, 26 (4): 529-534.
19.Kinloch A.J., "Adhesion and Adhesives: science and technology" (Chapman and Hall, London, 1987).
20.Maximilien, S., Péra, J. and Chabannet, M. (1997) Study of the reactivity of clinkers by means of the conductometric test. Cement and Concrete Research, 27(1): 63-73.
21.Bonavetti, V.L., Rahhal, V.F. and Irassar, E.F. (2001) Studies on carboaluminate formation in limestone filler-blended cements. Cement and Concrete Research, 31: 853-859.
22.Heirman, G., Vandewalle, L. and Van Gemert, D. Influence of mineral additions and chemical admixtures on setting and volumetric autogenous shrinkage of SCC-equivalent mortars. 5th International RILEM Symposium on Self Compacting Concrete (ed. G. De Schutter and V. Boël) Gent, Belgium (September 3-5, 2007), 553-558.
23.Poppe, A.M. and De Schutter, G. (2005) Cement hydration in the presence of high filler contents. Cement and Concrete Research 35: 2290 – 2299.
Acknowledgments
This research was financially supported by the cooperation project (2005-2007) “Development
and use of self-compacting mortars for the repair of concrete infrastructures” between the Government
of Poland and the Regional Government of Wallonia (Wallonia-Brussels International), Belgium.