HAL Id: hal-00807200
https://hal.archives-ouvertes.fr/hal-00807200
Submitted on 3 Apr 2013
HAL is a multi-disciplinary open access
archive for the deposit and dissemination of
sci-entific research documents, whether they are
pub-lished or not. The documents may come from
teaching and research institutions in France or
abroad, or from public or private research centers.
L’archive ouverte pluridisciplinaire HAL, est
destinée au dépôt et à la diffusion de documents
scientifiques de niveau recherche, publiés ou non,
émanant des établissements d’enseignement et de
recherche français ou étrangers, des laboratoires
publics ou privés.
Smart Functions
Matthieu Denoual, Gilles Allègre, Patrick Attia, Olivier de Sagazan
To cite this version:
Matthieu Denoual, Gilles Allègre, Patrick Attia, Olivier de Sagazan. Smart Bolometer: Toward
Monolithic Bolometer with Smart Functions. Perera, A.G Unil. Bolometers, Intech Publisher,
pp.171-196, 2012. �hal-00807200�
Smart Bolometer: Toward Monolithic
Bolometer with Smart Functions
Matthieu Denoual
1, Olivier de Sagazan
2, Patrick Attia
3and Gilles Allègre
11
University of Caen Basse-Normandie, GREYC-ENSICAEN
2University of Rennes, IETR
3NXP-semicoductors Caen
France
1. Introduction
The content of this chapter refers to uncooled resistive bolometers and the challenge that consists in their integration into monolithic devices exhibiting smart functions. Uncooled resistive bolometers are the essential constitutive element of the majority of existing uncooled infrared imaging systems; they are referred to as microbolometer pixels in that type of application where matrixes of such elementary devices are used. Uncooled bolometers represent more than 95% of the market of infrared imaging systems in 2010 (Yole, 2010) and infrared imaging systems are required for more and more applications. Mature industrial applications of uncooled IR imaging are non-destructive test and process control in production lines. Booming applications of uncooled IR imaging are in two main fields: security and environment. Application to security involves the conveyance security controls on one side and on the other side the emerging market of automotive security systems. In that case, infrared imaging is applied to the detection of pedestrians, animals or black ice on roads. At the present time, the high cost of IR imaging equipments prevents their broad distribution and restricts their market to luxury cars. The huge and dynamic market of automotive industry promises cost reduction in the next years. Besides, strengthening of safety norms such as Euro-NCAP in Europe will someday turn pedestrian detection systems into standard equipments. Environment is the second booming application field. It is driven by the environmental and ecological concern to track heat leaks in buildings and to allow for thermal budgeting of buildings. Driven by thermal regulation laws that limit the maximum power consumption of buildings, such as the RT 2012 in France, standard applicable from 2013, this field is to grow substantially in the coming years. According to recent market research, the volume of sale of uncooled infrared imaging system is to triple by 2015 (Yole, 2010) that is to say a 23% annual growth rate.
Such markets drive the research and development of uncooled infrared systems. Two main ways of development are investigated: (1) improvement of the bolometer pixel through appropriate choice of material and structure design, (2) optimization of the readout electronics. Amorphous silicon and other silicon based materials begin to challenge the historically dominant vanadium oxide (VOx) because their manufacturing is easier and cheaper. On the other hand, new packaging and microfabrication solutions such as through
silicon via are considered for further integration and cost reduction. Concerning the second point, now, most of the readout electronics has been moved onto the chip where it is referred to as the readout integrated circuit (ROIC). The ROIC incorporates parallel column circuitry, consisting of amplifiers, integrators and sample-and-hold circuits with a column multiplexer which provides a single channel output. Most of the approaches today employ CMOS silicon circuitry for which the power dissipation is much lower than that of bipolar. Research works are still going on to improve this electronics, mainly for noise considerations (Chen et al., 2006; Lee, 2010; Lv et al., 2010). However, that electronics only enables the readout of the measured signal and cannot be directly derived to implement smart functions or operate the bolometer with feedback.
Independently from material or readout electronics, we address here another type of feature for uncooled bolometers that is the implementation of smart functions so as to derive basic uncooled resistive bolometers into smart bolometers. The smart qualification is not only a matter of readout circuit integration since it implies additional features compared to a bolometer pixel associated to conventional ROIC.
This chapter deals with smart bolometers according to the IEEE 1451.2 definition of smart sensors which states that smart sensors are sensors that provide functions beyond those necessary for generating a correct representation of a sensed or controlled quantity. Test, identification and configurability are some examples of functions beyond conventional use, also called smart functions. Such smart functions contribute to an easier use of sensors and allow the sensors to take into account parameters discrepancies or evolutions. For instance, identification can be used to compensate for discrepancies between bolometers due to the process variations during the technological fabrication. Identification can, as well, allow the sensors to adjust to aging effects during their operating life. Combined with the configurability, the identification function makes possible to satisfy a large number of applications. The configurability takes advantage of the operation in a closed-loop mode to overcome the traditional trade-off between time constant and responsivity (Rice, 2000) and allows some flexibility in the choice of these characteristics.
The smart bolometers considered here consist in uncooled resistive bolometers associated to an electrical substitution means that enables the implementation of smart functions. The electrical substitution configuration chosen is the capacitively coupled electrical substitution (CCES) (Denoual et al., 2009a, 2009b). The demonstration of the closed-loop operation of resistive bolometers with this configuration has been performed with digital electronics implementation (Denoual et al, 2010). The introduction of digital electronics and control for feedback leads to new performance because of system linearization; in addition, it simplifies the implementation of smart functions. This configuration has the potential to allow for a fully integrated smart sensor, i.e. a monolithic smart bolometer. Such integrated smart bolometer is the ultimate goal of the work presented in this chapter and illustrated in Fig. 1 and Fig. 2. But before taking this rather large next step, it is important to understand the configurations that are available, and their ability to provide a higher level of intelligence and value to resistive bolometers.
For this purpose, prior to integration, high-level or top simulations are investigated as well as experimental prototyping with microcontroller units. One role of the top-simulation and modeling is to provide the designer with potential performance regarding various control algorithm strategies based on current or coming resistive bolometer technologies. Top
simulations are desirable to validate the algorithms that implement the smart functions. Preferably, the validation of the algorithms should be performed in their operating context. These considerations guide the designer toward standard VHDL modeling technique as a solution. Such modeling technique exhibits indeed true interests including very fast simulation without convergence issues and the validation of algorithms in their operating context (Schubert, 1999; Staszewski et al, 2005). It is noticeable that this modeling technique is applied here to a multi-domain system involving optical, thermal and electrical signals.
Fig. 1. General functional block diagram of a smart bolometer. Smart functions require a built-in stimulus generation. The feedback control and feedback path are optional and allow closed-loop operation of the bolometer.
Fig. 2. Integrated smart bolometer pixels. Line of monolithic smart bolometer pixels. Part of the conditioning and feedback electronics is integrated below the bolometer pixel.
Macroscale experiments with discrete components complete the knowledge acquired through the top-simulations. Those experiments involve resistive bolometer prototypes with capacitively coupled electrical substitution feedback means associated to microcontrollers that implements the smart functions for proof-of-concept demonstration. That is the current phase of development and one of the necessary steps to the next level: the monolithic smart bolometer.
This chapter is organized as follows:
After this introduction, the second section describes the smart functions to be implemented and stresses the need for built-in stimuli solutions. The third section includes top simulation and experimental results. The contexts of those results are presented; especially the modeling technique for the top simulation and the experimental set-up for the macroscale
and discrete component based results are described. Based on these results, the expected performance of a fully integrated smart bolometer is explored. The ultimate capabilities of smart bolometers will be limited only by the performance of the integrated electronics and the imagination of the designer. The fourth chapter highlights a particular solution for the integration of the bolometer and its associated electronics for the implementation of smart functions that would enable the realization of lines or matrixes of pixels for smart infrared imaging systems.
2. Bolometer with smart functions
Referring to literature, functions performed by smart sensors in that role include correcting for environmental conditions, performing diagnostic functions, and making decision (Frank, 2000). The smart functions implemented in the smart bolometer are described in this section as well as the means required for their implementation.
Before getting further into the description of the smart functions and their implementations, some notations and vocabulary are defined.
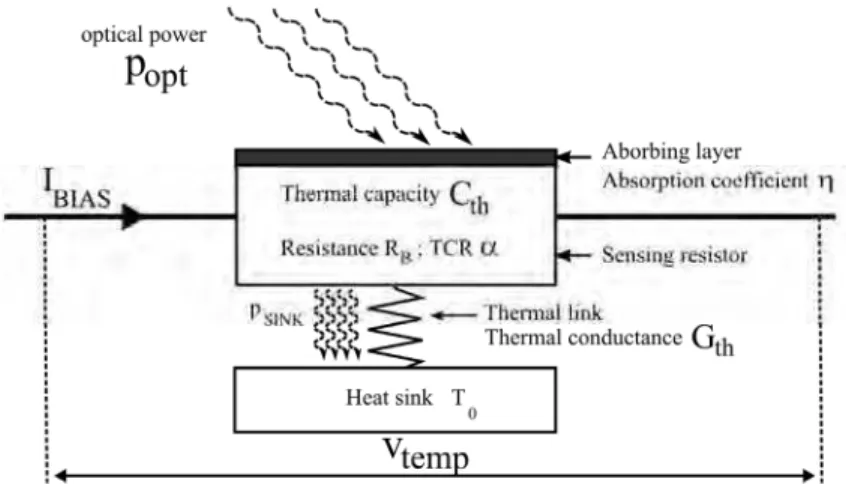
An uncooled resistive bolometer converts absorbed infrared (IR) radiation into heat, which in turn changes the resistance of a sensing resistor. The sensing resistor or thermistor is current biased. A bolometer can be modeled as an IR-sensitive element of thermal mass Cth
linked via a thermal conductance Gth to a substrate acting as a heat sink (see Fig. 3).
Fig. 3. Schematic of a resistive bolometer.
The performance of the bolometer is characterized by figures of merit such as its responsivity (R), the temperature coefficient of resistance (TCR or , positive or negative depending on the material) of the temperature sensing resistor, its specific detectivity (D*) and its effective time constant ( eff=Cth/Geff, Geff is the effective thermal conductance and
depends on Gth, that takes into account the electro thermal effect (Richards, 1994)).
The responsivity (R) describes the variations of the output voltage signal (vtemp) depending
on the IR input radiation (popt) and it is expressed by the transfer function of the bolometer
2 2 2
/ temp BIAS B opt eff th v I R R V W p G C (1)where is the absorption coefficient of the absorption layer of the device, IBIAS is the bias
current, RB is the bolometer resistance (sensing resistor).
The trade-off between time constant ( eff) and responsivity (R) appears in the dependence of
those parameters according to the thermal conductance. A low Geff is required to improve
the responsivity but this negatively increases the time constant. 2.1 Investigated smart functions
The smart functions of the smart bolometer described here are of two kinds: diagnostic functions and correction functions. A third type of smart functions is decision making which is not addressed here. Among the diagnostic functions, the first one is self-test. The self-test feature allows the verification of the thermal and electrical integrity of the bolometer at any time during its operating life. It provides the user with a qualitative result that informs whether the bolometer is working or not. The second diagnostic function is identification. The identification feature is more complex than test. The self-identification allows the characterization of the sensor and its associated electrical circuitry. This feature can be used at any time for monitoring the aging of the device and for deciding if a calibration is required. This feature is useful if closed-loop mode operation of the bolometer is considered in order to extract the forward path parameters (bolometer and its conditioning electronics) for the evaluation of the parameters of the controller that would drive the feedback path (Fig. 1.). Fig. 4. depicts the functional block diagram of an adaptative identification algorithm. Adaptative algorithms are interesting in that they run in real-time and do not require huge memory means since a few parameters and a few coefficients are stored. The identification principle is to iteratively adjust the parameters of the model to make the predicted output of the model converge towards the output of the forward path. The adjustment is performed according to the stimulation input signal and the error between the predicted output of the model and the current output. This convergence enables the extraction of estimated parameters representing the device, especially the time constant, the DC responsivity and the thermal characteristics of the bolometer.
Self-identification refers to identification using a built-in stimulus. The same type of identification algorithms can be used for calibration, in that case external optical stimuli are used and identification results are used to derive coefficients stored in a calibration table. After diagnostic functions, the developed smart bolometer implements a correction function that is range selection. Open-loop and closed-loop operation modes should be distinguished. In open-loop operation mode, the input range can be modified by changes of the gain of the conditioning electronics or more rarely through the current bias of the sensing resistor of the bolometer. In closed-loop mode, the input range is selected by the gain of the controller and the gain of the feedback. The closed-loop mode, in addition, allows input range selection around a user defined operating point.
(^ indicates estimation)
Fig. 4. Identification functional block diagram. With ( )u t the stimulation input (Pstim), ( )
y t the open-loop system output, ( ) t the parameters of the model, ( ) the observation t
vector, ( ) tT the predicted output, ( )( )t t the error between the system output and the predicted output, Geff,Cth,R0the extracted estimated parameters representing the device.
Considering lines or matrices of pixels, the identification smart function associated to closed-loop operation is a way of compensation of the spatial noise caused by the bolometer resistance dispersion due to fabrication process. Bolometer pixels individually operating in closed-loop mode would be able to compensate this spatial noise after external calibration or built-in calibration thanks to built-in input stimulus.
2.2 Requirements
Addressed implicitly in the previous sub-section, a built-in stimulus means is the first requirement to implement self-test or self-identification functions, the second one being a digital core for the implementation of the algorithms of the smart functions. A built-in stimulus implies being able to stimulate the sensor with a self-generated signal in the same manner as an external optical power stimulus would do. The first and straightforward solution is to use an optical power source. The major drawback of this solution is the integration limitation, especially if lines or matrixes of pixels are considered. The second solution relies on the electrical substitution principle (Rice, 2000) also referred to as electrical equivalence principle (Freire et al, 2009). This principle states that Joule heating electrically produced can be used to equivalently stimulate the sensing resistor of a bolometer compared to optical incoming power.
The availability of a built-in stimulation source can lead fairly directly to the closed-loop operation of the sensor. Indeed, only a controller has to be inserted in a feedback loop. The advantages obtained through closed-loop operation of bolometers detailed in (Denoual & Allègre, 2010) are rapidly recalled here. For instance, closed-loop operation mode enables to increase the bandwidth and the range of the measurement. Closed-loop mode makes it possible to work around a user-defined operating point. This feature is important for the input range selection around a user-defined operating point.
In practice, three ways exist for the realization of an electrical substitution stimulus and its extension for closed-loop operation of the bolometer. There are all based on electrical Joule heating generation and differ depending on whether the Joule heating is generated onto the sensing resistor of the bolometer or at its vicinity. The Joule heating is either produced by a current or a voltage. From now, voltage stimuli for the Joule heating generation are considered. The three implementations of electrical substitution are schematically represented in Fig. 5(b-d).
(a) (b) (c) (d)
optical electrical Fig. 5. Built-in stimulus means. (a) optical power source implementation. (b) electrical
substitution (ES) configuration type 1. (c) ES type 2. (d) ES type 3. With RBIAS the bolometer
biasing resistor, RB the sensing resistor of the bolometer, RH an additional resistor for Joule
heating, VBIAS the biasing voltage, VSTIM the voltage stimulus, IBIAS the DC bolometer bias
current, and iBIAS the variable bias current.
In type 1 implementation, Fig. 5(b), the voltage stimulus, VSTIM, is added to the bias voltage
VBIAS (Freire et al, 2009). The voltage stimulus produces Joule heating into the sensing
resistor of the bolometer. The voltage across the sensing resistor of the bolometer changes according to the resistance variations of the sensing resistor due to both Joule heating variations and bias current, iBIAS, variations. In that case, the thermal and electrical operating
points of the bolometer are intimately linked. This particular link makes the operation in closed-loop mode tricky and commonly yields to stability issues and does not allow taking advantage of the bandwidth increase due to closed-loop operation as pointed out in (Williams, 1990).
The type 2 implementation, Fig. 5(c), uses an additional resistor (RH) as a heater to produce
the Joule heating stimuli (Rice et al, 1998). It enables the separation between the electrical and the thermal operation points at the expense of an additional resistor. This additional resistor has to be close to the sensing resistor, which adds a constraint to the design of the bolometer. Operation in closed-loop mode using this configuration is successfully demonstrated in (Rice et al, 1998; Allègre et al, 2007).
The type 3 implementation, Fig. 5(d), exhibits the advantages of the type 1 and of type 2 implementations without their disadvantages, i.e. no additional resistor but separation of thermal and electrical operating points. This implementation is compatible with existing resistive bolometer without any material or design modification but still allows separating the electrical and thermal operating points (Denoual et al, 2009). The operating points are separated according to frequency basis. The bial voltage signal, electrical operating point, is a low frequency signal while the voltage stimulus signal for the thermal operating point is a high frequency signal, typically tens of MHz. No additional heat source is needed, and stability issues are fixed.
All this built-in stimulus implementations can be derived to operate the bolometer in closed-loop mode (Denoual & Allègre, 2010). The four built-in stimulus solutions illustrated in Fig. 5 may be used to implement smart functions and derive a smart bolometer. However, the ease of use and the flexibility of the type 3 implementation, Fig. 5(d), make it the best suitable candidate for smart bolometer integration despites its extra electrical circuitry compared to the other two electrically based solutions. This is demonstrated in the next section through simulation results and experiments on macroscale bolometer.
3. Actual work
Before getting into the long and expensive design and fabrication process of the monolithic smart bolometer, it is essential to perform validations to determine the feasibility and to guide the design. Our validation procedure goes through top simulations and macro-scale experiments with discrete components. Some results of both simulations and experiments are presented in this section to demonstrate the potentialities of integrated smart bolometers. As mentioned in the previous section, the integrated smart bolometer is based on the capacitively coupled electrical substitution (CCES) technique for built-in stimulus generation and closed-loop operation. Before getting into the results of simulations or experiments, the key features of the CCES principle are recalled; more information can be found in (Denoual et al, 2009; Denoual et al, 2010; Denoual & Allègre, 2010).
Capacitively Coupled Electrical Substitution (CCES)
The principle of the closed-loop mode operation using the electrical substitution (ES), also involved in the CCES technique, is depicted through Fig. 6 and Fig. 7, and described hereafter. With no external optical power applied, the thermal operating point (PBIAS) is set by the VPbias value. Typically the bolometer is heated up a few Kelvin, at temperature TBIAS,
over the room temperature, T0. When an external optical power, Popt, is applied, a change in
the resistance of the bolometer sensing resistor is sensed, and consequently the output signal of the controller changes, decreasing the average power of the feedback Joule heating, Pfb.
The net effect is to produce a Joule heating to counterbalance the externally applied optical power on the bolometer so as to keep the temperature of the sensing resistor of the bolometer constant at TBIAS.
Among ES techniques, the CCES technique presents several distinct characteristics.
The capacitively coupled electrical substitution dissociates the electrical and thermal operating points according to a frequency basis as already mentioned. High frequency
modulated signals are used for the voltage applied to the sensing resistor for the heat feedback. Since the feedback is high frequency, the feedback signal does not end up in noise signals in the bandwidth of the sensor.
Fig. 6. Block diagram of a closed-loop implementation of a bolometer using electrical substitution (ES). G is the amplifier gain and Gfb is the gain of the feedback shaping module.
Vmes is the output in closed-loop mode.
This implementation can be applied to any kind of uncooled resistive bolometer. The digital implementation, involving pulse width modulation (PWM) or Sigma-Delta modulation, in general terms pulse coded modulation (PCM), enables the linearization of the feedback path as well as a direct digital output power reading (Denoual et al, 2010). Clocking for this type of system is typically about 1-10 MHz. Fig. 8 depicts one example of such digital implementation.
Fig. 7. Electrical substitution principle used for closed-loop mode operation. 遖 without external optical power, the thermal operating point is set by the bias power corresponding to the VPbias voltage. 遘 with external optical power, the total amount of power dissipated
Fig. 8. Schematic of a digital implementation of the capacitively coupled electrical
substitution technique for closed-loop operation of a resistive bolometer involving a PWM modulation with a duty cycle a .
3.1 Top-simulation and modeling
Generally speaking, the main specification for the environment used for the top-simulation of a smart sensor is its ability to validate the algorithms implementing the smart functions in their operating context, i.e. including the sensor and its associated electronics. Few simulation environments address this specification because it implies mixed simulations (analog/digital) and multiphysics simulations, here optical, thermal and electrical. Environments commonly used address only one of each simulation type; for instance ANSYSÆ or COMSOLÆ for multiphysics simulation widely used for MEMS sensor design and simulation, SPICE-like environments for analog simulation and NCSimÆ or ModelSimÆ environments for digital simulation.
Spice-like environments may be used for top-simulation of system combining electronics and sensors through modeling of the sensor with equivalent electrical circuits (Jones et al, 2003). However, Spice-like simulators are not suitable for the validation of algorithms because the algorithms implemented on the digital part cannot be run. Only snapshots corresponding to specific and static configurations can be tested.
Long time simulations or huge processing requirements prevent the usage of coupled or mixed environments for the type of simulation considered here.
Modeling using VHDL-AMS or Verilog-AMS has been proposed for the modeling and for multi-domain simulation of MEMS devices in their functional environment (Chapuis et al, 2008). But as far as top validation is concerned, i.e. test of embedded algorithms in their operating context, these techniques exhibit huge simulation times that are not compatible
with the validation of the algorithms and usually suffer from convergence issues. Besides, the set-up of that kind of simulations is often tricky.
Matlab with appropriate modeling of the analog blocks of the system can be used for this kind of top-simulation, but no direct link exists between the electrical schematic and the Matlab schematic. This is a disadvantage when the design of the integrated circuit and monolithic device is considered.
The simulation environment chosen here is purely digital and enables fast simulation without convergence issues. It is associated with a modeling technique already applied for mixed integrated electronic circuits such as phase-locked loops (Schubert, 1999; Staszewski et al, 2005) and uses the standard VHDL as a description language (Denoual & Attia, 2011). Advantages of the used modeling technique come from: (i) the event-driven nature of the simulation using purely digital environment and (ii) the properties of the standard VHDL language. The event-driven nature of the simulation results in drastically shorter simulation times compared to time-driven simulation using for instance Spice (Zhuang et al., 2006). This modeling technique does not suffer from the convergence issues usually observed with other techniques because it uses digital simulation environments (ModelSim, NCSim, ). Finally, the standard VHDL syntax with users defined types enables implicit connectivity check between the parts of the designed system since in VHDL two connected signals must have the same type.
3.1.1 Modeling technique
The basic principle of this modeling technique is the discretization of the analog parts of the design. An appropriate modeling of the analog parts of the design is desirable to overcome the problematic induced by different time scales. This type of problematic exists in this work involving low frequency thermal phenomena (< kHz), and high frequency electrical signals. All the elements of the system are modeled using standard VHDL language. Those elements are schematically presented in Fig. 9 corresponding to the testbench. The testbench also includes the optical power stimuli and the stimuli process. In this example, the smart function simulated is open-loop identification.
In the case of this study, the modeling of the analog blocks, illustrated in Fig. 10, is performed in 3 steps: 1- definition of analog transfer function of the block; 2- discretization of the analog model; 3- VHDL description of the discretized model.
The model for the bolometer corresponds to the VHDL transcription of the discretized transfer function (1). The discretization is achieved using the bilinear transformation. The conversion process is divided into two consecutive processes: the thermal process dealing with power inputs and temperature, and the electrical process corresponding to the temperature measurement. This divided structure would enable to take into account the electrothermal feedback phenomenon (Richards, 1994) of the bolometer itself if necessary in the simulation. At the present time, this phenomenon is taken into account through the use of the effective thermal conductance (Geff) rather than the physical thermal conduction (Gth).
The models for the amplifier block merely consists in a gain since the bolometer voltage output signal is in the bandpass of the filter.
Bolometers
Fig. 9. Complete Testbench. The circle marked arrows indicate the signals observed in the result of simulation presented in this section. (a) VPbias is the voltage for the built-in electrical stimulus; (b) Popt represents the optical input signal; (c) VT is the output
The model for the controller block in this case implements the equations of a digital proportional integral (PI) controller. The operation mode input, op_mode, enables to choose between open or closed-loop operation modes.
The model for the feedback shaping block consists in a gain and saturation limitations corresponding to the PWM modulation. It linearly gives the feedback power (Pfb) according
to the duty cycle a of the PWM modulated control signal (Vcontrol) following Pfb a Gfb,
with Gfb the gain of the feedback shaping block. Gfb is a function of the amplitude of the
carrier (Vcarrier) and the resistance of the sensing resistor of the bolometer (RB). The high
frequency carrier that translates the feedback bandwidth is not taken into account. Pragmatically, no signal at this frequency is generated for the simulations, only the feedback duty cycle is considered.
The optical source block generates stimuli with parameterized frequency, amplitude and shape.
The identification block implements a least-mean-square adaptative fitting algorithm which role is to extract parameters in order to optimize the feedback controller and/or to monitor the aging of the device; it corresponds to the functional block diagram of Fig. 4. Detailed explanation of this algorithm and of the parameters involved can be found in (Landau, 1988; Ljung, 1999).
The complete modeling of the bolometer and its associated conditioning and feedback electronics as well as the modeling of the external optical source enable the validation of algorithms implemented in digital parts. Identification is an example of such algorithms that can be validated using this modeling technique and digital simulation tools.
Fig. 10. Standard VHDL modeling procedure. 遖 analog model of the transfer function of the resistive bolometer, 遘 discretization of the analog model, 遞 VHDL transcription of the difference equations.
3.1.2 Top-simulation results
This section illustrates the type of simulation that can be performed with this modeling technique. The simulations were performed using the ModelSimÆ Altera 6.3 Quartus II 8.1 software, i.e. a purely digital environment. The figure Fig. 11 shows the three configurations of the simulation sequence performed and illustrated in Fig. 12. First an open-loop operation sequence, Fig. 11(1), illustrates the time constant and magnitude of a typical response of the bolometer when exposed to an incoming square shape optical power Popt. The second
sequence, Fig. 11(2), corresponds to a built-in random stimulation to perform the identification procedure. The adaptative least-mean-square algorithm illustrated in Fig. 4 is
implemented using standard VHDL to extract the characteristic parameters of the bolometer while the stimulus is applied. The duration of the identification procedure depends on the time constant of the bolometer. To achieve the convergence of the identification parameters, an identification duration of several hundred times the bolometer time constant is required. A 10 ms time constant bolometer leads to an identification procedure of a few seconds. Finally, in the last sequence, Fig. 11(3), the bolometer operates in closed-loop mode thanks to a controller adjusted with the extracted parameters at the end of the identification procedure. A standard factor 10 for the time constant reduction is applied in this simulation. One should notice that the time scale is not mentioned since all the timing parameters (sampling frequency, PWM frequency, carrier frequency) are adapted to the bolometer and therefore scale up or down with the time constant of the bolometer. The useful time reference is the time constant of the bolometer in open-loop.
(1)
(2)
(3)
Fig. 11. Simulation sequences. (1) open-loop mode operation. (2) identification procedure mode. (3) closed-loop mode operation. According to the operation mode, the location of the output differs. Note that input may be either external and optical (1,3) or internal and electrical (2).
Simulations in either open-loop or closed-loop are performed without convergence issues within a few seconds. This enables fast parameters optimization for the control through series of simulations. It shall be mentioned that equivalent simulations with analog environments (spice-like, coupled or mixed simulators) would take hours if no convergence problems occur. A simulation result is represented in Fig. 12. This simulation underlines the ability of the modeling technique to validate algorithm supporting smart functions in their operating context by top simulation.
: To w a rd Monolit hic Bolometer w ith Smart Fu nctions
Fig. 12. Example of top simulation chronogram. Three consecutive operating sequences are represented: 1- open-loop mode operation, 2- identification process in open-loop mode, 3- closed-loop mode operation. Insets illustrate the typical signals in each case. During the open-loop and closed-loop operating phases, the stimulus is an optical square shape signal. During the identification process, the stimulus is electrical. A pseudo-random binary sequence is used in order to optimize the identification process. The identification process allows the estimation of the thermal parameters of the bolometer. It consequently enables the evaluation of the parameters of the controller in order to reach desired performance, here a time constant in closed-loop 10 times smaller than the one in open-loop and a damping of 0.7 for stability and speed of response reasons. During the closed-loop operation, the amplitude of the substituted electrical power is determined by negative feedback within the controller of the feedback path. When the feedback power compensates
3.2 Macro-scale and discrete components experiments
Macro-scale experiments are important in that they validate the models of the top-simulations presented in the previous section. The top-top-simulations validate the system functionality and the smart function algorithms during the design phase, whereas the experiments exhibit additional non-simulated factors such as noise or nonlinearities and therefore exhibit the performance of the system. This section presents a macro-scale and discrete components set-up and some results of characterization performed with it. The major results are the successful reduction of the time constant of the system by at least two orders of magnitude, and the practical demonstration of the self-test and range selection smart functions.
3.2.1 Description of the macro-scale set-up
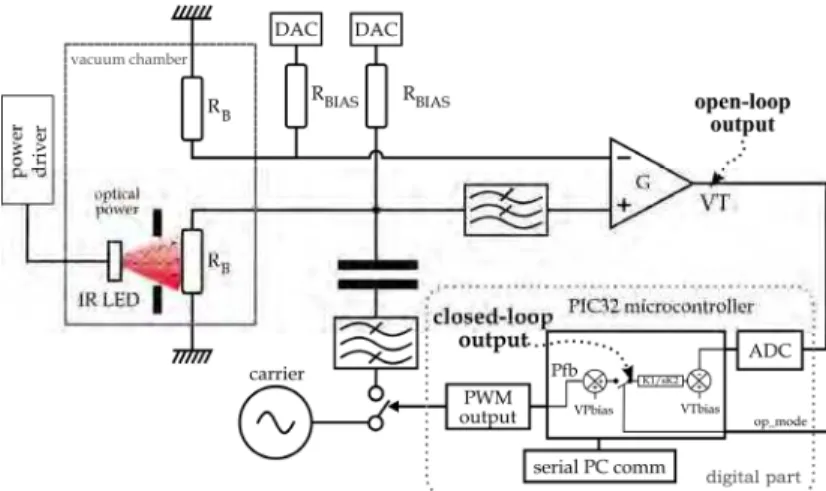
The set-up, depicted in Fig. 13, consists in a pair of resistive bolometers, RB, and a digital
implementation of the CCES technique for the built-in stimuli generation and the closed-loop mode operation. The resistive bolometers are connected in a bridge arrangement with one sensing resistor in each leg of the bridge (RBIAS and RB). Only one is exposed to the
optical power stimuli for differential measurement.
Fig. 13. Set-up for the macro-scale and discrete components experiments. Two resistive bolometers, RB, under vacuum, are used for differential measurement. Only one is exposed
to the infrared optical power from a LED. The exposed bolometer in operated in closed-loop mode through a digital implementation of the CCES technique.
The bolometers are macro-scale suspended bolometers made of 60 µm thick, 0.8 cm large, 6 cm long suspended PolyEthylene Naphtalate (PEN) membranes covered with aluminum metallic layer. The aluminum layers are patterned to form the 700 Ω resistors used as sensing resistors. The active optical power absorption area is 0.5x0.5 cm2. Global
characteristics of those bolometers extracted from measurements at 20 mTorr and room temperature are:
TCR = 2.310-3/K; Geff = 550 µW/K, and
eff
The huge time constant, eff=110 s, is a consequence of the macro-scale nature of the
bolometer.
A microcontroller (PIC32) implements the closed-loop controller and the embedded algorithms. Two digital-to-analog converters (DAC) drive independently the voltage of the legs of the bridge to set the electrical bias point (Denoual et al, 2010). The operation mode input (op_mode) is a logic signal that selects between open-loop or closed-loop operation mode. The PWM modulated output signal for the feedback results in a linear dependency of the heat power feedback on the control voltage (Pfb). The frequency of the carrier is fixed at
1 MHz while its amplitude changes between 100 mV and 200 mV depending on the measurement range choice.
All the experiments are led at room temperature and under a primary vacuum of 20 mTorr to limit convection effects.
The external optical power stimuli source is an infrared LED with a 1 mW power at =1.45 µm. The amplitude of the optical power is modified by duty cycle modulation (with duty cycle d) of the voltage of the power driver as in (Denoual et al, 2010) and illustrated in Fig. 14. The frequency, 1/TPWM, of the pulse modulated signal is 10 kHz, i.e. several orders
of magnitude over either the open/closed-loop bandwidth. Consequently, the bolometer in open-loop or closed-loop operation modes merely responds to the average value of the applied power as illustrated in Fig. 14.
Fig. 14. IR LED supply principle. A double modulation enables to generate square shape optical stimulus with controllable amplitude.
3.2.2 Macro-scale and discrete components experimental results 3.2.2.1 Time constant reduction
The first set of experiments, illustrated in Fig. 15, aims to demonstrate the possibility of reducing the time constant by at least 2 orders of magnitude.
During this experiment, the bolometer successively operates in open or closed-loop mode. During optical power ON sequence, 0.1 Hz frequency optical stimuli are applied from the infrared LED of the set-up. During power OFF sequence, no optical power is applied. The open-loop output signal during the open-loop operation phase illustrates the time constant of the system in open-loop through its typical first order response. The system in open-loop acts as a low-pass filter with a cut-off frequency of 1.45 mHz ( eff=110 s) that
ON sequence of the optical power. On the contrary, during closed-loop operation zoomed in the upper view of Fig. 15, as the bandwidth of the system is increased, the closed-loop output signal is able to follow the 0.1 Hz variations of the optical input stimuli.
Fig. 15. Experiment illustrating the time constant reduction in closed-loop operation mode. The main graph represents the recorded output signals in open-loop (VT) and closed-loop (Pfb). The open-loop output VT is in Volt (left axis) while the closed-loop output is in percentage of the feedback power full-range (right axis). The optical stimulus sequence is ON [0-s], OFF [0 s ; 1000 s], ON [1000 s ; 2700 s], OFF [2700 s ; end]. During the ON sequence
of the optical stimulus, in the center of the graph, the operation mode is successively open-loop and closed-open-loop.
By operating the system in closed-loop mode, the bandwidth is increased from 1.45 mHz to more than 3 Hz. This result highlights an improvement of the system bandwidth by more than 200.
3.2.2.2 Smart function validation: Self-test
Although this function is rather basic, it may be useful for the user as a basic diagnostic function to answer the crucial question: is the bolometer and its associated electronics working or not ?. This feature requires the existence of a built-in stimulus input. The signal VPbias that sets the thermal working point of the system is used for this built-in stimulation
(see Fig. 1, Fig. 6 and Fig. 13). Typically, self-test is activated by the user with a logic high level on the self-test input pin. During the logic high level, a Joule heating is applied onto the sensing resistor of the bolometer equivalent to approximately 20% of full-scale optical input power, and thus a proportional voltage change appears on the output signal, either open-loop or closed-loop output depending on the configuration test. When activated, the self-test feature exercises both the entire thermal structure and the electrical circuitry, and in addition in closed-loop mode the feedback path. The results presented in the Fig. 16 illustrate this functionality both in open or closed-loop. In open-loop mode, the pulsed stimuli on VPbias result in pulsed response at the output indicating that the bolometer is
working properly. In closed-loop mode, the pulsed stimuli on VPbias result in pulse response
the thermal working point constant. The different time scales in each cases illustrates once again the time constant reduction in closed-loop mode.
(a) (b) Fig. 16. Self-test response in open-loop (a) and closed-loop (b) operation modes. Pulses on
VPbias generate Joule heating onto the resistance of the bolometer through the feedback
shaping electronics so as to stimulate a response from the device. 3.2.2.3 Smart function validation: Range and operating point selection
The next experimental results illustrate the range selection ability as well as the possibility of operating around a user-defined operating point. Fig. 17(a) shows the measured signal in open-loop mode as a function of the input power while Fig. 17(b) shows the measured power in closed-loop mode as a function of the input power. These transfer functions are obtained with infrared LED source stimulation in the bandwidth of the device (10 mHz in the open-loop mode configuration and 100 mHz in closed-loop mode configuration).
(a) (b) Fig. 17. Transfer functions in open-loop (a) and closed-loop (b). The dashed lines (b) indicate
the two different slopes of the transfer functions in closed-loop mode. (1) and (3) exhibit a slope twice as big as the one of (2). (3) is the transfer function in closed-loop mode around 70% optical input power.
In open-loop the measured signal (VT) is a function of the input optical power, responsivity
of the bolometer and the gain of the forward path amplifier. Therefore, the transfer function can be adapted to various incoming power ranges by modification of the gain of the amplifier. The modification of the responsivity through the bias current is not relevant because the signal-to-noise ratio is negatively impacted if the responsivity is decreased. The responsivity has to be as high as possible according to the fabrication technology.
In closed-loop mode, the output signal is a function of the input power and the feedback shaping gain. The overall measurement range is then given by the pulse coded modulation range, the ADC range and the feedback gain. Therefore the measurement range of the device may be easily modified to measure lower power or higher power optical stimuli by respectively increasing or decreasing the feedback shaping scale factor. Gfb stands for the
feedback shaping gain (see Fig. 6) involving the carrier voltage amplitude, the PCM voltage amplitude and the filtering amplification gain. The feedback shaping scale factor specifies the voltage change of the output per power unit of applied optical power. The selection of the operating point achievable in closed-loop mode also enables to move the operating point of the transfer function of the bolometer around a user-defined operating point, in order for example, to measure optical power variations in an input optical signal of given mean power value.
These possibilities in closed-loop mode are illustrated in the graph in Fig. 17(b). Two transfer slopes resulting in two different measurement ranges are shown. In addition the transfer curve (3) of Fig. 17(b) shows the transfer of the system to optical power variations around an optical power mean value of 70% of the maximum IR LED power.
Such control of the measurement range shall allow the implementation of algorithm that dynamically adjusts the scale to prevent saturation and optimize the resolution.
3.3 Experimental results section conclusion
The results section experimentally illustrates that a bolometer can be speed up by 2 orders of magnitude. Such time response improvement gives freedom in the design constraint of bolometers and especially for the conventionally responsivity/time constant tradeoff. For example, standard micro-bolometers designed for imaging are designed to meet the frame image refreshment rate of 20 Hz. This constraints the upper time constant limit for these devices. On the other hand, the thermal capacitance of these micro-bolometers cannot be boundlessly reduced because of material stiffness required to ensure self-sustention. Consequently, time constant consideration rather than responsivity optimization determines the thermal conductance. The demonstrated two orders of magnitude reduction of the time constant opens the door for bolometers two orders of magnitude faster than existing ones (200 µs compared to 20 ms) or bolometers exhibiting the same time constant but with a two order of magnitude higher responsivity. In both cases, such devices characteristics are not achieved yet. Currently the commercially available IR image sensors have detectivity, proportional to responsivity, of the order of few 108 W-1.cm.Hz1/2 and image refresh rate of
10-30 frame/s. Two orders of magnitude improvement means detectivity and refresh rate reaching 1010 W-1.cm.Hz1/2 and several 1000 frames/s respectively. New application fields of
infrared-monitoring in chemical and entertainment fields for instance will be then possible, while the existing applications fields will be reinvigorated. Faster frame rate of IR imager
used for process control will allow increasing the speed of production line; the economic impact is direct. In automotive safety applications, higher image data rate with optimized algorithms will result in faster and more reliable detection. For thermal budgeting of buildings, improved detectivity will enhance diagnostics. In all cases, the extra smart functionalities facilitate the use of IR imagers.
4. Monolithic 3D smart bolometer
Results shown in the previous section, demonstrate the possibly of realizing bolometer exhibiting smart functions such as self-test or range selection. The integration on one single chip of such device would yield to monolithic smart bolometer following the example of integrated accelerometers. Even though such devices might be interesting and competitive compared to thermopile-based IR detectors applied to distance temperature measurement (Texas, 2011), the real goal application of such devices is imaging. Imaging requires lines or matrixes of pixels and consequently adds geometrical constraints to the integration of smart bolometer pixels. The CCES technique enables closed-loop operation and smart functions implementation with built-in stimuli at the cost of an electrical circuitry bigger than the readout integrated circuitry of standard bolometer imaging devices. Consequently, the integration with existing topology and fabrication processes of the CCES circuitry under each pixel of an imaging device seems quite challenging. However, emerging micromachining technologies might come as a rescue to provide a solution. This solution is discussed in this prospective section.
The integration issue comes from the lack of space under the pixel to integrate the CCES with actual planar conventional technologies, i.e. 2D technologies. Adding one dimension gives some more space and design freedom. A 3D geometry, as illustrated in Fig. 18, dissociates the sensing area of the pixel from the area needed for the electrical circuitry implementation. While the electrical circuitry is designed onto the device surface as it is common, the sensing area of the pixel is realized vertically in the bulk of the substrate. Such 3D design is made possible by the emerging 3D micro-fabrication technologies. Fig. 19 illustrates the typical geometries and shapes available with submicron deep etching process. Vertical 50 µm walls in depth with few hundred nanometer thickness are reported using this etching process (Mita et al, 2006; Hirose et al, 2007). Such characteristics are fully compatible with the realization of the vertical sensing area, the resonant optical cavity for absorption enhancement and the folded legs behind, all together constituting the bolometer pixel. The sensing area is typically 30 µm to 50 µm wide and few hundred nanometers thick. The thickness of the sensing area is usually reduced in order to reduce the thermal capacitance of the bolometer pixel. The operation in closed-loop mode can release this constraint because of the bandwidth increase (time constant reduction) achievable in closed-loop mode. The resonant optical cavity, which enhances the absorption of incoming optical power, consists of a /4 space between the sensing area and a reflective layer. Taking into account the mid-infrared range object of such devices /4 is a few microns distance fully compatible with the submicron deep etching process. Usually, efforts to increase the fill factor include reducing the size of the contacts and can use buried legs on an intermediate level between the level of the sensitive area and that of the substrate. However the buried legs must not interfere with the increased absorption provided by the resonant optical cavity
(Kruse, 2001). In the proposed 3D configuration, the folded legs do not interfere with the resonant optical cavity. The folded legs can be lengthened to reach a target thermal conductance without negatively impacting the fill factor. Considering the etching performances of the submicron deep etching process, the legs can be very narrowly folded. Hence, the distance between the fold of the legs would not be limited by the fabrication technology but by thermal transfer at submicron scale. Indeed, at nanoscale, the thermal transfer mechanisms change and radiative heat exchange mechanism increases as the dimension between surfaces decreases below 200 nm because of surface phonon polariton mediated energy transfer (Rousseau et al, 2009; Shen et al, 2009). The space between the fold of the legs should not be below 200 nm to ensure that the thermal conductance of the pixel is only mediated by the conduction mechanism. Taking this into account and the actual pixel geometry and thermal conductance (10-6-10-7 W/K), the same thermal conductance could be
achieved within a 30 µm space behind the pixel.
Fig. 18. 3D bolometer pixel. The pixel is micro-machined vertically into the substrate while the conditioning and feedback electronics is on-plane.
Fig. 19. SEM picture of submicron deep trenches in silicon. (Courtesy of Mita Lab., University
of Tokyo).
The 3D bolometer pixel and its association into matrixes to form a smart IR retina, depicted on Fig. 20, as defined with Dr. Yoshio Mita of the university of Tokyo, represents a technological breakthrough in the design, the fabrication and the use of uncooled resistive bolometers for infrared imaging; a technological breakthrough leading to faster, more
sensitive and smart infrared imaging devices. The 3D bolometer pixel consists in a resistive bolometer pixel associated with its conditioning and feedback electronics. Within the smart IR retina configuration, the processing means are shared between the 3D bolometers of the same line, and lines are stacked to form the imaging system.
Such 3D design presents an additional advantage compared to current devices that is an improved spatial resolution. Thermal infrared detectors since they are fabricated over the same substrate in the classical fabrication process are not thermally independent. As a consequence, the thermal diffusion between the pixels reduces the spatial resolution of the imaging system. In the case of the proposed structure the sensing area of the 3D pixel are physically isolated by empty spaces and each pixel will be thermally regulated, therefore the thermal diffusion between pixel will be avoided and then the spatial resolution enhanced compared to current devices.
Fig. 20. Smart IR retina. Several 3D bolometer pixels are associated with a common deported digital core on a line, here 4 or 6 3D pixels illustrated per line. Several lines, here 5, are stacked vertically to form the smart IR retina.
The fabrication technique is fully compatible with standard integrated circuit manufacturing methods enabling all the signal processing (conditioning, control and feedback) circuitry to be combined on the same chip with the sensor.
Even if the geometry principle and the fabrication technology are established, the fabrication of such monolithic device is still challenging and will require several years of development, but the work investment is worth.
5. Conclusion
The capacitively coupled electrical substitution technique is used to implement smart functions for uncooled resistive bolometers. Top-simulations and macro-scale experiments enable to derive the expected performance and functionalities of monolithic smart bolometer. This work takes place at a time where the microfabrication technologies and
smart function integration converge to give birth to what could be a technological breakthrough in the field of infrared imaging.
A rose with a microcontroller would be a smart rose.
-Randy Frank
6. Acknowledgment
This work was and is supported in part by the JSPS-Bridge program of the Japan Society for the Promotion of Science under No. BR-100201 and by the P-SOC program of the INS2I department of French CNRS under No. BFC-78518.
7. References
Allègre, G; Guillet, B; Robbes, D; Méchin, L; Lebargy, S; Nicoletti, S. (2007). A room temperature Si3N4/SiO2 membrane-type electrical substitution radiometer using thin film platinum thermometers, Measurement Science and Technology, Vol.18, No.1, pp 183-189.
Chen, X; Yi, X; Yang, Y; Li, Y. (2006). A new CMOS readout circuit for VO2-based uncooled focal plane arrays, International Journal of Infrared and Millimeter Waves, Vol.27, pp 1281-1291
Chapuis, Y-A.; Zhou, L.; Fujita, H. & Hervé, Y. (2008). Multi-domain simulation using VHDL-AMS for distributed MEMS in functional environment: Case of a 2D air-jet micromanipulator, Sensors and Actuators A: Physical, Vol.148, No.1, pp 224-238 Denoual, M.; Delaunay, S. & Robbes, D. (2009). Bolometer with heat feedback, International
patent, WO/2009/034066
Denoual, M.; Allègre, G.; Delaunay, S. & Robbes, D. (2009). Capacitively coupled electrical substitution for resistive bolometer enhancement, Measurement Science and
Technology, Vol.20, DOI: 015105
Denoual, M.; Lebargy, S. & Allègre, G. (2010). Digital implementation of the capacitively coupled electrical substitution for resistive bolometers, Measurement Science and
Technology, Vol.21, DOI: 015205
Denoual, M. & Allègre, G. (2010). Operating Uncooled Resistive Bolometers in a Closed-Loop Mode In: Bolometers: Theory, Types and Applications, Torrence M. Walcott Editor, NOVA Science publisher, ISBN: 978-1-61728-289-8
Denoual, M.; Delaunay, S.; Lebargy, S. & Allègre, G. (2010). CCES: A new configuration for electrical substitution for bolometers In: Metrology and Instrumentation Selected
Topics, Sebastian Yuri Cavalcanti Catunda Editor, EDUFCG Campina Grande,
ISBN: 978-85-8011-028-2
Denoual, M. & Attia, P. (2011). Standard VHDL Modeling and Top-Simulation for the Development of an Integrated Smart-Bolometer, Proceedings of SensorDevices 2011 2nd International Conference on Sensor Device Technologies and Applications,
Nice, France, August 21-27, 2011
Frank, R. (2000). Understanding smart sensors, Artech House Inc. publisher, ISBN: 0-89006-311-7
Freire, R. C. S.; Catunda, S. Y. C. & Luciano, B. A. (2009). Applications of Thermoresistive Sensors Using the Electric Equivalence Principle, IEEE Transactions on
Instrumentation and Measurement, Vol.58, No.6, pp 1823-1830
Galeazzi, M. (1998). An external electronic feedback system applied to a cryogenic micro-calorimeter, Review of Scientific Instruments, Vol.69, No.5, pp 2017-2023
Hirose, K.; Shiraishi, F.; Mita, Y. (2007). A simultaneous vertical and horizontal self-patterning method for deep three-dimensional microstructures, Journal of
Micromechanics and Microengineering, Vol.17, S6876
Joens, H.; Aslam, S.; Lakew, B. (2003), Bolometer simulation using SPICE, TDW 2003,
International Workshop on Thermal Detectors for Space Based Planetary, Solar, and Earth
Science Applications, Washington, DC USA, June 19-20, 2003
Kruse, P.W. (2001). Uncooled Thermal Imaging: Arrays, Systems and Applications, SPIE
Optical Engineering Press, Bellingham, WA, ISBN: 0-8194-4122-8
Landau, I.D. (1988). Identification et commande des systèmes, Traité des Nouvelles
Technologies Hermés, ISBN : 2-86601-119-8
Lee, I.I. (2010). A new readout integrated circuit for long-wavelength IR FPA, Infrared
Physics and Technology, Vol.53, pp 140-145
Ljung, L.L. (1999). System identification Theory for the User, Prentice Hall PTR, ISBN: 0-13-656695-2
Lv, J; Jiang, Y.D.; Zhang, D.L.; Zhou, Y. (2010). An ultra low noise readout integrated circuit for uncooled microbolometers, Analog Integrated Circuits and Signal Processing, Vol.63, pp 489-194
Mita, Y.; Kubota, M.; Harada, T.; Marty, F.; Saadany, B.; Bourouina, T. and Shibata, T. (2006). Contour lithography methods for DRIE fabrication of nanometer-millimetre-scale coexisting Microsystems, Journal of Micromechanics and Microengineering, Vol.16, S135-S141
Rice, J.P.; Lorentz, S.R.; Datla, R.U.; Vale, L.R.; Rudman, D.A.; Sing, M.L.C., & Robbes, D. (1998). Active cavity absolute radiometer based on high-Tc superconductors,
Metrologia, Vol. 35, pp. 289-293
Rice, J.P. (2000). An electrically substituted bolometer as a transfer-standard detector,
Metrologia, Vol.37, pp 433-436
Richards, P.L. (1994). Bolometers for infrared and millimeter waves, Journal of Applied
Physics, Vol.76, pp 124
Rousseau, E.; Siria, A.; Jourdan, G.; Volz, S.; Comin, F.; Chevrier, J. & Greffet, J-J. (2009). Radiative heat transfer at the nanoscale, Nature Photonics Letters, DOI: 10.1038 Shen, S.; Narayanaswamy, A. & Chen., G. (2009). Surface Phonon Polaritons Mediated
Energy Transfer between Nanoscale Gaps, Nano Letters, Vol.9, No.8, pp 2909- 2913
Schubert, M. (1999). Mixed-Sginal Event-Driven Simulation of a Phase-Locked Loop, IEEE
International Behavioral Modeling and Simulation Conference, Orlando, Florida, USA,
October 4-6, 1999
Staszewski, R.B.; Fernando, C.; Balsara, P.T. (2005). Event-Driven Simulation and modeling of phase noise of an RF oscillator, IEEE Transactions on Circuits and Systems, 2005, Vol.52, No.4, pp 723-733
Texas Instrument. (2011). Infrared Thermopile Sensor in Chip-Scale Package, July 27, focus.ti.com/docs/prod/folders/print/tmp006.html
Williams, C.D.H. (1990). An appraisal of the noise performance of constant temperature bolometric detector systems, Measurement Science and Technolology, Vol.1, pp 322-328
Yole Développement, (2010). Uncooled IR Cameras & Detectors for Thermography and Vision, Technologies & Market Report, June
Zhuang, J.; Du, Q.; Kwaniewski, T. (2006). Event-Driven Modeling and Simulation of a Digital PLL, IEEE International Behavioral Modeling and Simulation Conference, San José, California, September 14-15, 2006, pp. 67-72
Edited by Prof. Unil Perera
ISBN 978-953-51-0235-9 Hard cover, 196 pages
Publisher InTech
Published online 09, March, 2012 Published in print edition March, 2012
InTech Europe
University Campus STeP Ri Slavka Krautzeka 83/A 51000 Rijeka, Croatia Phone: +385 (51) 770 447 Fax: +385 (51) 686 166 www.intechopen.com
InTech China
Unit 405, Office Block, Hotel Equatorial Shanghai No.65, Yan An Road (West), Shanghai, 200040, China Phone: +86-21-62489820
Fax: +86-21-62489821
Infrared Detectors and technologies are very important for a wide range of applications, not only for Military but also for various civilian applications. Comparatively fast bolometers can provide large quantities of low cost devices opening up a new era in infrared technologies. This book deals with various aspects of bolometer developments. It covers bolometer material aspects, different types of bolometers, performance limitations, applications and future trends. The chapters in this book will be useful for senior researchers as well as beginning graduate students.
How to reference
In order to correctly reference this scholarly work, feel free to copy and paste the following:
Denoual Matthieu, de Sagazan Olivier, Attia Patrick and Allègre Gilles (2012). Smart Bolometer: Toward Monolithic Bolometer with Smart Functions, Bolometers, Prof. Unil Perera (Ed.), ISBN: 978-953-51-0235-9, InTech, Available from: http://www.intechopen.com/books/bolometers/smart-bolometers-toward-monolithic-bolometer-with-smart-functions