Titre: Title:
Rheological behavior of cellulose nanocrystal suspensions in polyethylene glycol
Auteurs: Authors:
Quentin Beuguel, Jason Robert Tavares, Pierre J. Carreau et Marie-Claude Heuzey
Date: 2018
Type: Article de revue / Journal article Référence:
Citation:
Beuguel, Q., Tavares, J. R., Carreau, P. J. & Heuzey, M.-C. (2018). Rheological behavior of cellulose nanocrystal suspensions in polyethylene glycol. Journal of Rheology, 62(2), p. 607-618. doi:10.1122/1.5010789
Document en libre accès dans PolyPublie Open Access document in PolyPublie
URL de PolyPublie:
PolyPublie URL: https://publications.polymtl.ca/3005/
Version: Version finale avant publication / Accepted versionRévisé par les pairs / Refereed Conditions d’utilisation:
Terms of Use: Tous droits réservés / All rights reserved Document publié chez l’éditeur officiel
Document issued by the official publisher
Titre de la revue:
Journal Title: Journal of Rheology (vol. 62, no 2)
Maison d’édition:
Publisher: Society of Rheology/AIP
URL officiel:
Official URL: https://doi.org/10.1122/1.5010789
Mention légale:
Legal notice:
This article may be downloaded for personal use only. Any other use requires prior permission of the author and AIP Publishing. The following article appeared in Beuguel, Q., Tavares, J. R., Carreau, P. J. & Heuzey, M.-C. (2018). Rheological behavior of cellulose nanocrystal suspensions in polyethylene glycol. Journal of Rheology, 62(2), p. 607-618. and may be found at https://doi.org/10.1122/1.5010789
Ce fichier a été téléchargé à partir de PolyPublie, le dépôt institutionnel de Polytechnique Montréal
This file has been downloaded from PolyPublie, the institutional repository of Polytechnique Montréal
Rheological behavior of cellulose nanocrystal suspensions in
polyethylene glycol
Quentin BEUGUEL, Jason R. TAVARES, Pierre J. CARREAU, Marie-Claude HEUZEY
Department of Chemical Engineering, CREPEC – Research Center on High Performance Polymer and Composite Systems, Polytechnique Montreal, Montreal, QC, H3T 1J4, Canada.
Corresponding author: Marie-Claude Heuzey (E-mail: marie-claude.heuzey@polymtl.ca), +1 (514) 340-4711 ext. 5930
Abstract
The rheological behavior of cellulose nanocrystals (CNCs) in polar media based on polyethylene glycol (PEG) was investigated from aqueous suspensions to nanocomposites. The aim of this work is to improve our knowledge on the CNC behavior in polymer media and develop rheological indices to characterize the dispersion of nanoparticles in polymer matrices. CNCs were obtained from sulfuric acid hydrolysis of wood pulp and supplied after a spray- or freeze-drying process. Ultrasonication was used to break agglomerates and disperse CNCs in aqueous suspensions before mixing with an aqueous PEG solution at room temperature. The samples were subsequently dried and compression molded. From capillary and oscillatory shear rheology, no adsorption of PEG chains on CNCs could be detected, as many had previously hypothesized. The increase of PEG concentration in aqueous suspension favored the gelation by depletion effect and suggested CNC orientation. Viscoelastic properties and transmission electronic images of PEG/CNC nanocomposites highlighted the formation of a percolated network of CNCs for low concentrations 0.15 vol%. From Shih et al.’s model, a fractal dimension of 2 was obtained for these percolated nanocomposites, suggesting a 2D network of CNCs in the PEG matrix.
Keywords: cellulose nanocrystals, polyethylene glycol, apparent yield stress,
1. Introduction
Over the last decades, the interest for carbon [1,2], clay [3] and cellulosic [4] nanoparticle-based composites has been growing. Due to their natural abundance, biodegradability, optical properties, high stiffness and low density [5,6], cellulose nanocrystals (CNCs) have a potential for the reinforcement of thermoplastic matrices [7]. Polar CNCs are usually produced by sulfuric acid hydrolysis of wood pulp [8], followed by freeze-drying or spray-drying [9]. These drying processes, essential to store and commercialize CNCs [6], cause a strong agglomeration [10], which are then difficult to redisperse using conventional melt mixing methods, especially in non-polar thermoplastics [11]. Despite higher costs, solution mixing allows for well-dispersed nanocomposites [12–17] and could potentially be performed directly during the aqueous hydrolysis phase. The structure of CNCs in various media is still misunderstood. Agglomerates can be broken by the ultrasonication of CNC aqueous suspensions to achieve nanodispersion [18].
Polyethylene oxide (PEO) or glycol (PEG) (depending on molar weight) is a water-soluble biocompatible polymer used in biomedical applications [19]. Since it has a low melting point [20,21], CNC thermal degradation can be avoided when preparing composites in the molten state [22]. In fact, PEG/CNC may be considered as a model system to improve our knowledge of the behavior of CNCs in the presence of polymers [23], from aqueous suspensions to composites. The development of thermodynamic, structural and rheological methods for optimal dispersion of CNCs will be useful for future CNC applications. Moreover, the role of PEG in CNC colloidal aqueous suspensions is very important for hydrogel production [24] or fiber electrospinning [25]. Previous studies showed that PEG did not adsorb on cellulosic fibers [26] or microcrystals [27]. However, while some authors suggest the adsorption of PEG on CNC surfaces [28–30], their results seem to be incompatible with an adsorption mechanism [31,32]. Generally, polymer adsorption on CNC surfaces leads to a gelation at both low polymer and CNC concentrations, often associated with a bridging effect [31,33], while a slow flocculation by depletion is usually observed for non-adsorbed polymers [34]. The rheological behavior of CNC suspensions in polymeric media is controlled by the
morphology of nanoparticles and nanocomposite structure. Rheology is a useful tool to investigate the phenomena involved during the elaboration steps (from aqueous suspensions to molten composites).
The rheological properties of CNC water suspensions have been heavily investigated [18,35,36]. However, the rheological behavior of CNCs in thermoplastics [37], often prepared via solvent mixing, still needs clarification. Favier et al. [38] first showed a percolation network between tunicate CNCs that occurred at a critical volume fraction of 1 vol% in a styrene-butyl acrylate copolymer. Later, Tin et al. [39] observed a solid-like behavior at low frequencies for aqueous suspensions above 1 vol% of wood pulp CNCs in polyhydroxalkanoate (PHA). A yield stress related to a CNC percolation network was reported by Bagheriasl et al. [17] for polylactide (PLA)/CNC nanocomposites elaborated by solution mixing at concentrations above ~0.5 vol%. This network was correlated with an improvement of the mechanical properties of the composite [40]. Kamal and Khoshkava [41] obtained similar properties for PLA/2 vol% CNC composites prepared by melt mixing using a unique spray-freeze-drying process to prepare the CNCs. In another study, PEO was used as a compatibilizer in PLA/CNC nanocomposites to improve filler dispersion and decrease the percolation threshold [42]. Finally, Safdari et al. [43] have observed a yield behavior of PEO/cellulose nanofibers (CNFs) around 1 vol% CNFs, a value similar to that reported in the case of a PLA matrix [44].
The aim of this study is to understand via rheology the CNC structuration in the presence of a water-soluble, polar and Newtonian PEG thermoplastic matrix, from aqueous suspensions to composites, used as a model system. The influence of the CNC dispersion state in aqueous suspensions on the final rheological properties of the PEG/CNC composites is investigated for different ultrasonication treatments and two types of CNC (spray or freeze-dried sample). This fundamental step is helpful for the future understanding of new nanocomposites systems, elaborated by melt-mixing with thermoplastic matrices.
2. Materials and methods
Water-soluble polyethylene glycol (PEG) was purchased from Sigma Aldrich (Oakville, Ontario, Canada). From the technical data sheet the PEG density is 1.14 g.cm -3, number average molar weight, Mn, is~ 20,000 g.mol-1 and melting point, Tm, ~ 63-66
°C. Its polydispersity index is estimated to be 1.05, according polydispersity measurements done by Ling et al. [45] for several PEG grades supplied by Sigma Aldrich and Alfa Aesar (Tianjin, China).
CNCs obtained from sulfuric acid hydrolysis of wood pulp [8] followed by neutralization with sodium hydroxide (NaOH) and spray or freeze-drying processes were supplied by CelluForce (Montreal, Canada) and FPInnovations (Pointe Claire, Canada), respectively. The presence of 3.4 sulfate half ester groups O-SO3H per 100
anhydroglucose units on CNC surfaces was determined by X-Ray spectroscopy (EDX) for both spray and freeze-dried CNCs, using a Tabletop Hitachi TM3030+ scanning electron microscope operating at 15 kV. The dimensions of the CNC particles were measured via transmission electronic microscopy (TEM) based on the measurements of at least 100 particles, using a TEM Jeol JEM 2100F bright field imaging, operating at 200 kV. The average length L0, diameter d0 and aspect ratio p0 were 165 nm, 13 nm and 12.5, respectively. The density of CNCs was taken equal to 1.54 g.cm-3.
CNC suspensions with a volume fraction = 3.3 vol% in Milli-Q water (at 18.2 M.cm) were ultrasonicated using a Sonics & Materials VCX500 probe, operating at 20 kHz, using two different power levels P (10 and 50 W), and energy E varying from 5,000 to 10,000 J/gCNC. The volume in the glass container used was ~ 40 mL (2.9 cm height by 2.1 cm radius). The container was placed in an ice bath and the ultrasonication was applied in pulse cycles: 10 s ON / 1 s OFF for P = 10 W, and of 1 s ON / 1 s OFF for P = 50 W, in order to avoid overheating. The intensity weighted mean hydrodynamic diameter (Z-average) of the CNC particles in suspensions was measured for dilute suspensions (0.03, 0.6 and 0.13 vol%) by diffusion light scattering (DLS), using a Malvern Zetasizer Nano-ZS (DTS1070 cell). The average results are reported in Table I. The higher Z-average values for low ultrasonication treatments were mainly attributed to the presence of some large CNC agglomerates with a size of few micrometers,
particularly observed in the case of freeze-dried CNC. However, most particles had a mean hydrodynamic diameter of few tenths of nanometers. The same limit particle size was reached for both spray and freeze-dried CNCs, after an efficient ultrasonication treatment.
TABLE I. Z-average hydrodynamic diameters for CNC aqueous suspensions after different ultrasonication treatments. CNC Power (W) Energy (J/gCNC) Z-average diameter (nm) Spray-dried 10 5,000 115 10,000 75 50 10,000 75 Freeze-dried 10 5,000 145 50 10,000 75
PEG flakes were solubilized in Milli-Q water for 30 min at 400 rpm under magnetic stirring at 50 °C. Then, the CNC suspensions were mixed using a magnetic stirrer for 30 min at 400 rpm at room temperature with PEG aqueous solutions to obtain suspensions with a final CNC volume fraction ranging from 0 to 2 vol% and containing 0, 20, 30 and 40 wt% PEG with respect to water and PEG. Finally, to obtain PEG composites with CNC concentrations ranging from 0 to 3.8 vol%, samples were dried under vacuum at T = 50 °C for 48 h and compression molded at 80 °C for 10 min using a Carver hydraulic press, in order to obtain disk-shaped samples for rheometry. The pressure was increased by steps from 0 to 27.6 MPa in order to avoid air bubbles, and the samples were cooled down to room temperature using a water cooling system.
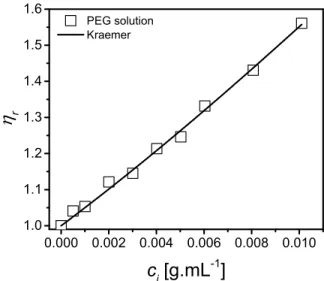
Potential PEG adsorption on CNC was investigated following the method proposed by Lenfant et al. [31] in the case of hydroxyethyl cellulose (HEC). A Cannon Fenske viscometer with a capillary diameter of 50 µm was used. A calibration curve of the PEG solution relative viscosity r as a function of polymer initial concentration ci is plotted, at
T = 25°C, in Fig. 1. The solution flow times are ranging from 195 to 305 s for Milli-Q
water and ci = 0.01 g.mL-1 PEG solution, respectively. The data were fitted using the
2 2 ) 2 1 ( lnr ci kH ci (1) where [] is the intrinsic viscosity and the Huggins constant kH = 0.54 [47]. The intrinsic viscosity [] was determined to be ~ 45 mL.g-1 for PEG in water at T = 25°C, similar tothe value obtained by Shulyak et al. [48] and corresponding to c* ~ 1/[] ~ 0.022 g.mL-1,
which characterizes the limiting concentration for the dilute regime. The Mark–Houwink relation [] = KMvwas used to determine the viscosity-average molar weight Mv ~ 23,000 g.mol-1, considering K
= 4.40×10⁻² mL.g-1 and = 0.69 [48], close to the number average molar weight Mn given by the supplier (20,000 g.mol-1).
0.000 0.002 0.004 0.006 0.008 0.010 1.0 1.1 1.2 1.3 1.4 1.5 1.6 PEG solution Kraemer r ci [g.mL-1]
FIG. 1. Relative viscosity r as function of concentration ci for water/PEG solutions. The line corresponds
to the fit of the Kraemer equation.
A spray-dried CNC suspension with = 3.3 vol% was ultrasonicated at P = 50 W and E = 10,000 J/gCNC. Then, sixteen (16) suspensions were prepared as described previously with a CNC volume fraction ranging from 0 to 0.65 vol% and PEG concentration ci ranging from 0.005 to 0.01 g.mL-1 and corresponding to the dilute
regime. The suspensions were allowed to rest at room temperature for 24 h. Then, CaCl2
up to a concentration of 100 mM was added to the suspensions in order to precipitate the CNCs and trap the absorbed polymer chains, with the assumption that the salt addition does not disturb the polymer adsorption phenomenon [31]. The suspensions were then centrifuged for 20 min at 13,000 rpm. We note that the centrifugation of CNC
suspensions without CaCl2 addition did not allow for phase separation. Finally, the
supernatant containing the non-adsorbed PEG was extracted and its flow time was measured using a Cannon Fenske viscometer to determine the final polymer concentration, cf, using the calibration curve (Fig. 1). The adsorbed PEG concentration ci – cf was determined and converted into ads as mg of adsorbed PEG per g of CNC.
For CNC suspensions in aqueous PEG solutions, the rheological tests were performed using a controlled stress Anton Paar MCR502 rheometer (equipped with a double-wall Couette geometry), after a pre-shear at 100 s-1 over 100 s followed by a rest
time of 180 s, to obtain a comparable initial state. Frequency sweep tests, with frequency
ranging from 100 to 10-2 rad.s-1, at a strain amplitude within the linear viscoelastic
regime, and shear rate tests, ranging from 0.5 s-1 500 s-1, were performed. Time sweep
measurements in the linear domain were done at = 5 rad.s-1 for CNC suspensions in
aqueous PEG solutions with = 2 vol% for 10 h.
For PEG/CNC composites, oscillatory shear measurements were performed on disk shape samples dried under vacuum for 24 h at T = 50°C using a controlled stress Anton Paar MCR301 rheometer equipped with a parallel plate geometry with a diameter of 25 mm and a gap of 1 mm. The rheological tests were carried out under air, in the molten state at 80 °C, for spray and freeze-dried CNC-based PEG composites with a CNC volume fraction ranging from 0 to 3.8 vol%, previously ultrasonicated following different treatments (Table I). Time sweep measurement showed that the viscoelastic properties of PEG and PEG/CNC composites (= 3.8 volwere stable at T = 80 °C for 4 h (results not shown). Strain sweep tests, with strain amplitude ranging from 0.0001 to 1, at = 10 rad.s-1 and frequency sweep tests, ranging from 100 to 10-2 rad.s-1, in the
linear domain, were conducted at T = 80 °C without pre-shearing to preserve the initial CNC structure. All rheological data were reproducible to ± 10%.
TEM images of CNC in the PEG matrix were taken using a bright field imaging Jeol JEM 2100F, operating at 200 kV. Because the crumbling characteristics of PEG/CNC composites did not allow the use of an ultracryomicrotome after compression
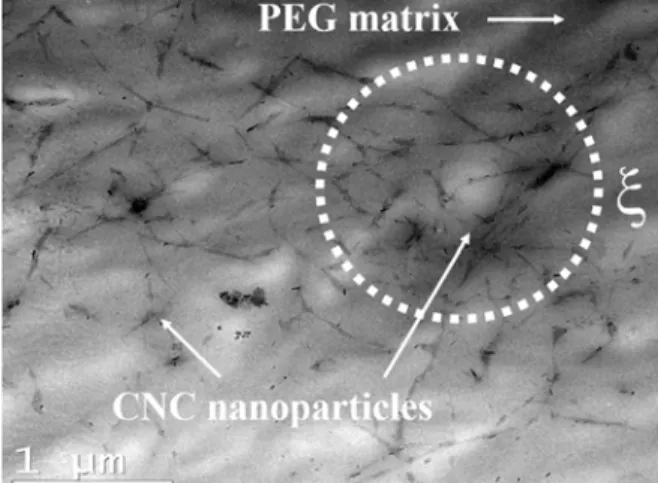
molding, the initial CNC suspension with = 0.07 vol% CNCs (or 0.2 vol% relative to PEG) and 40 wt% PEG was diluted one hundred times with Milli-Q water, in order to obtain a thin film of PEG/CNC composite. A droplet of this suspension was dried to eliminate water, at room temperature on TEM grids for 30 min before observation. Fig. 2 presents the TEM image of that PEG/0.2 vol% spray-dried CNC nanocomposite initially ultrasonicated at P = 50 W and E = 10,000 J/gCNC. This image shows the percolation
between CNC nanoparticles, at this concentration ( ~ 0.2 vol%), in micron size flocs (, drawn as illustrative) usually observed in the case of colloidal gels [49].
FIG. 2. TEM image of a PEG/0.2 vol% spray-dried CNC nanocomposite.
3. Results and discussion
3.1 Role of PEG in CNC aqueous suspensions
In this part concerning the role of PEG in CNC aqueous suspension, the tests were carried out after the ultrasonication of spray-dried CNC water suspension at P = 50 W and E = 10,000 J/gCNC.
The possible adsorption phenomenon of PEG on CNC surface is compared to that observed by Lenfant et al. for HEC [31]. The theoretical maximum adsorption of PEG on
CNC surface, ads max ~ 250 mg/g, was estimated using the relation proposed by van de Ven [50], based on geometrical parameters of PEG chains and CNC surface:
max 2 v ads c A M A k N a (2)
where kc = 0.55 for random coverage, Mv = 23,000 g.mol-1 is the viscosity-average molar
weight (calculated from the relative viscosity, Fig. 1), NA the Avogadro number (Mv /NA represents the mass of a single polymer chain), A = 250 m2/g [51], the specific surface
area of CNCs, and a = a(N/6)1/2, the gyration radius of PEG chains for which the
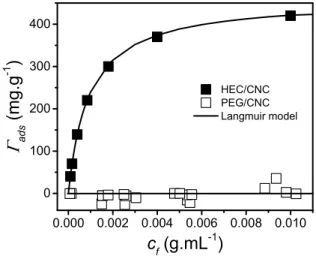
monomer length is a = 0.297 nm, and the degree of polymerization N ~ 450. In the case of HEC, this relation gives ads max ~ 300 mg/g, in the same order of magnitude as the maximum adsorption plateau value measured by viscometry, i.e. ads max ~ 400 mg/g [31]. Fig. 3 presents the adsorption isotherms of PEG and HEC on CNCs, ads, as a function of the final polymer concentration, cf. For all PEG samples ads is close to 0, very far from the estimated value of 250 mg/g based on Eq. (2), suggesting that PEG chains do not absorb on CNC surface (assuming that the salt addition did not induce polymer desorption [31]) and confirming the results of a recent study [52]. As reported by Reid et al. [32] the potential hydrogen bonding between the polymer and CNCs does not govern the adsorption in water, in disagreement with Cheng et al.’s [29] suggestion. However, HEC adsorption was clearly demonstrated by Lenfant et al. [31] (Fig. 3).
0.000 0.002 0.004 0.006 0.008 0.010 0 100 200 300 400 HEC/CNC PEG/CNC Langmuir model ads (mg.g -1 ) cf (g.mL-1)
FIG. 3. Isotherm adsorptions ads as function of the concentration cf for PEG and HEC (data of Lenfant et
Non-ionic polymer adsorption on fillers can also be predicted by considering successively the solvent or polymer affinity towards the two other phases. Thermodynamically, polymer adsorption is possible when the entropy loss related to changes in the polymer chain conformation is lower than the enthalpy gain by the system caused by heat release [26]. In other words, polymer adsorption can occur if the affinity between the polymer chains and the filler surface is higher than that between the solvent and the filler surface. We use the method proposed by Sumita et al. [54], widely used in the case of ternary thermoplastic nanocomposites [55], to predict the filler location in emulsions. The first step of the Sumita et al. method considers the dispersive d and polar
p components of the surface tensions to determine the interfacial tension between two compounds (1 and 2) using the Wu’s harmonic mean average equation [56]:
p p d d 2 1 2 1 2 1 2 1 2 2 (3)
Using these interfacial tensions, the wetting coefficient a can be determined to quantify the affinity of one component, called C, towards two others called A and B:
B A A C B C a (4)
If -1 < a < 1, the component C is preferentially located at the interface between A and B while when a < -1 and a > 1, the affinity of C towards B or A is larger, respectively. An adsorption parameter X can be estimated from the difference between the wetting coefficient of C with the solvent aS, and that with the polymer, aP (for X > 0, the affinity between the polymer and the filler surface is higher than that between the solvent and the filler surface). Table II presents the dispersive d and polar p contributions of the surface tensions , of water, polyethylene glycol (PEG), hydroxyethyl cellulose (HEC) and CNC taken from the literature. Using Eq. (3), the interfacial tensions water-PEG, water-CNC andPEG-CNC are respectively equal to 14.06, 6.40
and 3.98 mJ.m-2, leading to aS = -1.92 and aP = -1.57 for PEG (Eq. (4)). The adsorption
parameter X = - 0.35 (< 0,) suggests that the PEG chain adsorption on CNCs seems not to be favored thermodynamically. For HEC, same calculation leads to X = 1.96 (> 0),
suggesting a possible polymer adsorption on CNC surface. These results confirm that PEG would not absorb on CNC surface, whereas adsorption would be important in the case of HEC. Let us note that using the surface tension of polyvinyl alcohol (PVA) [57] and dextran [58], this approach predicts their respective adsorption and non-adsorption on CNCs, in agreement with demonstrations in the literature [33,59].
TABLE II. Dispersive d and polar p components of the surface tensions of components at room
temperature. d (mJ/m2) p (mJ/m2) (mJ/m2) Water [60] 21.8 51.0 72.8 PEG [61] 30.6 12.2 42.8 HEC [62] 25.6 36.9 62.5 CNC [51] 40.9 28.0 68.9
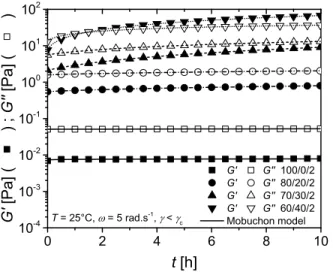
Fig. 4 presents the variation of the elastic G’ and loss G’’ moduli as functions of time for the spray-dried CNC suspensions without and with the addition of 20, 30 and 40 wt% PEG in water for CNC = 2 vol%, in the linear domain over 10 h.
0 2 4 6 8 10 10-4 10-3 10-2 10-1 100 101 102 T = 25°C, = 5 rad.s-1, < c G' G'' 100/0/2 G' G'' 80/20/2 G' G'' 70/30/2 G' G'' 60/40/2 Mobuchon model G' [Pa] ( ) ; G' ' [P a] ( ) t [h]
FIG. 4. Time sweeps for water/PEG/CNC suspensions with = 2 vol%. Lines correspond to the Mobuchon model fits [63].
For the suspensions in the PEG solutions, we observed increases of the moduli over time. These increases can be described by the empirical model proposed by Mobuchon et
al. [63], adapted from Dullaert and Mewis [64]:
'( ) ' ( ' ' ) 1 exp ' m i i b t G t G G G (5)
where G’i, G’∞ are respectively the initial and final storage modulus at t = 0 and t tending
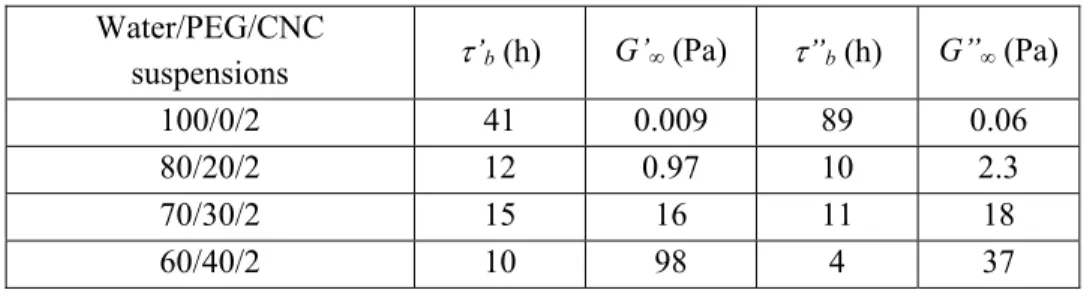
towards infinity, and 'b and m are a characteristic time of the structure build-up and a stretching exponent, respectively. The same equation (Eq. (5)) was used for the loss modulus G” and taking the stretching exponent equal to 1 (a value close to 1 was obtained for all suspensions leaving this parameter free in a first fit, according to the same overall shape of time sweeps), the values for ’b, ’’b, G’∞ and G”∞ obtained by the best fits of the curves of Fig. 4 are given in Table III. The increases of G’ and G” as functions of time are larger as the PEG concentration increases. A cross-over point between G’ and G” is clearly observed after about 1 h for the aqueous suspension containing 40 wt% PEG ( = 2 vol%), and G’∞ is larger than G”∞ (Table III), suggesting a gel structure. For the lower PEG concentrations ( = 2 vol%), G’∞ < G”∞ but the
difference between these two values is reduced as the PEG concentration increases. The characteristic times ’b and ’’b decrease overall, respectively from ~ 41 h to ~ 10 h and from 89 h to 4 h, by increasing PEG concentration from 0 to 40 wt%, suggesting that PEG accelerates CNC structuration by favoring percolation. These characteristic times should be identical for G’ and G” but due to the empirical nature of this model these values need to be discussed with caution. The non-adsorbed PEG chains reduce the electrostatic repulsion due to depletion forces and a structure built-up occurs by flocculation, as reported by Lenfant et al. [65] in the case of an electrostatic repulsion screening by sodium chloride. Moreover, the excluded volume caused by PEG chains probably reduces the distance between CNCs by steric effect.
TABLE III. Fitted parameters ’b, ”b,G’∞ and G”∞ , for CNC suspensions at = 2 vol%. Water/PEG/CNC
suspensions ’b (h) G’∞ (Pa) ”b (h) G”∞ (Pa)
100/0/2 41 0.009 89 0.06
80/20/2 12 0.97 10 2.3
70/30/2 15 16 11 18
60/40/2 10 98 4 37
In order to understand the role of PEG in the first minutes of the composite preparation, viscoelastic properties of the suspensions were measured directly after solution mixing, without excluding a variation of the rheological properties during the maximum 30 minutes of each test (Fig. 4), especially for highly concentrated systems in both PEG (30 and 40 wt%) and CNC (2 vol%). Fig. 5 presents the elastic G’ and loss G’’ moduli (a and c) and the complex * and shear viscosities (b and d) as functions of angular frequency or shear rate for spray-dried CNC suspensions, without (a and b) and with the addition of 30 wt% PEG (c and d) in water for ranging from 0 to 2 vol%. No significant elastic modulus could be measured in the case of CNC water suspensions (Fig. 5(a)), and for all CNC polymeric suspensions (Fig. 5(c)), G” is higher than G’, characterizing a liquid-like behavior. The addition of PEG and CNC increases the viscoelastic properties of suspensions. Except for the suspension containing 30 wt% PEG and 2 vol% CNC, where a strong structure builds-up, G’ and G” exhibit, respectively, a slope of 1 and 2 in the terminal zone, in agreement with the Newtonian plateau shown in Figs. 5(b) and 5(d). The Cox-Merz rule () = () is valid for all suspensions in Fig. 5, suggesting a weak structure [18]. At high frequencies and shear rates, shear thinning is observed above a critical shear rate c (Fig. 5(b) and 5(d)), due to the orientation of CNCs in the flow direction, corresponding to the rotational Péclet number [66], Perot = 1, characterizing the limit of the flow being dominated by Brownian motion and hydrodynamic forces. The critical shear rate c decreases as the PEG concentration increases, due to the increase of the solution viscosity. At low frequencies and shear rates, a Newtonian plateau 0 is observed for all suspensions. This result suggests that there is no polymer adsorption and bridging effect between CNCs, contrary to the fast gelation highlighted in the case of adsorbed polymers [31,33] at very low concentrations
of both CNC and polymer (~ 0.2 wt%), and in agreement with the adsorption isotherms of Fig. 3. Oguzlu and Boluk [30] did not observe CNC gelation with the addition of polyethylene oxide (PEO) in aqueous suspensions, but nevertheless attributed the increased rheological properties to PEO adsorbed on CNCs, which would increase steric repulsion between CNCs. However, a conventional colloidal electrostability of CNC aqueous suspensions containing non-adsorbed polymer would seems a more appropriate mechanism. 10-2 10-1 100 101 102 10-3 10-2 10-1 100 101 T = 25°C G' [Pa] ( ) ; G' ' [P a] ( ) [rad.s-1] a) 1 100/0 0% 0.7% 1.3% 2% 10-2 10-1 100 101 102 10-3 10-2 10-1 100 . b) * [Pa. s] ( ) ; [Pa. s] ( ) [rad.s-1] ; [s-1] T = 25°C . o c 100/0 0% 0.7% 1.3% 2% 10-2 10-1 100 101 102 10-3 10-2 10-1 100 101 0% 0.7% 1.4% 2% 70/30 T = 25°C G' [Pa] ( ) ; G' ' [P a] ( ) [rad.s-1] 2 1 c) 10-2 10-1 100 101 102 10-1 100 101 102 . * [Pa .s] ( ) ; [Pa. s] ( ) d) T = 25°C [rad.s-1] ; [s-1] [rad.s-1] ; [s-1] 70/30 0% 0.7% 1.4% 2%
FIG. 5. Elastic G’ (filled symbols) and loss G” (open symbols) moduli (a, c), complex * (filled symbols)
and shear (open symbols) viscosities (b, d) as functions of angular frequency and shear rate for spray-dried CNC suspensions without PEG (a, b) and with 30 wt% (c, d) in water.
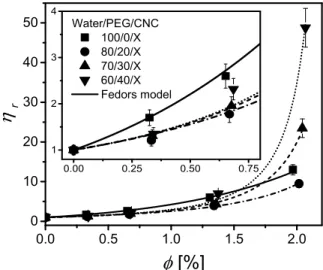
For all spray-dried CNC suspensions, without and with the addition of 20, 30 and 40 wt% PEG in water, the relative viscosity r is plotted as a function of CNC volume fraction in Fig. 6. The relative viscosity is defined as the ratio of the Newtonian viscosity of the filled suspension to that of the unfilled suspending medium,
0.0 0.5 1.0 1.5 2.0 0 10 20 30 40 50 0.00 0.25 0.50 0.75 1 2 3 4 Water/PEG/CNC 100/0/X 80/20/X 70/30/X 60/40/X Fedors model r [%]
FIG. 6. Relative viscosity r as a function of volume fraction for the CNC suspensions in PEG aqueous
solutions. Lines correspond to the Fedors model fits.
The Fedors model [67], widely used in the case of dilute and semi-dilute CNC suspensions [68], has been used to fit the experimental data of Fig. 6. It is expressed by:
r m 1 1 ) 1 ( 2 1 (6)In the literature m is usually called maximum packing density or fraction [35]; it is the concentration at which jamming occurs. The theoretical maximum packing fraction was estimated for rigid, non-interactive hexagonally packed cylindrical rods to be close to 90 vol% [69], which is much larger than the maximum packing fractions reported in Table IV. [] is the intrinsic viscosity, which is equal to the sum of the rigid body []0 and the electroviscous []el contributions of CNC particles [68]. The Simha relation [70] validated for CNC nanorods [36] is used to determine the rigid body contribution:
) 5 . 0 2 (ln 5 ) 5 . 1 2 (ln 15 15 14 2 2 0 p p p p (7)Taking the aspect ratio p = 12.5 as previously determined by TEM, []0 = 18.5. The values of m, [], []0 and []el are listed in Table IV for all suspensions. As expected, r increases with up to a maximum volume fraction m where r tends towards infinity. When the viscoelastic properties are quasi-independent of time, i.e. for low CNC concentrations, the addition of PEG leads to a less intense increase of r at low (insert Fig. 6), due to less electrostatic repulsion between CNCs, highlighted by the decrease of []el (Table 4). On the other hand, m decreases with PEG concentration, suggesting that the PEG favors gelation between CNCs due to a depletion effect.
TABLE IV. Maximum packing volume fraction m, intrinsic viscosity [] and its rigid body []0 and
electroviscous []elcontributions for water/PEG/CNC suspensions. Water/PEG/CNC suspensions m (vol%) [] []0 []el 100/0/x 6.5 180 18.5 161.5 80/20/x 3.4 85 66.5 70/30/x 2.7 60/40/x 2.4
3.2 CNC network characterization in PEG thermoplastic matrix
In this section, the rheological behavior of PEG/spray and freeze-dried CNC nanocomposites is investigated, for different ultrasonication treatments of the precursor CNC aqueous suspensions (Table I), in order to develop rheological tools for indirect structural characterization of CNC composites based on molten polymers. Fig. 7 presents, as an example, a strain sweep test for the 2.2 vol% spray-dried CNCs in molten PEG at 80 °C, after an initial ultrasonication of the CNC aqueous suspension at P = 50 W and E = 10,000 J/gCNC. Galindo-Rosales et al. [71] demonstrated that, above the percolation threshold, the ratio between the elastic modulus plateau G’p and the maximum loss modulus value G” max can be used as a criterion for the dispersion quality of the sample. This ratio characterizes the strength of the network at rest [72]. Even if for freeze-dried
and spray-dried CNC, both G’p and G” max are generally larger after a strong ultrasonication treatment (E = 10,000 J/gCNC) than those after a weak ultrasonication treatment (E = 5,000 J/gCNC), in agreement with the Z-average hydrodynamic diameter measurements (Table I), the ratio G’p/G” max is similar for each fraction (for example, close to 3.5 for = 2.2 vol%), i.e. unchanged by the severity of the ultrasonic treatment, which clearly affects the dispersion of the CNCs. If the plateau values at low strains (G’p and G”p) were related to the floc network reorganization before rupture, G” max was
associated to conformation changes of agglomerates [73]. The strong interactions linking the CNC particles in agglomerates could prevent their rearrangement and could not discriminate the dispersion state refinement obtained after breaking agglomerates. Hence, the method proposed by Rosales et al. [71] is not conclusive to differentiate the dispersion quality of our PEG/CNC systems containing only a few large agglomerates.
10-2 10-1 100 101 102 104 105 c G'' max Gp' T = 80°C ; = 10 rad.s-1 G' G'' 2.2% G' [P a] ( ) ; G' ' [Pa ] ( ) [%]
FIG. 7. Elastic G’ (filled symbols) and loss G” (open symbols) moduli as a function of strain for a PEG/2.2 vol% spray-dried CNC nanocomposite.
It is also possible to consider the critical strain and the apparent yield stress as criteria for the dispersion state of CNC in PEG. Strain sweep measurements were used to plot the variations of the critical strain c, determined by the tangent method (as shown in Fig. 7) for the elastic modulus G’, as a function of volume fraction for PEG/spray-dried and freeze-dried CNC nanocomposites (Fig. 8). The critical strain values c are about independent of the CNC used (spray-dried or freeze-dried) and the ultrasonication treatment applied within the range studied. We note that the determination of precise c
values is difficult to highlight the different dispersion states of CNCs in PEG following ultrasonication treatments. For all nanocomposites, c decreases with the volume fraction
following a power-law expression with an exponent equal to -0.8 ( 0.8
c
). A slope of -2 was determined from Kamal and Khoshkava’s data [41] for PLA/CNC composites prepared by melt mixing. In the case of polyamide composites filled with mineral platelets, a slope of -2 was measured for micrometric talc [74] while a slope of -1 was reported for nanometric organically modified montmorillonite [74,75], hinting at the nanodispersion of CNCs in PEG-based composites elaborated by solution mixing.. Moreover, such viscoelastic non-linearities (Fig. 8) appear at lower volume fractions than those reported in the literature for PLA [40]. These results could be explained by the particle relative degree of dispersion state in the thermoplastic matrix, along with the affinity between CNC and the polymer, as observed by Beuguel et al. [74] in the case of PA/clay microcomposites and nanocomposites (with different values for the PA polarity and particle aspect ratio).
0.1 1 100 101 Spray dried P = 10 W ; E = 5,000 J/gCNC Spray dried P = 10 W ; E = 10,000 J/gCNC Spray dried P = 50 W ; E = 10,000 J/gCNC Freeze dried P = 10 W ; E = 5,000 J/gCNC Freeze dried P = 50 W ; E = 10,000 J/gCNC c [%] [%] -0.8
FIG. 8. Critical strain c as a function of volume fraction for PEG/spray-dried and freeze-dried CNC
nanocomposites.
Fig. 9 presents the variations of the elastic G’ (a) and loss G” (b) moduli as functions of angular frequency, in the linear viscoelastic domain < c, for various contents of spray-dried CNCs in nanocomposites, initially sonicated at P = 50 W and E = 10, 000 J/ gCNC. The behavior of other samples is similar. The elastic G’ and loss G”
matrix, respectively. For ≥ 0.15 vol%, the rheological behavior of PEG/CNC nanocomposites shows an elastic plateau modulus G’0, higher than the loss modulus G”0, indicating a gel behavior attributed to the percolation network between CNC, as observed in Fig. 2. These plateau moduli increase of about 3 decades for a volume fraction up to 3.8 vol%. 10-2 10-1 100 101 102 10-1 100 101 102 103 104 105 106 107 G' 0 a) PEG 0.04% 0.07% 0.15% 0.22% 0.4% 0.7% 1.5% 2.2% 3.8% G' [P a] [rad.s-1] T = 80°C ; < c 2 10-2 10-1 100 101 102 10-1 100 101 102 103 104 105 106 107 b) G'' 0 G'' [P a] [rad.s-1] 1 T = 80°C ; < c
FIG. 9. Elastic G’ (a, filled symbols) and loss G’’ (b, open symbols) moduli as functions of angular frequency for PEG/spray-dried CNC nanocomposites.
Figs. 10(a) and 10(b) report the complex viscosity * as a function of the complex modulus G*, in linear domain < c, for PEG/spray-dried (a) and freeze-dried CNC (b) nanocomposites after different initial ultrasonication treatments.
101 102 103 104 105 106 101 102 103 104 105 106 107 108 a) P = 10 W; E = 5,000 J/gCNC P = 50 W; E =10,000 J/gCNC PEG 0.04% 0.07% 0.15% 0.22% 0.4% 0.7% 1.5% 2.2% 3.8% Herschel-Bulkley * [Pa.s ] G* [Pa] T = 80 °C ; < c 101 102 103 104 105 106 101 102 103 104 105 106 107 108 b) * [P a. s] G* [Pa] P = 10 W; E = 5,000 J/gCNC P = 50 W; E =10,000 J/gCNC T = 80 °C ; < c
FIG. 10. Complex viscosity * as a function of complex modulus G* for PEG/spray-dried (a) and
freeze-dried (b) CNC nanocomposites. Filled symbols represent data for P = 10 W and open symbols those for P= 50 W; lines correspond to the Herschel-Bulkley model fits.
The experimental data are fitted with the modified Herschel-Bulkley model: 1 0 * 0 * G k(
)n
(8)where the power-law index, n, was taken equal to 1 because PEG exhibits a Newtonian behavior over the entire frequency range studied (Fig. 9). Parameters G*0, , k and 0 are the complex modulus plateau at low frequencies, the angular frequency, the consistency index and the strain amplitude at which the tests were performed, respectively.
For an equivalent volume fraction , the data corresponding to nanocomposites obtained after a strong ultrasonication (open symbols) are overall above those measured after a weaker ultrasonication (filled symbols), for both spray and freeze-dried systems, in agreement with the Z-average hydrodynamic diameter measurements (Table I) and the presence of agglomerates at the lower ultrasonication energy (E = 5,000 J/gCNC). No significant apparent yield stress could be determined for suspensions containing less than 0.15 vol%, which corresponds to the percolation threshold (Fig. 2), c. This value is considerably lower than those reported for PLA/CNC composites (c ~ 0.5 - 2 vol%) [17,41] or polycarbonate/carbon nanotubes (PC/CNT) (c ~ 0.45) [76]. Above c, the percolated network induces a yield behavior at low frequencies, characterized by an apparent yield stress defined by 0* = G0* c.
Fig. 11 presents the variation of the apparent yield stress 0* as a function of volume fraction for PEG/spray-dried (a) and freeze-dried CNC (b) nanocomposites for different initial ultrasonication treatments. The solid and dotted lines are best fits of power-law expressions,0*1.8, for the ultrasonic treatment at 5,000 and 10,000 J/gCNC,
respectively. Overall, the apparent yield stress values 0* are higher for the PEG/CNC
nanocomposites prepared after a strong ultrasonication treatment (E = 10,000 J/gCNC), corresponding to well-dispersed systems. The presence of some remaining agglomerates for the lower ultrasonicated composites (E = 5,000 J/gCNC) shifts the curve towards higher volume fractions, especially for PEG/freeze-dried CNC containing larger agglomerates (Table I). The presence of agglomerates seems to delay, in terms of volume fraction ,
the percolation threshold. More specifically, we need to add 25% (Fig. 11(a)) and 50% (Fig. 11(b)) more CNCs, respectively, in the case of PEG/CNC spray and freeze-dried CNC containing agglomerates, to obtain a nanocomposite with an equivalent yield stress. The apparent yield stress values are similar for well dispersed spray-dried and freeze-dried CNC nanocomposites and 0* increases as a function of with a power-law exponent n of 1.8, which is much smaller than the value of 6.3 reported by Kamal and Khoshkava [41] for PLA/CNC composites prepared by melt mixing. However, it is close to those calculated by Bagheriasl et al. [17] for PLA/CNC nanocomposites elaborated by solution mixing (exponent of 2.6), by Aubry et al. [75] and by Rahatekar et al. [77] (modeled by Bounoua et al. [78]) for PA/OMMT and epoxy/CNT nanocomposites, respectively (exponent of 2). Furthermore the percolation threshold, c, is much smaller for PEG/CNC nanocomposites (~ 0.15 vol%) than for PLA/CNC nanocomposites (0.5 and 2 vol%) [17,41]. Beyond the probably better nanodispersion state achieved via a good solvent solution mixing method in water and an efficient ultrasonication treatment, this lower threshold could be partially explained by the better affinity between the matrix and the filler [72], as suggested by the lower interfacial tension PEG-CNC = 3.98 mJ/m2
(Eq. (3) and Table II) compared to PLA-CNC = 6.38 mJ/m2 (using the surface tension of PLA reported by Khoskava [51]).
0.1 1 100 101 102 103 104 a) Spray dried P = 10 W; E = 5,000 J /gCNC Spray dried P = 10 W; E = 10,000 J /gCNC Spray dried P = 50 W; E = 10,000 J /gCNC 0 * [Pa] [%] ~ 1.8 +25% 0.1 1 100 101 102 103 104 b) Freeze dried P = 10 W; E = 5,000 J /gCNC Freeze dried P = 50 W; E = 10,000 J /gCNC 0 * [Pa] [%] ~ 1.8 +50%
FIG. 11. Apparent yield stress 0* as a function of volume fraction for PEG/spray-dried (a) and freeze-dried
The elastic modulus at low frequencies G’0 conveys similar information as the apparent yield stress 0*. It is plotted as a function of volume fraction in Fig. 12 for PEG/spray-dried (a) and freeze-dried CNC (b) nanocomposites after different initial ultrasonication treatments. The elastic modulus plateau G’0 follows a power-law expression with an exponent of 2.7 (G'0 2.7), similar to 2.6 obtained by Abbasi et al. [76] for well dispersed carbon nanotube (CNT) in polycarbonate (PC). As observed for the apparent yield stress 0*, the presence of agglomerates decreases the elastic response of the nanocomposites by trapping a large amount of CNCs that apparently play no significant role on the percolated network structure.
0.1 1 101 102 103 104 105 106 a) +25% Spray dried P = 10 W; E = 5,000 J /gCNC Spray dried P = 10 W; E = 10,000 J /gCNC Spray dried P = 50 W; E = 10,000 J /gCNC G' 0 [P a] [%] 2.7 0.1 1 101 102 103 104 105 106 b) +50% Freeze dried P = 10 W; E = 5,000 J /gCNC Freeze dried P = 50 W; E = 10,000 J /gCNC G' 0 [P a] [%] 2.7
FIG. 12. Elastic modulus plateau G'0 as a function of volume fraction for PEG/spray-dried (a) and
freeze-dried (b) CNC nanocomposites.
Shih et al. [79] proposed a scaling model to determine the fractal dimensions of a colloidal gel floc structure df and of its backbone x. They considered an extremely strong-like gel where the interfloc links are stronger than the intrafloc ones, compared to an extremely weak-like regime where the intrafloc links are stronger than the interfloc ones. The fractal dimensions df and x are related to the power-law expression exponents for c and G as a function of '0 : G A 0 ' (9) and B c (10) where A(dx)/(d df) (11)
and B(1x)/(ddf) (12)
with the Euclidian dimension of the system, d = 3.
As reported above, 2.7 0 ' G and 0.8 c
for the PEG/CNC nanocomposites. Hence, from Eqs. (10) – (13) the fractal dimension characterizing the floc structure is df ~ 2, suggesting a 2-D network (could be imagined as a layer network while it is often considered as 3-D), apparently observed in Fig. 2. This value is similar to those measured by small-angle neutron scattering in the case of CNC hydrogels [80]. It is worth pointing out that compression molding in the molten state of the PEG/CNC composites could modify the image obtained by TEM (Fig.2). However, x is equal to -0.15, which does not make any physical sense. Recently, Wu et al. [49] extended the Shih et al. model and defined a new parameter attributed to a transition (0 < < 1) from extremely strong-like ( = 0) to weak-like ( = 1) gels:
A/(d df) (13)
and B(d 1)/(d df) (14)
where (d 2)(2 x)(1) (15)
They proposed setting the backbone fractal dimension x between 1 and 1.3, as usually reported for colloidal gels. This leads to the same fractal dimension df ~ 2 and the parameter = 0.38 - 0.44 for PEG/CNC nanocomposites, suggesting that the
contribution of interfloc links is slightly more important. Finally, it is worth pointing out that the network characterization described above was performed for a compatible system prepared in favorable solution mixing conditions, and could be affected by the stress applied during subsequent compression molding. Results could be different in the case of composites based on conventional non-polar thermoplastic matrices and prepared from the melt state in extrusion or injection molding.
4 Conclusion
Our rheological data on suspensions of CNCs in aqueous solution of PEG suggest that PEG chains do not absorb on CNCs. Gelation due to depletion forces is the most probable mechanism for aqueous suspensions containing relatively high concentrations of both PEG (40 wt%) and CNC (2 vol%). The intrinsic viscosity values of PEG/CNC aqueous suspensions highlight a decrease of electrostatic repulsion between CNCs with the addition of the polymer. After drying and compression molding, the PEG/CNC model nanocomposites in the molten state show exceptional viscoelastic properties, characterized by apparent yield stress values beyond a percolation threshold volume fraction of 0.15 vol%, in agreement with the network observed by TEM at 0.2 vol%. The critical strain amplitude and the elastic plateau modulus follow, respectively, a power law with an exponent -0.8 and 2.7 as a function of volume fraction, close to the values reported in the literature for well dispersed nanocomposites. The presence of some agglomerates decreases the rheological properties and imposes to add more CNCs in order to obtain similar values (+ 50% in the worst dispersion case studied). However, the percolated network structure governing the rheological behavior is unaffected by the presence of these agglomerates. Finally, the Shih et al. model was used to determine a fractal dimension of 2, suggesting a 2D network of CNCs in the PEG matrix, mainly controlled by interfloc links. This work demonstrates the important potential of bio-based and biodegradable CNCs to reinforce thermoplastic matrices and improve their end-properties. The thermodynamic, structural and rheological tools developed in this work will be helpful for future CNC applications.
5 Acknowledgments
FPInnovations and CelluForce are acknowledged for providing the CNCs. We also thank FPInnovations, NSERC and PRIMA Québec for their financial support. The authors are grateful to Dr. Wadood Hamad of FPInnovations for his helpful suggestions. The authors thank Mr. Philippe Massé for his help with TEM observations. We are grateful to Prof. Daria Camilla Boffito for her help with ultrasonication, Prof. Nick
Virgilio and Prof. Theo van de Ven (U McGill) for their expertise in polymer adsorption and Dr. Gilles Lenfant for his inspiring discussions about rheology of CNC suspensions.
6 References
[1] Thostenson, E. T., Z. Ren, and T.-W. Chou, “Advances in the science and technology of carbon nanotubes and their composites: a review,” Compos. Sci. Technol. 61, 1899–1912 (2001).
[2] Kim, H., A. A. Abdala, and C. W. Macosko, “Graphene/Polymer
Nanocomposites,” Macromolecules 43, 6515–6530 (2010).
[3] Sinha Ray, S., and M. Okamoto, “Polymer/layered silicate nanocomposites: a review from preparation to processing,” Prog. Polym. Sci. 28, 1539–1641 (2003). [4] Moon, R. J., A. Martini, J. Nairn, J. Simonsen, and J. Youngblood, “Cellulose
nanomaterials review: structure, properties and nanocomposites,” Chem. Soc. Rev.
40, 3941 (2011).
[5] Habibi, Y., L. a Lucia, and O. J. Rojas, “Cellulose Nanocrystals: Chemistry, Self-Assembly, and Applications,” Chem. Rev. 110, 3479–3500 (2010).
[6] Hamad, W. Y., “Cellulose Nanocrystals” (John Wiley & Sons, Ltd, Chichester, UK, 2017)
[7] Mariano, M., N. El Kissi, and A. Dufresne, “Cellulose nanocrystals and related nanocomposites: Review of some properties and challenges,” J. Polym. Sci. Part B Polym. Phys. 52, 791–806 (2014).
[8] Brinchi, L., F. Cotana, E. Fortunati, and J. M. Kenny, “Production of nanocrystalline cellulose from lignocellulosic biomass: Technology and applications,” Carbohydr. Polym. 94, 154–169 (2013).
[9] Beck, S., J. Bouchard, and R. Berry, “Dispersibility in Water of Dried Nanocrystalline Cellulose,” Biomacromolecules 13, 1486–1494 (2012).
[10] Khoshkava, V., and M. R. R. Kamal, “Effect of drying conditions on cellulose nanocrystal (CNC) agglomerate porosity and dispersibility in polymer nanocomposites,” Powder Technol. 261, 288–298 (2014).
[11] Sojoudiasli, H., M.-C. Heuzey, and P. J. Carreau, “Mechanical and morphological properties of cellulose nanocrystal-polypropylene composites,” Polym. Compos.
16, 101–113 (2017).
[12] Azizi Samir, M. A. S., F. Alloin, J.-Y. Sanchez, and A. Dufresne, “Cellulose nanocrystals reinforced poly(oxyethylene),” Polymer 45, 4149–4157 (2004).
[13] Ljungberg, N., J. Y. Cavaillé, and L. Heux, “Nanocomposites of isotactic polypropylene reinforced with rod-like cellulose whiskers,” Polymer 47, 6285– 6292 (2006).
[14] Roohani, M., Y. Habibi, N. M. Belgacem, G. Ebrahim, A. N. Karimi, and A. Dufresne, “Cellulose whiskers reinforced polyvinyl alcohol copolymers nanocomposites,” Eur. Polym. J. 44, 2489–2498 (2008).
[15] Kaboorani, A., B. Riedl, P. Blanchet, M. Fellin, O. Hosseinaei, and S. Wang, “Nanocrystalline cellulose (NCC): A renewable nano-material for polyvinyl acetate (PVA) adhesive,” Eur. Polym. J. 48, 1829–1837 (2012).
[16] Xu, X., H. Wang, L. Jiang, X. Wang, S. a Payne, J. Y. Zhu, and R. Li, “Comparison between Cellulose Nanocrystal and Cellulose Nanofibril Reinforced Poly(ethylene oxide) Nanofibers and Their Novel Shish-Kebab-Like Crystalline Structures,” Macromolecules 47, 3409–3416 (2014).
[17] Bagheriasl, D., P. J. Carreau, B. Riedl, C. Dubois, and W. Y. Hamad, “Shear rheology of polylactide (PLA)–cellulose nanocrystal (CNC) nanocomposites,” Cellulose 23, 1885–1897 (2016).
[18] Shafiei-Sabet, S., W. Y. Hamad, and S. G. Hatzikiriakos, “Rheology of Nanocrystalline Cellulose Aqueous Suspensions,” Langmuir 28, 17124–17133 (2012).
[19] Harris, J. M., Poly(Ethylene Glycol) Chemistry: Biotechnical and Biomedical Applications (J. M. Harris, Ed., Springer US, Boston, MA, 1992).
[20] Mark, J. E., Polymer Data Handbook (Oxford University Press, Inc., 1999).
[21] Pielichowski, K., and K. Flejtuch, “Differential scanning calorimetry studies on poly(ethylene glycol) with different molecular weights for thermal energy storage materials,” Polym. Adv. Technol. 13, 690–696 (2002).
[22] Wang, N., E. Ding, and R. Cheng, “Thermal degradation behaviors of spherical cellulose nanocrystals with sulfate groups,” Polymer 48, 3486–3493 (2007).
[23] Gu, M., C. Jiang, D. Liu, N. Prempeh, and I. I. Smalyukh, “Cellulose Nanocrystal/Poly(ethylene glycol) Composite as an Iridescent Coating on Polymer Substrates: Structure-Color and Interface Adhesion,” ACS Appl. Mater. Interfaces
8, 32565–32573 (2016).
[24] Liang, S., J. Wu, H. Tian, L. Zhang, and J. Xu, “High-Strength
Cellulose/Poly(ethylene glycol) Gels,” ChemSusChem 1, 558–563 (2008).
[25] Zhou, C., R. Chu, R. Wu, and Q. Wu, “Electrospun Polyethylene Oxide/Cellulose Nanocrystal Composite Nanofibrous Mats with Homogeneous and Heterogeneous Microstructures,” Biomacromolecules 12, 2617–2625 (2011).
[26] van de Ven, T. G. M., “Kinetic aspects of polymer and polyelectrolyte adsorption on surfaces,” Adv. Colloid Interface Sci. 48, 121–140 (1994).
[27] Gaudreault, R., T. G. M. van de Ven, and M. A. Whitehead, “Mechanisms of flocculation with poly(ethylene oxide) and novel cofactors,” Colloids Surfaces A Physicochem. Eng. Asp. 268, 131–146 (2005).
[28] Ben Azouz, K., E. C. Ramires, W. Van den Fonteyne, N. El Kissi, and A. Dufresne, “Simple Method for the Melt Extrusion of a Cellulose Nanocrystal Reinforced Hydrophobic Polymer,” ACS Macro Lett. 1, 236–240 (2012).
[29] Cheng, D., Y. Wen, L. Wang, X. An, X. Zhu, and Y. Ni, “Adsorption of polyethylene glycol (PEG) onto cellulose nano-crystals to improve its dispersity,” Carbohydr. Polym. 123, 157–163 (2015).
[30] Oguzlu, H., and Y. Boluk, “Interactions between cellulose nanocrystals and anionic and neutral polymers in aqueous solutions,” Cellulose 24, 131–146 (Springer Netherlands, 2017).
[31] Lenfant, G., M.-C. Heuzey, T. G. M. van de Ven, and P. J. Carreau, “Gelation of crystalline nanocellulose in the presence of hydroxyethyl cellulose,” Can. J. Chem. Eng. (2017).
[32] Reid, M. S., M. Villalobos, and E. D. Cranston, “The Role of Hydrogen Bonding in Non-Ionic Polymer Adsorption to Cellulose Nanocrystals and Silica Colloids,”
Curr. Opin. Colloid Interface Sci. 29, 76–82 (2017).
[33] Chen, Y., C. Xu, J. Huang, D. Wu, and Q. Lv, “Rheological properties of nanocrystalline cellulose suspensions,” Carbohydr. Polym. 157, 303–310 (2017). [34] Boluk, Y., L. Zhao, and V. Incani, “Dispersions of Nanocrystalline Cellulose in
Aqueous Polymer Solutions: Structure Formation of Colloidal Rods,” Langmuir
28, 6114–6123 (2012).
[35] Bercea, M., and P. Navard, “Shear Dynamics of Aqueous Suspensions of Cellulose Whiskers,” Macromolecules 33, 6011–6016 (2000).
[36] Boluk, Y., R. Lahiji, L. Zhao, and M. T. McDermott, “Suspension viscosities and shape parameter of cellulose nanocrystals (CNC),” Colloids Surfaces A Physicochem. Eng. Asp. 377, 297–303 (2011).
[37] Ching, Y. C., M. Ershad Ali, L. C. Abdullah, K. W. Choo, Y. C. Kuan, S. J. Julaihi, C. H. Chuah, and N.-S. Liou, “Rheological properties of cellulose nanocrystal-embedded polymer composites: a review,” Cellulose 23, 1011–1030 (2016).
[38] Favier, V., H. Chanzy, and J. Y. Cavaille, “Polymer Nanocomposites Reinforced by Cellulose Whiskers,” Macromolecules 28, 6365–6367 (1995).
[39] Ten, E., D. F. Bahr, B. Li, L. Jiang, and M. P. Wolcott, “Effects of Cellulose Nanowhiskers on Mechanical, Dielectric, and Rheological Properties of Poly(3-hydroxybutyrate- co -3-hydroxyvalerate)/Cellulose Nanowhisker Composites,” Ind. Eng. Chem. Res. 51, 2941–2951 (2012).
[40] Bagheriasl, D., P. J. Carreau, B. Riedl, and C. Dubois, “Enhanced properties of polylactide by incorporating cellulose nanocrystals,” Polym. Compos. 13 (2016). [41] Kamal, M. R., and V. Khoshkava, “Effect of cellulose nanocrystals (CNC) on
rheological and mechanical properties and crystallization behavior of PLA/CNC nanocomposites,” Carbohydr. Polym. 123, 105–114 (2015).
[42] Arias, A., M.-C. Heuzey, M. A. Huneault, G. Ausias, and A. Bendahou, “Enhanced dispersion of cellulose nanocrystals in melt-processed polylactide-based nanocomposites,” Cellulose 22, 483–498 (2015).
[43] Safdari, F., P. J. Carreau, M. C. Heuzey, M. R. Kamal, and M. M. Sain, “Enhanced properties of poly(ethylene oxide)/cellulose nanofiber biocomposites,” Cellulose
24, 755–767 (2017).
[44] Safdari, F., D. Bagheriasl, P. J. Carreau, M. C. Heuzey, and M. R. Kamal, “Rheological, Mechanical, and thermal properties of polylactide/cellulose nanofiber biocomposites,” Polym. Compos. 16, 101–113 (2016).
[45] Ling, K., H. Jiang, and Q. Zhang, “A colorimetric method for the molecular weight determination of polyethylene glycol using gold nanoparticles,” Nanoscale Res. Lett. 8, 538-548 (2013).
[46] Pamies, R. R., J. G. Hernández Cifre, M. del Carmen López Martínez and J. García de la Torre, “Determination of intrinsic viscosities of macromolecules and nanoparticles. Comparison of single-point and dilution procedures,” Colloid Polym. Sci. 286, 1223–1231 (2008).
[47] Brandrup, J., E. H. Immergut, and E. A. Grulke, Polymer Handbook 4th Edition (John Wiley, 1999).
[48] Shulyak, I. V., E. I. Grushova, and a. M. Semenchenko, “Rheological properties of aqueous solutions of polyethylene glycols with various molecular weights,”
Russ. J. Phys. Chem. A 85, 419–422 (2011).
[49] Wu, H., and M. Morbidelli, “Model relating structure of colloidal gels to their elastic properties,” Langmuir 17, 1030–1036 (2001).
[50] van de Ven, T. G. M., “A model for the adsorption of polyelectrolytes on pulp fibers: relation between fiber structure and polyelectrolyte properties.,” Nord. Pulp Pap. Res. J. 15, 494–501 (2000).
[51] Khoshkava, V., and M. R. Kamal, “Effect of Surface Energy on Dispersion and Mechanical Properties of Polymer/Nanocrystalline Cellulose Nanocomposites,” Biomacromolecules 14, 3155–3163 (2013).
[52] Reid, M. S., H. S. Marway, C. Moran-Hidalgo, M. Villalobos, and E. D. Cranston, “Comparison of polyethylene glycol adsorption to nanocellulose versus fumed silica in water,” Cellulose, (2017).
[53] Dang, C. T. Q., Z. J. Chen, N. T. B. Nguyen, W. Bae, and T. H. Phung, “Development of Isotherm Polymer/Surfactant Adsorption Models in Chemical Flooding,” SPE Asia Pacific Oil Gas Conf. Exhib., (2011).
[54] Sumita, M., K. Sakata, S. Asai, K. Miyasaka, and H. Nakagawa, “Dispersion of fillers and the electrical conductivity of polymer blends filled with carbon black,” Polym. Bull. 25, 265–271 (1991).
[55] Beuguel, Q., J. Ville, J. Crepin-Leblond, P. Mederic, and T. Aubry, “Influence of clay mineral structure and polyamide polarity on the structural and morphological properties of clay polypropylene/polyamide nanocomposites,” Appl. Clay Sci. 135, 253–259 (2017).
[56] Wu, S., “Formation of dispersed phase in incompatible polymer blends: Interfacial and rheological effects,” Polym. Eng. Sci. 27, 335–343 (1987).
[57] Guerrouani, N., A. Mas, and F. Schué, “Synthesis of poly(vinyl alcohol) graft -poly(ε-caprolactone) and poly(vinyl alcohol)- graft -poly(lactide) in melt with magnesium hydride as catalyst,” J. Appl. Polym. Sci. 113, 1188–1197 (2009). [58] Van Oss, C. J., Interfacial Forces in Aqueous Media (M. Dekker, New York, NY,
1994).
[59] Edgar, C. D., and D. G. Gray, “Influence of dextran on the phase behavior of suspensions of cellulose nanocrystals,” Macromolecules 35, 7400–7406 (2002). [60] S. Wu, Polymer interface and adhesion (M. Dekker, 1982).
[61] Roe, R.-J., “Surface tension of polymer liquids,” J. Phys. Chem. 72, 2013–2017 (1968).
[62] Carré, A., and K. L. Mittal, Surface and Interfacial Aspects of Cell Adhesion (CRC Press, 2011).
[63] Mobuchon, C., P. J. Carreau, and M.-C. Heuzey, “Effect of flow history on the structure of a non-polar polymer/clay nanocomposite model system,” Rheol. Acta
46, 1045–1056 (2007).
[64] Dullaert, K., and J. Mewis, “Stress jumps on weakly flocculated dispersions: Steady state and transient results,” J. Colloid Interface Sci. 287, 542–551 (2005). [65] Lenfant, G., M.-C. Heuzey, T. G. M. van de Ven, and P. J. Carreau, “A
comparative study of ECNC and CNC suspensions: effect of salt on rheological properties,” Rheol. Acta 56, 51–62 (2017).
[66] Mewis, J., and N. J. Wagner, Introduction to colloid science and rheology (Cambridge University Press, Cambridge, 2011).
[67] Fedors, R. F., “An equation suitable for describing the viscosity of dilute to moderately concentrated polymer solutions,” Polymer 20, 225–228 (1979).
[68] Lenfant, G., M. C. Heuzey, T. G. M. van de Ven, and P. J. Carreau, “Intrinsic viscosity of suspensions of electrosterically stabilized nanocrystals of cellulose,” Cellulose 22, 1109–1122 (2015).
[69] Larson, R. G., “The structure and Rheology of Complex Fluids”, (Oxford University, 1999)
[70] Simha, R., “The Influence of Brownian Movement on the Viscosity of Solutions.,” J. Phys. Chem. 44, 25–34 (1940).
[71] Galindo-Rosales, F. J., P. Moldenaers, and J. Vermant, “Assessment of the dispersion quality in polymer nanocomposites by rheological methods,” Macromol. Mater. Eng. 296, 331–340 (2011).
[72] Majesté, J.-C., Rheology and Processing of Polymer Nanocomposites: Theory, Practice, and New Challenges (John Wiley & Sons, Inc., Hoboken, NJ, 2016). [73] Majesté, J.-C., C. Carrot, B. Olalla, and R. Fulchiron, “Internal reorganization of
agglomerates as an explanation of energy dissipation at very low strain for heterogeneous polymer systems,” Macromol. Theory Simulations 21, 113–119 (2012).
[74] Beuguel, Q., J. Ville, J. Crepin-Leblond, P. Mederic, and T. Aubry, “Comparative study of the structural and rheological properties of PA6 and PA12 based synthetic talc nanocomposites,” Polymer 62, 109–117 (2015).
[75] Aubry, T., T. Razafinimaro, and P. Médéric, “Rheological investigation of the melt state elastic and yield properties of a polyamide-12 layered silicate nanocomposite,” J. Rheol. 49, 425 (2005).
[76] Abbasi, S., P. J. Carreau, A. Derdouri, and M. Moan, “Rheological properties and percolation in suspensions of multiwalled carbon nanotubes in polycarbonate,” Rheol. Acta 48, 943–959 (2009).
[77] Rahatekar, S. S., K. K. Koziol, S. R. Kline, E. K. Hobbie, J. W. Gilman, and A. H. Windle, “Length-dependent mechanics of carbon-nanotube networks,” Adv. Mater. 21, 874–878 (2009).
[78] Bounoua, S., E. Lemaire, J. Férec, G. Ausias, A. Zubarev, and P. Kuzhir, “Apparent yield stress in rigid fibre suspensions: the role of attractive colloidal interactions,” J. Fluid Mech. 802, 611–633 (2016).
[79] Shih, W.-H., W. Y. Shih, S.-I. Kim, J. Liu, and I. A. Aksay, “Scaling behavior of the elastic properties of colloidal gels,” Phys. Rev. A 42, 4772–4779 (1990).
[80] Cherhal, F., F. Cousin, and I. Capron, “Influence of Charge Density and Ionic Strength on the Aggregation Process of Cellulose Nanocrystals in Aqueous Suspension, as Revealed by Small-Angle Neutron Scattering,” Langmuir 31, 5596–5602 (2015).


![TABLE IV. Maximum packing volume fraction m , intrinsic viscosity [] and its rigid body [] 0 and electroviscous [] el contributions for water/PEG/CNC suspensions.](https://thumb-eu.123doks.com/thumbv2/123doknet/8189016.274954/17.918.296.626.514.659/maximum-packing-fraction-intrinsic-viscosity-electroviscous-contributions-suspensions.webp)

