HAL Id: hal-00776444
https://hal.archives-ouvertes.fr/hal-00776444 Submitted on 15 Jan 2013
HAL is a multi-disciplinary open access archive for the deposit and dissemination of sci-entific research documents, whether they are pub-lished or not. The documents may come from teaching and research institutions in France or abroad, or from public or private research centers.
L’archive ouverte pluridisciplinaire HAL, est destinée au dépôt et à la diffusion de documents scientifiques de niveau recherche, publiés ou non, émanant des établissements d’enseignement et de recherche français ou étrangers, des laboratoires publics ou privés.
non-cooperative target recognition
Christian Brousseau
To cite this version:
Christian Brousseau. Development of multiresolution hierarchical trees to non-cooperative target recognition. MTA Review / Military Technical Academy Review, Military Technical Academy Pub-lishing House, 2012, XXII (2), pp.1. �hal-00776444�
1
DEVELOPMENT OF MULTIRESOLUTION HIERARCHICAL
TREES TO NON-COOPERATIVE TARGET RECOGNITION
C
HRISTIANB
ROUSSEAU1Abstract: In this paper, the problem of efficient representation of large
databases of target radar cross sections is investigated in order to minimize memory requirements and recognition search time, using a tree structured hierarchical wavelet representation. Synthetic RCS of large aircrafts, in the HF-VHF bands, are used as experimental data. Hierarchical trees are built using wavelet multiresolution representation and K-means clustering algorithm. The criteria used to define these hierarchical trees are described and the obtained performances are presented.
Keywords: radar, target recognition, multiresolution, wavelet, clustering, hierarchical tree.
1. Introduction
Requirements for future air defense radar systems are detection, localization, but also identification of aircrafts. With the increasing resolution of modern radar systems, it is theoretically possible to store much information, according to aspect, elevation, pulse width, etc., of a complex target and to use them in the field of target recognition.
Advantage of the increasing resolution of radar systems is the opportunity to have more details characteristic of a specific target. Disadvantage is that these detailed characteristics require more and more computer memory to be stored, computer resources and increase the search computational time to NCTR (Non-Cooperative Target Recognition).
It is therefore important to develop efficient methods to decrease the size of representations of high resolution data of radar targets. One way to compress these representations is to use multiresolution signal decomposition allied with data clustering techniques, and then to merge them to build hierarchical tree structured representations to decrease the data size and the number of RCS signature [1-3].
Part of this paper was presented at the 9th
International Conference on Communications, COMM 2012, pp. 51-54, Bucharest, Romania, Jun. 21-23, 2012
1
IETR, Université de Rennes 1, Campus de Beaulieu, 35042, Rennes Cedex, France, e-mail: [email protected]
In this paper, we investigate the problem of efficient representation of large database of radar range profiles in order to minimize memory requirements and recognition search time, using multiresolution wavelet data representations coupled with unsupervised clustering methods, and tree structured hierarchical wavelet representations.
The paper is organized as follows. In a first step, the used synthetic RCS database of large aircrafts is described. In a second step, the identification algorithm and the data processing algorithm used to compare efficiency of the different techniques are presented. In a third step, after a brief review of the wavelet transform theory and the unsupervised clustering algorithms, methods to apply these techniques to radar signal processing and procedures to obtain the compressed database and clusters are described.
Finally, the efficiency of multiresolution representations using wavelet transform, clustering algorithms and multiresolution hierarchical tress are discussed and compared regarding some criteria, like compression scores, probability of false identification and search computational time.
2. Description of Synthetic RCS Database
2.1 Introduction
The synthetic RCS database has been developed during the MOSAR project [4-6] with the support of the French Ministry of Defence (DGA). The objectives of the MOSAR project are to improve knowledge of frequency response of targets in resonance region by measurements, and to test the efficiency of recognition methods. These studies led to:
– Development of a coherent, pulsed, quasi-monostatic, multifrequency, HF-VHF radar using the 20-80 MHz frequency band and the horizontal and vertical polarizations;
– Development and validation of a simulated RCS database using numerical models of aircraft in the 20-80 MHz frequency band;
– Development and the tests of NCTR algorithms.
2.2 Description of synthetic RCS database
To study aircraft RCS, several possibilities exist. One can perform: Anechoic chamber measurements on real aircrafts or scaled models; in-flight measurements with a radar system; Simulations using a computational model.
Anechoic chamber measurements are not well suited to collect data at various angle aspects of a target but they are useful to validate numerical models. To perform in-flight measurements, it is necessary to use a calibrated radar system and to wipe out propagation effects. Simulation of RCS behavior, using a computational model, is a very attractive scheme but the model must be validated.
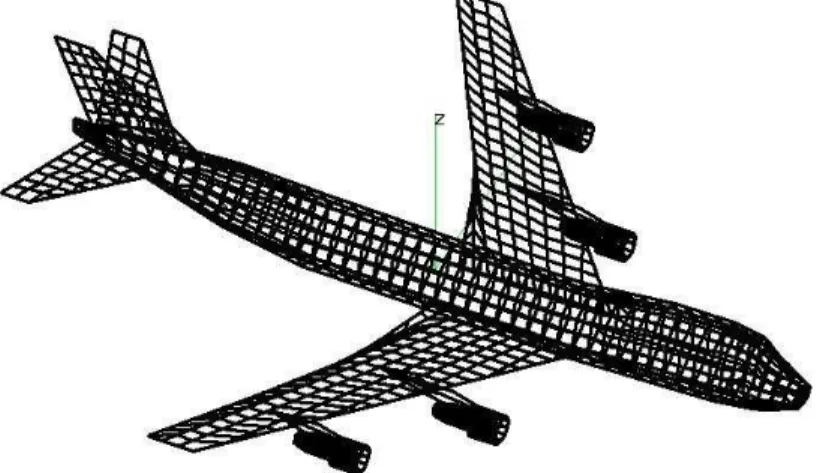
To be able to use a small computer like a PC, the simulation of RCS has been made with the free Numerical Electromagnetic Code NEC2 which is based on the Method of Moments (MoM) [7]. In this case, the aircraft structure is considered as a Perfect Electric Conducting (PEC) body. An example of wiregrid model is presented in Figure 1.
The synthetic database is constituted of eight mid-range airplanes: Airbus A320, BAe 146-200, Boeing 727-200, 737-200, 737-300, 747-200, 757-200 and Fokker 100.
Figure 1. Example of modeling aircraft using a wiregrid model – Boeing 747-200
For each aircraft, RCS has been determined as a function of angle aspect, polarization, and frequency using the following parameters:
– Frequency band: 20 to 100 MHz with a 1 MHz frequency step; – Azimuth angle: 10 to 190 with a step of 2°;
– Elevation angle: 0° to 90° with a step of 1°; – Polarization: HH, HV, VH, VV.
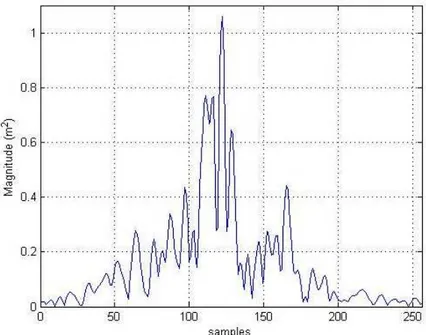
Then, the range profile is estimated using an inverse Fourier transform from the RCS frequency response. The synthetic database is finally constituted of around 300,000 range profiles [6, 8]. Figure 2 shows an example of estimated range profile.
3. Performance Estimation Method
3.1 Introduction
To test the efficiency of database compression, many criteria can be used: – Probability of false classification (Pfc) as a function of Signal to Noise
Ratio (SNR);
– Minimum SNR to obtain a Pfc lower than 1%; – Search computational time (Sct) for a fixed SNR.
3.2 Probability of false classification
Probability of false classification Pfc is defined for M target classes as:
1 1 M i i i m Pfc M n
, (1)where mi is the number of classification error, and ni, the number of element in class i.
The nearest neighbor algorithm [9] is used to recognize the target. It is a simple algorithm and is useful to use it to test the efficiency of database compression using unsupervised clustering algorithm. The distance used to find the nearest neighbor is the Euclidean distance dTk r s, , between the RCS magnitudes: 2 , , , , 1 n k r s k r s T i i T i d A A
, (2)where AT is the magnitude of unknown aircraft T, Ak r s, , , the magnitude of database element (aircraft k, azimuth angle r, elevation angle s), i, the sample number, and n, the number of sample.
Figure 2. Example of estimated range profile – Boeing 747-200 –
HH Polarization – Frequency band: 20-100 MHz
Then, minimal distances to each aircraft are computed and the nearest neighbor kT for the measure T is extracted like:
, ,
, arg min k r s T T r s k k d . (3)3.3 Signal to Noise Ratio
To see the effect of random noise, zero-mean white Gaussian noise has been added to the signal. The Signal to Noise Ratio SNR is defined as:
2 1 10 2 dB 10log N i i s SNR N
, (4)where si is the sampled signal, N, the length of the signal, and 2, the variance of Gaussian noise.
3.4 Search computational time
In computing, to estimate the search computational time (Sct), a standard parameter is the number of MFLOPs. It’s an acronym meaning “Million FLoating point OPerations”. With this parameter, it is very easy to make a comparison between performances of different processing algorithms.
4. Application of Wavelet Transform
to Database Compression
Wavelet transforms have been found useful in a variety of applications. This is because they provide the analyst with an approximation of the signal and a detail of the signal as well. For a complete description of wavelet analysis, the reader should refer to [10, 11]. A brief summary of how the wavelets were used is presented here.
The Discrete Wavelet Transform (DWT) of finite sequences analyzes a signal S by decomposing it into approximation Ai and details Di parts by quadrature filter systems [10, 11], where i is the decomposition level.
Figure 3 presents the scheme of the filter systems. An example of wavelet
functions used in this paper for the DWT is shown in Figure 4. The approximation and detail parts are respectively obtained by a low-pass filter and a high-pass filter.
First level Second level Third level
Figure 3. Filter systems of the wavelet transform (where S is the signal,
i
Figure 4. Example of wavelet functions used in 1-D discrete wavelet
transforms – Daubechies family wavelets [12]
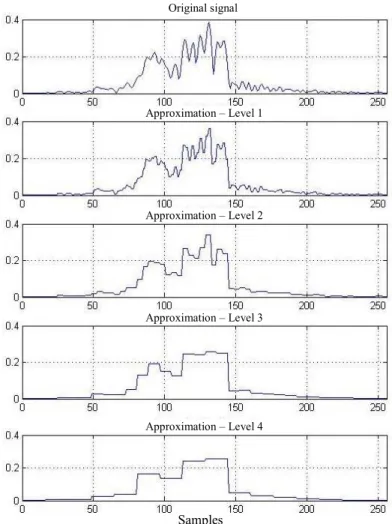
At each level, filtering process is followed by decimation by 2 that decreases the data size. The approximations and details at each level are pre-processed from the original signal and placed in the training data set.
Figure 5 presents an example of range profile and its wavelet decomposition
computed in five levels.
Samples Original signal Approximation – Level 1 Approximation – Level 2 Approximation – Level 3 Approximation – Level 4
Figure 5. Example of range profile and its wavelet transform computed
A previous work [12] has shown that there is no statistically significant difference in performance of the classifier when different wavelets are chosen, as shown in Figure 6. This figure presents an estimation of Pfc as a function
SNR for these different wavelets. Results are very similar whatever the wavelet
families. Thus, in the next sections, only results obtained with the Haar wavelet and using approximations parts are presented.
SNR (dB) Pfc (%) Original signal Haar wavelet Daubechies 2 wavelet Biorthogonal 3.1 wavelet
Figure 6. Probability of false classification Pfc as a function SNR for three
different wavelets (Haar, Daubechies 2, biorthogonal 3.1) using an adaptive hard threshold and a decomposition until level 4 [12]
5. Application of Unsupervised Clustering Techniques
to Database Compression
Clustering can be considered as the most important unsupervised learning problem. It deals with finding a structure in a collection of unlabelled data. Another definition is the classification of objects according to similarities among them, and organizing of data in groups [13]. A popular measure to determine this similarity is the Minkowski metric [14]:
1 , , 1 , d p p i j i k j k k d x x x x
, (5)where d is the dimensionality of the data, and p1 is a control of the distance growth of patterns. In our case, we have chosen to use the Euclidean distance where p2.
Two types of clustering methods can be defined:
Hard clustering techniques where data are set into C specified number of mutually exclusive subsets;
Fuzzy clustering techniques where data can be assigned to several clusters simultaneously, with different degrees of membership.
Data membership to a partition is usually defined by an appropriate matrix U whose factors are equal to 0 or 1 in the case of hard clustering method, or a number between 0 and 1 in the case of fuzzy clustering method. In this paper, two techniques are tested and compared, the K-means technique (hard clustering) and the fuzzy C-means technique (overlapping clustering). For a complete description of these unsupervised clustering algorithms, the reader should refer to [13-18].
Previous results [12] have shown that better performances are obtained with a hard clustering algorithm, like K-means, in NCTR applications. Thus, in the next sections, only results obtained with the K-means hard partitioning method are presented.
The K-means hard partitioning method is simple and popular [16]. From an N n dimensional data set, K-means algorithm allocates each data point to
one of C clusters to minimize the following objective function:
2 1 i C k i i k A J x c
, (6)where Ai is a set of objects (data points) in the ith cluster and ci is the mean for that points over cluster i.
Thus, ci are called the cluster centers and are defined as:
1 , i N k k i k i i x c x A N
, (7)where Ni is the number of objects in Ai.
An example of results obtained with K-means algorithm is presented in
Figures 13 and 14, with C50 and Haar wavelet decomposition. In this case,
Sct is divided by a factor of 14, but the minimum SNR to have a Pfc1% must be increased of 7 dB for the original signal. Sct still can decrease using approximation signals on different decomposition level. For the decomposition level 4, Sct is divided by a factor of 40, but signal to noise ratio must be increased by a factor of 14 dB to have the same probability of false classification.
6. Application of Multiresolution Hierarchical Tree
to Target Recognition
These previous techniques are very useful in many applications. These methods give powerful efficiencies but each of them has its own limitation [12, 19, 20].
Application of wavelets representation to NCTR application slightly decreases recognition search time but with a low degradation of false identification probability. At the opposite, use of clustering algorithm gives a very low decrease of recognition search time but with an important degradation of false identification probability. A way to improve these techniques is their association in a multiresolution hierarchical tree.
6.1 Tree Structure Design
In the case of a clustering algorithm applied to NCTR, best efficiencies are obtained for an optimum number of clusters [19]. For multiresolution hierarchical tree, problem is quite different. Number of clusters must be large to have a decrease of computational time, but probability of false classification must not be degraded. The clusters number on each decomposition level must be defined as a function of the distortion on the entire population of data vectors [3]. This distortion can be determined using a mean squared distance metric and is computed using the finest representation of the data vectors. It is defined as:
2 0 , 0 , 0 1 c n c i jc jc i n d C S M
, (8)where j is the decomposition level, nc, the number of data vectors in cluster c,
jc, 0
C , the centroid of the cluster re-sampled at the finest resolution (0), Si0, the data vector number i at the resolution 0, and M, the total number of the data vectors.
For the entire tree, total distortion TD can be computed as:
, 0 1 1 J k jc j c TD d
, (9)where J is the maximum decomposition level, and k, the number of clusters. Then, to design the tree, the processing steps are the following:
– Step 1: loading of the complete target database;
– Step 2: wavelet decomposition of the target database on different levels;
– Step 3: computation of the clustering database on the lowest (coarsest) decomposition level using the djc, 0 criterion;
– Step 4: computation of the clustering database using the next finer resolution based on the previous subpartition and the djc, 0 distortion
criterion;
– Repeat step 4 until the decomposition level 0 corresponding to the finest resolution (original signals).
Once tree is built, a pruning is realized by inspecting the contents of the different clusters. If a cluster contains only signatures of one aircraft or if on the upper level, the node has not leaves, then the branch is pruned.
To evaluate the consistence of the hierarchical tree, the total distortion TD and the entropy of the final partition E can be determined as a function of the number of clusters. Entropy is a measure of randomness of the population of a cluster and is defined as:
1 1 log J k c c j c n n E M M
. (10)6.2 Application of Multiresolution Hierarchical Tree
to Target Recognition
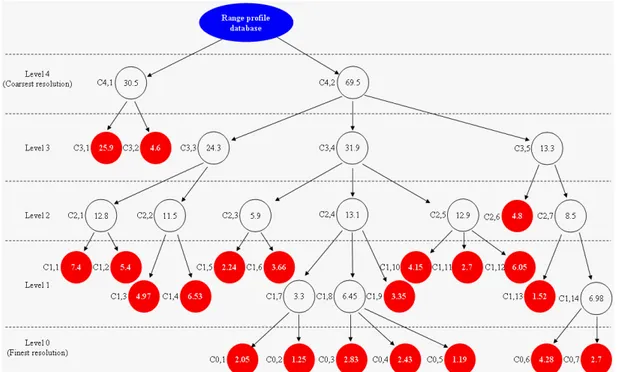
Different multiresolution hierarchical trees have been designed from different beginning decomposition levels (1 to 4). An example of tree built from the decomposition level 4, and using the Haar wavelet and the K-means hard partitioning algorithm, is shown in Figure 7. This tree has 21 final clusters, an average distortion of 0.56 and a partition entropy of 2.9. In this figure, the clusters are designated by the notation Cj k, , where k is the cluster number at resolution j. The number in each circle defines the percentage of data in the cluster.
Figure 7. Example of multiresolution hierarchical tree built from the level
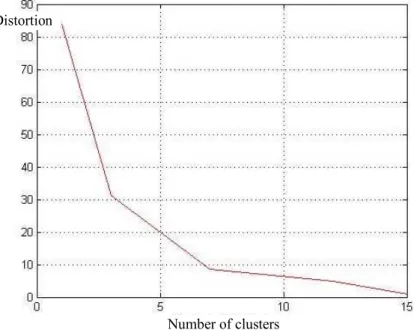
Total distortion and entropy are presented in Figures 8 and 9. A decrease of total distortion and an increase of entropy as a function of the number of clusters are observed which confirms the validity of the tree designing method. In Figures 10 and 11, examples of range profiles contained in some clusters are shown. We can see that range profiles are associated according to aspect.
Number of clusters Distortion
Figure 8. Estimation of total distortion as a function of the number of clusters
Entropy Distortion
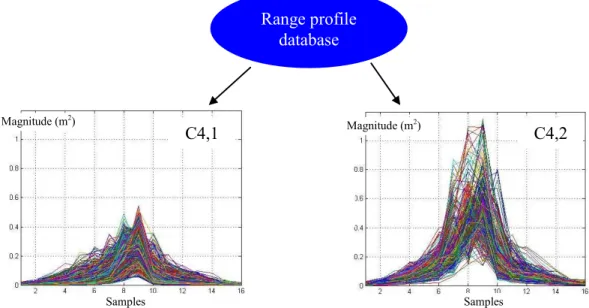
Range profile database C4,1 C4,2 Samples Samples Magnitude (m2) Magnitude (m2)
Figure 10. Example of range profiles in each cluster at decomposition level 4
Samples Magnitude (m2) C3,4 Samples Magnitude (m2) C4,2 Samples Magnitude (m2) C3,3 Samples Magnitude (m2) C3,5
Figure 11. Example of range profiles in each cluster at decomposition level 3
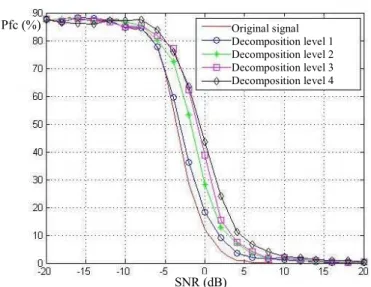
Figure 12 presents an estimation of Pfc as a function SNR for different
multiresolution hierarchical trees designed from different beginning decomposition levels (1 to 4). A degradation of the Pfc can be observed as a function of the beginning approximation level.
SNR (dB) Pfc (%) Original signal Decomposition level 1 Decomposition level 2 Decomposition level 3 Decomposition level 4
Figure 12. Probability of false classification Pfc as a function SNR for the original set
and the multiresolution hierarchical trees designed from different beginning decomposition levels 4 to 1, using a Haar wavelet and the K-means algorithm
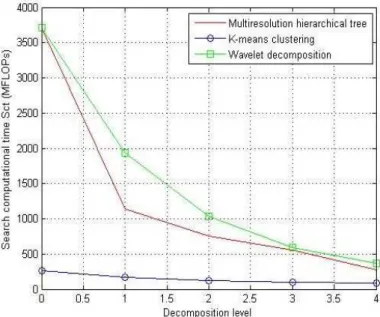
Figures 13 and 14 show the variation of minimum SNR to obtain a Pfc
smaller than 1%, and the search computational time Sct for a fixed SNR as a function of the beginning decomposition level used to design the multiresolution hierarchical tree. We observe a degradation of the minimum SNR to have a
1%
Pfc of 8 dB, but the Sct is divided by a factor of 13.
Thus, multiresolution hierarchical trees are a solution to compress high resolution data of radar targets. It must be interesting to compare these techniques as a function of the probability of false classification and the computational time of search.
Finally, Figures 13 and 14 compare the efficiencies of these different techniques (multiresolution hierarchical trees, K-means clustering algorithm, multiresolution Haar wavelet decomposition). The lowest Sct is obtained for the clustering algorithm but with the most important degradation of the minimum
SNR to obtain a Pfc smaller than 1%. Use of the approximation signals of
wavelet decomposition to NCTR application makes it possible to obtain the weakest SNR to obtain a Pfc smaller than 1%, in particular for the first decomposition levels (1 and 2). Use of multiresolution hierarchical trees, designed from the coarser decomposition levels (3 and 4) is a good compromise between the data clustering and the wavelet decomposition, because a better performance is obtained for the minimum SNR to obtain a Pfc smaller than 1%, with a similar search computational time.
Figure 13. Minimum SNR to obtain a Pfc smaller than 1% as a function
of decomposition level for the multiresolution hierarchical trees, K-means algorithm (C = 50), and the Haar wavelet decomposition
Figure 14. Search computational time Sct as a function of decomposition level
for the multiresolution hierarchical trees, the K-means algorithm (C = 50), and the Haar wavelet decomposition
7. Comments and Conclusion
The objective of this paper is to evaluate the efficiency of a tree structured hierarchical wavelet representation to minimize the computational search time to NCTR association. The hierarchical designing method based on the use of approximation signals of the wavelet decomposition coupled with the K-means unsupervised clustering algorithm, is described. A criterion is presented to determine the cluster number on each level of the tree with a hierarchical dependence. For a hierarchical tree designed from the decomposition level 4,
Sct is divided by a factor of 13, with a degradation of the minimum SNR to have
a Pfc1% of 8 dB. Comparison with other database compression methods (wavelet decomposition, hard clustering) shows that the multiresolution hierarchical trees are a good compromise as a function of Sct and Pfc, if their design have been made from the upper (coarser) decomposition levels.
Acknowledgment
The author thanks THALES Air Systems and the French Ministry of Defence (DGA) for their support to this study.
References
[1] D.E. NELSON, J.A. STARZYK, D.D. ENSLEY – Wavelet Transformation
and Signal Discrimination for HRR Radar Target Recognition,
Multidimensional Systems and Signal Processing, Vol. 14, No. 1-3, pp. 9-24, Jan.-Jul. 2003
[2] E.J. ROTHWELL, K.M. CHEN, D.P. NYQUIST, J.E. ROSS, R. BEBERMEYER – A Radar Target Discrimination Scheme Using
the Discrete Wavelet Transform for Reduced Data Storage, IEEE
Transactions on Antennas and Propagation, Vol. 42, No. 7, pp. 1033-1037, Jul. 1994
[3] J.S. BARAS, S. DEY – Adaptive Classification Based on Compressed Data
Using Learning Vector Quantization, Proc. of the 38th IEEE Conference on Decision and Control, Vol. 4, pp. 3677-3683, Phoenix, AZ, Dec. 7-10, 1999
[4] A. DAVID, C. BROUSSEAU, A. BOURDILLON – Validation of Heavy
Aircraft RCS Simulations at Very High Frequencies, Proc. of the 5th
International Conference on Radar Systems, Radar ’99, Brest, France, May 17-21, 1999
[5] C. BARÈS, C. BROUSSEAU, A. BOURDILLON – A Multifrequency
HF-VHF Radar System for Aircraft Identification, Proc. of the 2005
IEEE International Radar Conference, pp. 478-482, Arlington, VA, May 9-12, 2005
[6] C. BARÈS, C. BROUSSEAU, A. BOURDILLON – Aircraft Identification
Using RCS Measurements in the Low VHF Band, Proc. of the
International Conference on Radar Systems, Radar 2004, Toulouse, France, Oct. 19-21, 2004
[7] G.J. BURKE, A.J. POGGIO – Numerical Electromagnetic Code (NEC) –
Method of Moments. Volume I: Program Description – Theory,
Interaction Note 363, Lawrence Livermore Laboratory, Livermore, CA, Jul. 1977
[8] A. DAVID, C. BROUSSEAU, A. BOURDILLON – Simulations and
20-60 MHz Frequency Band, Radio Science, Vol. 38, No. 4, pp.
1064-1070, 2003
[9] T. COVER, P. HART – Nearest Neighbor Pattern Classification, IEEE Transactions on Information Theory, Vol. 13, No. 1, pp. 21-27, Jan. 1967
[10] S. MALLAT – A Wavelet Tour of Signal Processing, 2nd Edition, Academic Press, San Diego, CA, 1999
[11] S.G. MALLAT – A Theory for Multiresolution Signal Decomposition: The
Wavelet Representation, IEEE Transactions on Pattern Analysis and
Machine Intelligence, Vol. 11, No. 7, pp. 674-693, Jul. 1989
[12] C. BROUSSEAU – Application of the Multiresolution Wavelet
Representation to Non-Cooperative Target Recognition, Proc. of the
International Radar Conference – Surveillance for a Safer World, Radar 2009, Bordeaux, France, Oct. 12-16, 2009
[13] Y. ZENG, J. STARZYK – Statistical Approach to Clustering in Pattern
Recognition, Proc. of the 33rd Southeastern Symposium on System Theory, pp. 177-181, Athens, OH, Mar. 18-20, 2001
[14] R.O. DUDA, P.E. HART, D.G. STORK – Pattern Classification, 2nd Edition, John Wiley & Sons, New York, NY, 2001
[15] J.P. MARQUES de SÁ – Pattern Recognition: Concepts, Methods, and
Applications, Springer-Verlag, Berlin, Germany, 2001
[16] J.B. MACQUEEN – Some Methods for Classification and Analysis of
Multivariate Observations, Proc. of the 5th Berkeley Symposium on Mathematical Statistics and Probability, Vol. 1, pp. 281-297, Berkeley, CA, 1967
[17] J.C. DUNN – A Fuzzy Relative of the ISODATA Process and Its Use in
Detecting Compact Well-Separated Clusters, Journal of Cybernetics,
Vol. 3, No. 3, pp. 32-57, 1973
[18] J.C. BEZDEK – Pattern Recognition with Fuzzy Objective Function
Algorithms, Plenum Press, New York, NY, 1981
[19] C. BROUSSEAU – Development of a Tree Structured Hierarchical
Wavelet Representation of Synthetic Database to NCTR, Proc. of the
2010 IEEE International Radar Conference, pp. 368-373, Washington, DC, May 10-14, 2010
[20] C. BROUSSEAU – Development of Multiresolution Hierarchical Trees to
Non-Cooperative Target Recognition, Proc. of the 9th International Conference on Communications, COMM 2012, pp. 51-54, Bucharest, Romania, Jun. 21-23, 2012

![Figure 6. Probability of false classification Pfc as a function SNR for three different wavelets (Haar, Daubechies 2, biorthogonal 3.1) using an adaptive hard threshold and a decomposition until level 4 [12]](https://thumb-eu.123doks.com/thumbv2/123doknet/11294939.281062/8.893.256.641.284.587/probability-classification-function-different-daubechies-biorthogonal-threshold-decomposition.webp)