HAL Id: hal-00991546
https://hal.archives-ouvertes.fr/hal-00991546
Submitted on 15 May 2014
HAL is a multi-disciplinary open access
archive for the deposit and dissemination of
sci-entific research documents, whether they are
pub-lished or not. The documents may come from
teaching and research institutions in France or
abroad, or from public or private research centers.
L’archive ouverte pluridisciplinaire HAL, est
destinée au dépôt et à la diffusion de documents
scientifiques de niveau recherche, publiés ou non,
émanant des établissements d’enseignement et de
recherche français ou étrangers, des laboratoires
publics ou privés.
Measurement and modelisation of dielectric properties
of ferroelectrics thin layers
Raphaël Renoud, Caroline Borderon, Hartmut Gundel
To cite this version:
Raphaël Renoud, Caroline Borderon, Hartmut Gundel. Measurement and modelisation of dielectric
properties of ferroelectrics thin layers. ISAF 2010, Aug 2010, Edinburgh, United Kingdom. pp.1-5,
�10.1109/ISAF.2010.5712244�. �hal-00991546�
Measurement and modelisation of dielectric
properties of ferroelectrics thin layers
R. Renoud, C. Borderon and H.W. Gundel
IREENA, EA 1770, University of Nantes, Nantes Atlantic Universities 2 rue de la Houssinière, Nantes, F-44322, France
raphael.renoud@univ-nantes.fr Abstract— In this study, the real and imaginary parts of the
complex permittivity of PZT ferroelectric thin films are studied in the frequency range of 100 Hz – 100 MHz. The permittivity is well fitted by the Cole-Cole model. The variation of the relaxation time with temperature is described by the Arrhenius law and an activation energy of 0.38 eV is found. Due to its nonlinear character, the dielectric response of the ferroelectric sample depends on the amplitude of the applied ac electric field. The permittivity is composed of three different contributions: the first is due to intrinsic lattice, the second to domain wall vibrations and the third to domain wall jumps between pinning centers. The last one depends on the electric field so it is important to control the field amplitude to obtain the desired values of permittivity and tunability.
Dielectric permittivity, Cole-Cole approach, domain walls, temperature effects, hyperbolic law.
I. INTRODUCTION
More recently, functional ferroelectric thin films have shown a growing interest for telecommunication applications. The tunability of the dielectric constant under an applied electric field allows realizing of intelligent devices. However, the use of these materials is at present limiting because they present relatively high dielectric losses and a too low tunability. Thus a better understanding of the ferroelectric dielectric characteristics is still required.
In practical devices, the ferroelectric thin films are often used in a metal – insulator – metal geometry (MIM structure). Hence we have chosen chemical solution deposition (CSD) for an elaboration of the films on stainless steel substrates. Dielectric measurements were performed with an Agilent 4294A impedance analyzer. The relative permittivity and the losses were obtained in the 100 Hz – 100 MHz frequency range at temperatures varying from ambient temperature to 250°C. The real and the imaginary part of the permittivity were deduced and modeled using a Cole-Cole approach. The effects of temperature and of the amplitude of the ac electric field on the permittivity are studied. This allows us determination of the parameters which have a main influence on the tunability of the ferroelectric material.
II. EXPERIMENTAL PROCEDURE
The Pb(Zr0.43Ti0.57)O3 thin films (PZT 43/57) were realized
by a modified sol-gel process based on the use of an alkoxide precursor. The lead acetate Pb(OOCCH3)2 is dissolved in acetic
acid CH3COOH and the solution is heated at 100°C until
complete dissolution. The solution is then cooled down at room temperature before the addition of the zirconium and the titanium n-propoxides which are mixed with a molar ratio of 43/57. Ethylene glycol HO-CH2-CH2-OH is added in order to
retain the mobility of the atoms and significantly reduces the appearance of cracks in the film [1]. Moreover, addition of ethylene glycol stabilizes the solution and prevents from precipitation [2]. Solution is then filtrated and deposited by spin coating at 4000 rpm during 20 sec on stainless steel substrates (AISI 304) and the samples are annealed during 2 min in a pre-heated open air furnace at 650°C. Multiple spin-coating was used when thicker PZT layers are desired.
The samples were characterized (thickness and surface of the films) by scanning electron microscopy (SEM) (Jeol 6400) and the crystallinity is determined by X-ray diffraction (Siemens D5000). The samples that crystallized in the tetragonal phase, present a polycristalline structure with grains having an average diameter of 90 nm. The measured thickness
e is 1 µm. Square gold electrodes of 0.5 mm larger (surface S = 0.25 mm2) were evaporated through a shadow mask on the
films in order to form metal-ferroelectric-metal capacitors in a parallel-plate structure.
The P-E hysteresis loops (figure 1) were measured using a classic Sawyer-Tower circuit to verify the polarization state of the sample. The remanente polarization Pr is equal to
0.25 µC·cm-2 while the value of the coercitive field is
Ec = 95 kV·cm-1. -400 -200 0 200 400 -0,4 -0,3 -0,2 -0,1 0,0 0,1 0,2 0,3 0,4 Po la ri sa tio n ( μ C/ cm 2 ) Electric field (kV/cm)
We also measure the ε’-E loop in order to determine the tunability of the material (figure 2). For that, we use the classic definition [3] (0) ( ) % 100 (0) bias E tunability ε ε ε ′ − ′ = ′ × (1)
where ε'(0) and ε'(Ebias) are the permittivity without and under
the bias electric field Ebias. The samples present here a
tunability of 42.1 %. -200 -100 0 100 200 180 200 220 240 260 280 300 320 Re la tive pe rm itti vit y ε '
Applied electric field Ebias (kV.cm-1)
Figure 2. Butterfly ε-E loops of PZT 43/57 at 300 K.
The capacitance C and the dielectric loss factor (tan δ) were measured using an impedancemeter (Agilent 4294A) with a low ac field Eexc on 100 Hz - 100 MHz domain frequencies. The
real and imaginary parts of the permittivity (ε' and ε" respectively) are calculated with
0 and tan . C e S ε ε δ ε ε ′= ′′= ⋅ ′ (2)
ε0 is the permittivity of free space.
III. RESULTS AND DISCUSSIONS
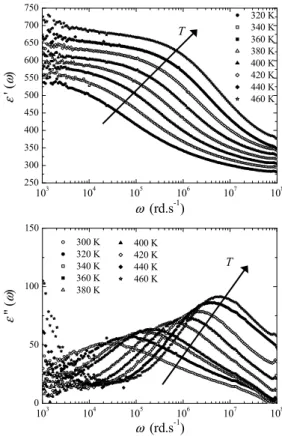
A first series of measurements allows us to obtain the real part ε' and imaginary part ε" of the permittivity as a function of the frequency at different temperatures. Results are reported on figure 3. A relaxation is observed on the frequency domain studied and is attributed to the domain wall movements [4]. Under the influence of the electric field, domain walls can either vibrate around their equilibrium position (pinning centers) or jump from a center to another. The relaxation time τ
is defined by τ = 1/ω0 where ω0 is the pulsation for which ε"(ω)
is maximum (or for which ε'(ω) admits an inflection point). His relaxation time increases with temperature and the values of εs
and ε∞ (εs =limω→0 ε ω′
( )
,ε∞ =ωlim→∞ ε ω′( )
) also increase. Atlow frequencies, diffusion process appears for the highest values of T. Generally, one can write [5]
( )
( )
( )
( )
2 2 0 2 2 0 d 1 d 1 g g τ ε ω ε ε τ ω τ τ ωτ ε ω ε τ ω τ ∞ ∞ ∞ ′ = + Δ + ′′ = Δ +∫
∫
(3) 103 104 105 106 107 108 250 300 350 400 450 500 550 600 650 700 750 320 K 340 K 360 K 380 K 400 K 420 K 440 K 460 K ε ' ( ω ) ω (rd.s-1) T 103 104 105 106 107 108 0 50 100 150 400 K 420 K 440 K 460 K 300 K 320 K 340 K 360 K 380 K ε '' (ω ) ω (rd.s-1) TFigure 3. Evolution of ε' (top) and of ε" (bottom) as a function
of the angular frequency ω and of the temperature T.
where Δε = εs - ε∞. g(τ) is the distribution of the relaxation time
which is specific to studied relaxation. Generally, it is
impossible to obtain g(τ) only from the knowledge of ε'(ω) and
ε"(ω).
Figure 4 the Argand diagram, one realizes that data are well approximated by a Cole-Cole arc. In the Cole-Cole theory, the
complex permittivity is done by (p = ωτ) [6]
( )
( )
* 1 1 ip β ε ε ω ε∞ − Δ = + + (4)with β a dispersion parameter which accounts for the width of
the distribution of the relaxation time (β = 0 correspond to a
single relaxation time, i.e. Debye formalism).
250 300 350 400 450 500 550 600 650 0 10 20 30 40 50 60 70 80 300 K 320 K 340 K 360 K 380 K 400 K 420 K ε r " εr' T
Figure 4. Evolution of the Argand diagram for several temperatures. For a better visibility of the figure, scales are not identical on the two axes.
This can be also expressed by
( )
( )(
(
)
)
( )
( )(
(
)
)
1 2 1 1 1 2 1 1 1 sin 2 1 2 sin 2 cos 2 . 1 2 sin 2 p p p p p p β β β β β β β π ε ω ε ε β π β π ε ω ε β π − ∞ − − − − − + ′ = + Δ + + ′′ = Δ + + (5)Parameters ε∞, Δε, τ and β are determined by fitting curves of figure 3 with equations (5). We found that ε∞ follows a
Curie-Weiss law (TC = 770 K) while Δε does not depend on the
temperature (figure 5). Thus εs also follows a Curie-Weiss law
as awaited for ferroelectric materials.
300 320 340 360 380 400 420 440 460 0,0010 0,0015 0,0020 0,0025 0,0030 0,0035 0,0040 1/Δε 1/ε∞ 1/εs 1/ε T (K )
Figure 5. Variation of εs, ε∞ and Δε with temperature.
As shown on figure 6, the relaxation time τ obeys to an Arrhenius law which corresponds to a thermally activated process 0exp a B E k T τ τ= ⎛⎜ ⎞⎟ ⎝ ⎠. (6)
Ea is the activation energy and equals here to 0.38 eV. We
found also τ0 = 12.6 ps and 1/τ0 well corresponds to the phonon
vibration frequency. kB is the Boltzmann constant.
0,0020 0,0025 0,0030 0,0035 10-1 100 101 102 τ (µ s) 1/T (K-1)
Figure 6. Variation of τ as a function of temperature.
On the temperature domain studied here, β seems to have a linear dependence with temperature (figure 7), decreasing when
T increases. However, it is difficult to interpret this result
because β has not a direct physical signification.
As already mentioned, the movement of domain walls under the influence of a low ac electric field Eexc can
corresponds either to a vibration around the equilibrium position, or to a jump towards another equilibrium position. For the permittivity, that results in the hyperbolic law [7]
2 2 2 2 2
bulk rev irrev bulk rev Eexc
ε ε= + ε +ε =ε + ε +α . (7)
εbulk is the permittivity due to intrinsic lattice contributions,
εrev the dielectric constant related to domain walls vibrations
which correspond to a reversible process [8]. The parameter α represents domain walls pinning and is related to an irreversible modification of the local polarization [9]. Both parameters depend on the crystal structure, but α also reflects the presence of impurities, dopants or defects [8]. This law is only valid if Eexc < EC/2 (= 45 kV·cm-1here) [7-8].
103 104 105 106 107 200 250 300 350 400 450 500 550
τ
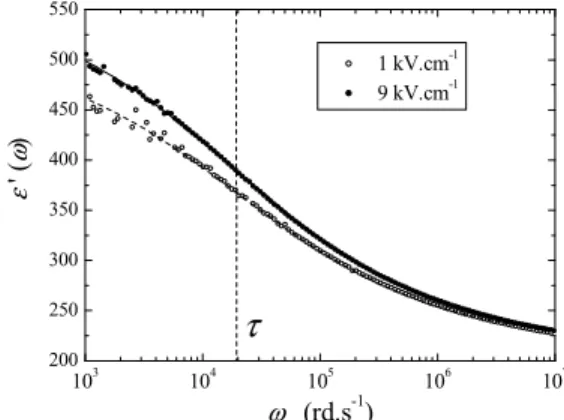
1 kV.cm-1 9 kV.cm-1 ε ' (ω ) ω (rd.s-1)Figure 7. Variation of ε’ as a function of ω for two values of Eexc.
In a second series, the temperature is fixed at 300 K and ε' and ε" are measured for two values of Eexc, 1 kV·cm-1 and
9 kV·cm-1 (figure 7). The field effect is only perceptible at low
frequencies and in particular, fits show that ε∞ is independent
of Eexc. Consequently, for ω >> 1/τ, domain walls do not jump
any more.
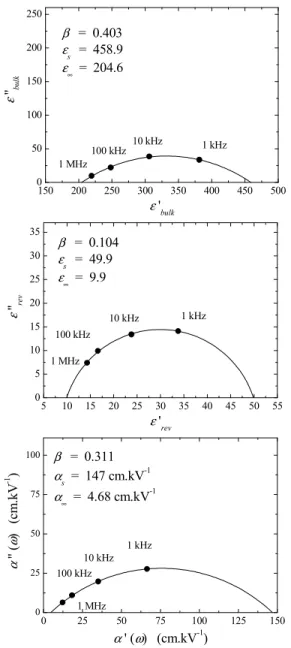
We have also measured the variations of ε' and ε" as the function of field Eexc at various frequencies (1, 10, 100 and
1000 kHz) and plot the Argand diagrams for the different contributions to the permittivity (bulk, reversible and irreversible). Results are reported on figure 8.
It is noticed that each contribution to the permittivity is described by a Cole-Cole law with a very different dispersion parameter β. On a Argand diagram, the relaxation time is obtained by the frequency which corresponds to the maximum of ε". The values of τ estimated by this way for each contribution are practically the same excepted for the irreversible contribution. In this last case, a wall jumping from a site to another is difficult to realize and the relaxation time is very large. In both other cases, there are always some dipole vibrations, either in the domain wall or in the lattice. Thus, the relaxation times of bulk and reversible contributions are similar.
150 200 250 300 350 400 450 500 0 50 100 150 200 250 1 MHz 100 kHz 10 kHz 1 kHz β = 0.403 εs = 458.9 ε∞ = 204.6 ε ''bul k ε 'bulk 5 10 15 20 25 30 35 40 45 50 55 0 5 10 15 20 25 30 35 1 MHz 100 kHz 10 kHz 1 kHz β = 0.104 εs = 49.9 ε∞ = 9.9 ε ''re v ε 'rev 0 25 50 75 100 125 150 0 25 50 75 100 1 MHz 100 kHz 10 kHz 1 kHz β = 0.311 αs = 147 cm.kV -1 α∞ = 4.68 cm.kV-1 α '' ( ω ) (c m .k V -1 ) α ' (ω) (cm.kV-1)
Figure 8. Argand diagram for the bulk (top), the reversible (middle) and irreversible (bottom) contributions.
To finish, we plot the tunability of the sample as a function of Eexc (figure 9). It seems interesting to work with the greatest
amplitude of Eexc. However, losses also increase with the field
amplitude [4]. We can then define a figure of merit by
max Tunability . . . tan F O M δ = . (8)
On figure 9, we see that the F.O.M. decrease when the field amplitude Eexc increases. The losses increase more quickly than
the real permittivity. So, to have a better compromise between the tunability and the losses, it thus appears preferable to work with an electric field of low amplitude.
IV. CONCLUSIONS
The study of PZT 43/57 shows that the permittivity is correctly described by the Cole-Cole model. The relaxation time is done by the Arrhenius law corresponding to a thermally
activated process with an activation energy equals to 0.38 eV. The hyperbolic law shows that permittivity has three different contributions. The contribution associated with the domain wall jumps depends on the amplitude of the applied ac electric field. Thus, for devices including ferroelectric thin films, it is important to control this parameter. The values of the permittivity and tenability are significantly influences by the electric field. Because of the dielectric losses which also grow with the field, it is advised to use a reconfigurable device with a field amplitude the weakest possible.
0 1 2 3 4 5 6 38 40 42 44 46 ν = 10 kHz
Applied electric field Eexc (kV.cm-1)
Tu na bilit y ( % ) 6 8 10 12 14 F. O .M.
Figure 9. Tunability (Top) and Figure Of Merit (bottom) as a function of Eexc.
REFERENCES
[1] N. V. Giridharan, S. Madeswaran, and R. Jayavel, "Structural, morphology and electrical studies on ferroelectric bismuth titanate thin films prepared by sol-gel technique," Journal of Crystal Growth, vol. 237-239, pp. 468-472, 2002.
[2] H.-Y. Tian, W.-G. Luo, X.-H. Pu, X.-Y. He, P.-S. Qiu, and A.-L. Ding,
"Synthesis and dielectric characteristic of Ba1-xSrxTiO3 thin films-based
strontium-barium alkoxides derivatives," Materials Chemistry and Physics, vol. 69, pp. 166-71, 2001.
[3] H. N. Al-Shareef, D. Dimos, M. V. Raymond, R. W. Schwartz, and C. H. Mueller, "Tunability and calculation of the dielectric constant of capacitor structures with interdigital electrodes," Journal of Electroceramics, vol. 1, pp. 145-153, 1997.
[4] C. Borderon, "Développement et étude des matériaux ferroélectriques accordables en vue d’une application pour les antennes intelligentes" PhD Thesis, University of Nantes, 2008.
[5] I. Bunget, M. Popescu, Physics of solids dielectrics, Elsevier, 1984, pp.282-291.
[6] K.S. Cole, R.H. Cole, "Dispersion and absorption in dielectrics. I- Alternating current characteristics", Journal of Chemical Physics, vol. 9, pp. 341-351, 1941.
[7] C. Borderon, R. Renoud, M. Ragheb, and H. W. Gundel, "Description of the low field nonlinear dielectric properties of ferroelectric and multiferroics materials," Applied Physics Letters, unpublished.
[8] O. Boser, "Statistical theory of hysteresis in ferroelectric materials," Journal of Applied Physics, vol. 62, pp. 1344-1348, 1987.
[9] N. B. Gharb and S. Trolier-McKinstry, "Dielectric nonlinearity of
Pb(Yb1/2Nb1/2)O3-PbTiO3 thin films with {100} and {111}
crystallographic orientation," Journal of Applied Physics, vol. 97, pp. 64106, 2005.