HAL Id: hal-01740242
https://hal.archives-ouvertes.fr/hal-01740242v2
Submitted on 30 Apr 2019
HAL is a multi-disciplinary open access
archive for the deposit and dissemination of
sci-entific research documents, whether they are
pub-lished or not. The documents may come from
teaching and research institutions in France or
abroad, or from public or private research centers.
L’archive ouverte pluridisciplinaire HAL, est
destinée au dépôt et à la diffusion de documents
scientifiques de niveau recherche, publiés ou non,
émanant des établissements d’enseignement et de
recherche français ou étrangers, des laboratoires
publics ou privés.
Puente Guillen, et al.
To cite this version:
Marie-Pierre Bruyas, Céline Estraillier, David Large, Gary Burnett, Martin Kunert, et al.. Deliverable
7.2. Report on methodology for balancing user acceptance, robustness and performance. [Research
Report] IFSTTAR - Institut Français des Sciences et Technologies des Transports, de l’Aménagement
et des Réseaux. 2017, 45 p. �hal-01740242v2�
EUROPEAN COMMISSION
EIGHTH FRAMEWORK PROGRAMME
HORIZON 2020
Page | 1 out of 44
The research leading to the results of this work has received funding from the European Community’s Eighth Framework Program (Horizon2020) under grant agreement n° 634149.
Deliverable No. D7.2
Deliverable Title Report on methodology for balancing user acceptance, robustness and performance
Dissemination level PUBLIC
Written by
Bruyas, Marie-Pierre /
Estraillier, Céline IFSTTAR
Large, David / Burnett, Gary University of Nottingham
Kunert, Martin Bosch
Krebs, Sebastian Arbitmann, Maxim Stoll Johann / Gohl Irene
Daimler AG Continental AUDI Puente Guillen, Pablo /
Ranovona, Maminirina Perlet, Klaus
TME BMW
Checked by Eriksson, Alexander VIT 29.10.2017
Burnett, Gary University of
Nottingham 20.10.2017 Approved by Aparicio, Andres / Cieslik,
Ilona IDIADA 31.10.2017
Page | 2 out of 44
Executive summary
The primary goal of this deliverable is to provide an overview of the methodology for acceptance testing that will be used during the tests conducted in T7.1, T7.2 and T7.3 within the PROSPECT project.
The report starts with a description of the main characteristics of the most relevant accident scenarios where safety improvements are necessary. Among all use cases identified in WP3, twelve have been especially selected by the project to be implemented in the demonstrators: 9 for cyclists and 3 for pedestrians. Behaviours such as the velocity, distance and offset of the vehicle and cyclist are defined, so that the Safe Scenario, Critical Scenario and Possible Critical Scenario can be realized on the test tracks or in simulator environments.
A literature review covering acceptance evaluation issues is then presented, outlining the questionnaires that are generally used to evaluate subjective measures, such as acceptance and trust. The methodology developed for Task 7.3 is then based on such questionnaires to be administered in tests and experiments that will evaluate PROSPECT systems. By using common questionnaires, this task facilitates an overall evaluation of the acceptance of all the developed functions.
The methodology is presented in section 4 of this report, including a tool for data collection (LimeSurvey). This tool makes it possible for participants in evaluation studies to answer questions on various displays, to the convenience of the experimenters. In order to balance the user acceptance to the robustness and performance of the tested systems, all answers to the questionnaires will be linked to the PROSPECT functions tested and to the quality of the PROSPECT systems functioning. This methodology will be used at different times of the tests:
before running a test/experiment (questionnaire 1 - participant information and questionnaire 3 - global expected acceptance of the system or a priori acceptability),
during the test/experiment (questionnaire 2 - feedback on each situation) and
after the test/experiment (questionnaire 3 - global acceptance of the system after having experienced it).
At the end of this document, a section briefly describes all the experiments currently planned that will use the methodology within WP7. Their results will be reported in Deliverable 7.3 “Report on simulator test results and driver acceptance of PROSPECT functions”.
Page | 3 out of 44
Content
Executive summary ... 2 Content ... 3 List of figures ... 4 1 Introduction ... 5 2 Scenarios to be tested ... 62.1 Tests scenarios for Bosch demonstrator ... 6
2.2 Tests scenarios for Daimler demonstrator ... 11
2.3 Tests scenarios for Continental demonstrator ... 13
2.4 System performances ... 15
3 Towards an acceptance model ... 16
3.1 Model of driver acceptance ... 17
4 Methodology for acceptance testing ... 19
4.1 Research questions ... 19
4.2 Questionnaires used in the literature ... 20
4.2.1 Usefulness/satisfaction scale (Van der Laan et al. 1997) ... 20
4.2.2 System Usability Scale (Brooke, 1986) ... 21
4.2.3 Perceived Usefulness and Perceived Ease of Use scale (Davis, 1989) ... 23
4.2.4 Scale of trust between people and automated system (Jian et al. 2000) ... 24
4.2.5 Risk awareness measurement (Bellet, Banet, 2012) ... 26
4.2.6 In summary ... 27
4.3 PROSPECT Questionnaires ... 28
4.3.1 Questionnaire 1 - Participant’s information (BEFORE) ... 28
4.3.2 Questionnaire 2 - Feedback on events (DURING) ... 30
4.3.3 Questionnaire 3 - Acceptance of the system (BEFORE & AFTER the experiment) ... 32
4.3.4 Data collection ... 37
5 Planned experiments ... 39
5.1 IFSTTAR experiments: Focus group and video experiments ... 39
5.2 UoN experiments: Longitudinal Simulator Study ... 39
5.3 Audi simulator study ... 40
5.4 Bosch/Continental/Daimler demonstrator car experiments ... 40
6 Conclusion ... 41
7 References ... 42
8 Annex ... 44
8.1 Storyboard of Bosch Demonstrator use cases ... 44
Page | 4 out of 44
List of figures
Figure 1: The 12 demonstrator use cases defined within WP2 and WP3 ... 6
Figure 2: The four Bosch demonstrator use cases ... 7
Figure 3: State flow chart for Bosch Demonstrator use case UC_DEM_2 ... 8
Figure 4: State flow chart for Bosch Demonstrator use case UC_DEM_4 ... 10
Figure 5: State flow chart for Bosch Demonstrator use case UC_DEM_7 and UC_DEM_8 ... 11
Figure 6 The five different use cases which are tested with the Daimler prototype vehicle. ... 11
Figure 7: Use cases of Continental demonstrator ... 13
Figure 8 Bobillier-Chaumon model of acceptance (2016) ... 16
Figure 9 Usefulness/satisfaction scale (Van der Laan et al., 1997) ... 21
Figure 10: System Usability Scale (Brooke, 1986) ... 22
Figure 11: Perceived Usefulness scale (Davis, 1989) ... 23
Figure 12: Perceived Ease of Use scale (Davis, 1989) ... 23
Figure 13: Jian et al. Scale of trust between people and automated system ... 25
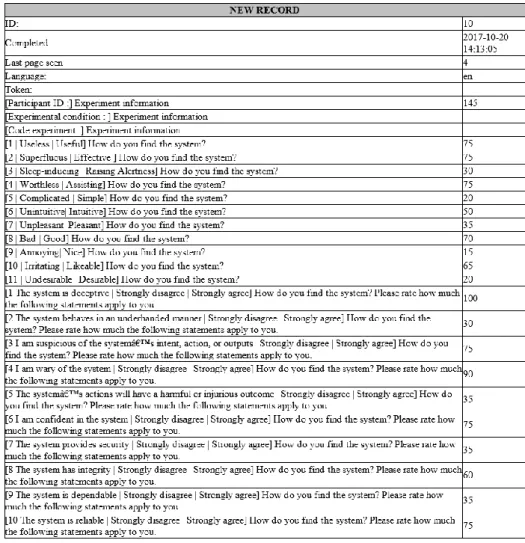
Figure 14: An Excel export example ... 37
Figure 15: A word export example ... 38
Page | 5 out of 44
1 Introduction
The focus of WP7 is to provide a valid estimation of the expected real-world benefit of all developed systems and functions, using specifically developed performance tests for the different system layouts, both for system effectiveness and robustness against false activation. Data will be generated with different levels of testing both in experiments close to reality conducted with physical prototypes, and by simulator studies. In this context, the methodology developed in Task T7.3 will be used to evaluate the driver acceptance of the technologies. Ideally, this testing will be conducted with drivers not trained on the new proactive VRU safety systems. Test and simulation work will be carried out for the three demonstrator vehicles (CONTI, DAIMLER and BOSCH) with their respective new functions and baseline vehicles provided by other OEMs.
User acceptance tests on different vehicles will provide important knowledge on the user perception of the new HMI concepts: PROSPECT sensor systems will aim to predict and respond to potentially critical situations earlier compared to state of the art systems (up to two seconds before a potential collision). HMI concepts need to use this prediction time for de-escalation of the situation. In addition to vehicle based user acceptance tests, extended user acceptance tests using simulator environments will also be conducted.
User acceptance is crucial for the success of all active safety systems - if the systems are unacceptable for the drivers (e.g. annoying, not trusted), they could be permanently turned off and would then have no effect on traffic safety. Moreover, interventions of active systems being rare, they may lead to unpredictable reactions from non-aware drivers being potentially frightened / startled when activated. Such situations have also to be investigated.
In this context, a specific acceptance methodology needed to be developed. This methodology will integrate acceptance of false alarms, which correspond to warnings and/or interventions occurring at inappropriate times. To be acceptable, false alarms need to be predictable and understandable by the drivers – i.e. transparent. With such conditions, it may be possible to assist the drivers to develop trust in the system. Therefore, an important aspect of this task will be to evaluate how false alarms may influence drivers’ acceptance and the role of any feedback HMI.
The primary goal of this deliverable is subsequently to provide the methodology for acceptance testing that will be used during tests conducted in T7.1, T7.2 and T7.3.
Page | 6 out of 44
2 Scenarios to be tested
The output from task T2.1 identified the most relevant car-to-cyclist and car-to-pedestrian accident scenarios where safety improvements are necessary. The system development will now focus on the most relevant ones. Use cases covering different encounter configuration have been identified in WP3.
Similar use cases concerning cyclists were concentrated in one single use case, especially where only road infrastructure or right of way indication (e.g. traffic sign or red light) was different. From a sensor perception viewpoint these scenarios are identical because the relative position and speed between the car and the bicycle are the same.
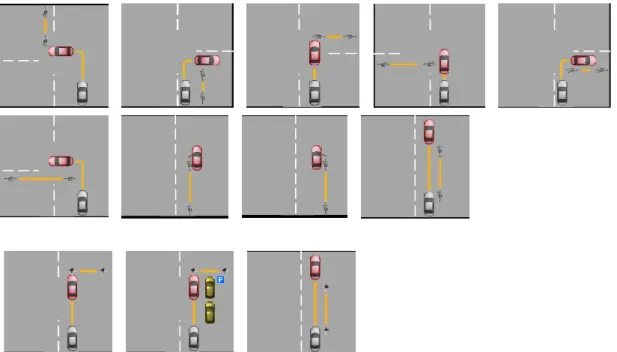
Among all use cases, 12 have been selected to be implemented in the demonstrators: 9 for cyclists and 3 for pedestrians. These 12 use-cases still address around 80% of all cyclist accidents investigated in deliverable 3.1.
A complete description of each demonstrator use case is provided in Deliverable D3.1 and D3.2.
Figure 1: The 12 demonstrator use cases defined within WP2 and WP3
2.1 Tests scenarios for Bosch demonstrator
The Bosch demonstrator is planned to be tested in four different use cases, namely UC_DEM_2, UC_DEM_4, UC_DEM_7 and UC_DEM_8. All these use cases focus on car-to-cyclist accident scenarios (see Figure 2).
Page | 7 out of 44
Figure 2: The four Bosch demonstrator use cases
Based on the situation analysis and the risk assessment, the scenarios in each of the addressed demonstrator use case can be further divided into three distinct scenario groups:
Safe Scenario (S), Critical Scenario (C) and Possible Critical Scenario (PC).
For the different road scenarios the corresponding warning and intervention strategies will be developed and implemented, specifically to assist the driver avoid imminent collisions and/or to reduce the severity of accidents. The criticality of the changing situation is also considered according to the intervention strategy that will be triggered. For example, if the situation will become more critical after an intervention, this intervention shall be aborted and another more effective intervention will be selected. In some specific cases, an intervention such as door locking shall be deactivated, as soon as the situation becomes safe again (i.e. the cyclist or pedestrian has passed the car and no further detection is triggered).
In UC_DEM_2, a vehicle and a cyclist are approaching a crossing by coming from the same direction.
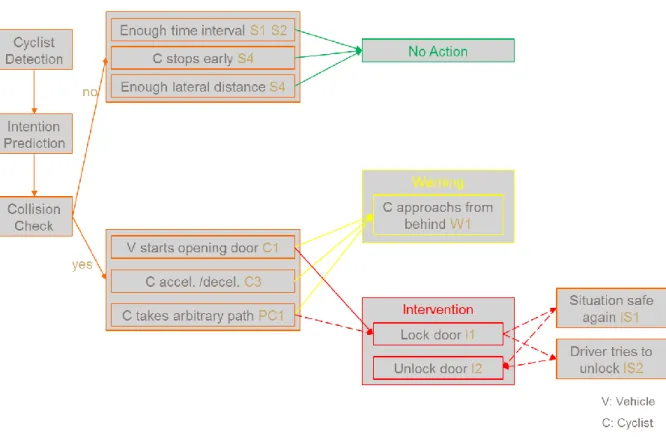
The cyclist wants to continue straight ahead while the vehicle intends to turn to the right. A collision risk occurs when the cyclist starts crossing the road at the instant when the car starts turning to the right. Figure 3 shows the state flow chart for the storyboard of UC_DEM_2.
Page | 8 out of 44
Figure 3: State flow chart for Bosch Demonstrator use case UC_DEM_2
Some scenarios are assessed as being safe (S), so no warning or intervention is required. S1-S4 are the four safe scenarios:
S1) The vehicle is far ahead of the cyclist and turns right in good time before the cyclist reaches the possible collision point.
S2) The cyclist is far ahead of the vehicle and passes the crossover in good time before the car reaches the possible collision point.
S3) The vehicle stops before turning to the right due to right of way for the cyclist. S4) The cyclist stops before passing the crossover due to right of way for the vehicle.
If the scenarios are judged as critical (C), a warning or intervention is needed. C1-C4 are the four critical scenarios.
C1) The vehicle starts turning right while the cyclist is approaching the possible collision point. C2) The cyclist starts passing the crossover while the car intends to turn right.
C3) The vehicle accelerates or decelerates and meets the collision point at the same time as the cyclist.
C4) The cyclist accelerates or decelerates and meets the collision point at the same time as the vehicle.
In C1 and C3 a warning will be given to the driver that a cyclist is ahead shortly. If the driver does not react, an intervention like an autonomous braking or steering will be triggered.
In C2 and C4 a warning will be triggered that a cyclist is approaching from behind.
For these four cases an emergency braking cannot avoid the collision anymore, because the vehicle and the cyclist have already arrived at the collision point. The vehicle will steer straight ahead, or if necessary, to the left when collision is imminent and unavoidable.
Page | 9 out of 44 Some scenarios can be rated as possible critical (PC). For these scenarios a warning or an intervention may be needed or not, depending on how the situation evolves over time. PC1 to PC4 are four arbitrary examples of possible critical scenarios.
PC1) The cyclist approaches the crossing and then decides to turn to the right, too. PC2) The cyclist approaches the crossing and waits for turning to the left.
PC3) The cyclist starts to drive over the crossing by an arbitrary path.
PC4) Both the vehicle and the cyclist wait at the red light and start when the green light turns on. In PC1 the vehicle can warn the driver about the cyclist who is approaching from behind. In PC2 a warning about the waiting cyclist beside can be made. In PC3 a warning about the cyclist ahead and an intervention like braking or steering may become necessary. In PC4, a warning is issued that a cyclist is also waiting beside the red light. If the cyclists starts before the car is accelerating, the car shall stay in a waiting position until the cyclists is gone away.
In the case that it turns out that the triggered intervention degrades the situation by any reason, it shall be immediately cancelled or updated with more appropriate parameters. IC1 and IC2 are two possible intervention strategies candidates where a (more) critical situation may happen by intervention. These intervention strategies shall be avoided by selection of the appropriate intervention.
IC1) The vehicle steers to the left when another road user comes from the opposite direction. IC2) The vehicle steers to a location that is still occupied by another obstacle.
In IC1 a steering causes the conflict with oncoming traffic and in IC2 there is not enough free space for an evasive manoeuvre. In these cases, an intervention by steering shall not be selected to avoid the provoked collision. Instead, a braking strategy shall be selected.
In UC_DEM_4, a vehicle is approaching a crossing and wants to continue straight ahead, while a
cyclist is coming from the left side with the intention to go straight ahead. A collision risk occurs when the car and the cyclist are crossing the road intersection at the same moment. Figure 4 shows the state flow chart of the storyboard for UC_DEM_4.
Page | 10 out of 44
Figure 4: State flow chart for Bosch Demonstrator use case UC_DEM_4
In UC_DEM_7, a vehicle is parking on the street. A cyclist is approaching from behind on a road with
the intention to go straight ahead. A collision risk occurs when the vehicle door is opened on the driver side just at the moment the cyclist is passing by.
In UC_DEM_8, the cyclist is approaching from behind on the cycle lane/sidewalk with the intention to
go straight ahead. A collision risk occurs when the vehicle door is opened on the passenger side at the moment the cyclist is overtaking the vehicle. Figure 5 shows the state flow of the storyboard for these two cases.
Page | 11 out of 44
Figure 5: State flow chart for Bosch Demonstrator use case UC_DEM_7 and UC_DEM_8
In both cases, the vehicle shall activate the central door locking system when the cyclist is approaching from behind and the collision is imminent. The situation is safe again when the cyclist has overtaken the vehicle or stops/turns before overtaking the vehicle. In that case, the control unit shall unlock the door immediately. When the driver or the passenger tries to open the door several times after the locking occurred, the door shall be unlocked due to safety reasons and prevailing regulation (no mandated locking without over-ruling by the driver is allowed).
More details on the Bosch demonstrator storyboard test cases are appended in Annex 8.1 under D7.2_Storyboard_Bosch_Demonstrator.pdf.
2.2 Tests scenarios for Daimler demonstrator
The Daimler demonstrator is planned to be tested in five different use cases, namely UC_DEM_3, UC_DEM_9, UC_DEM_10, UC_DEM_11, and UC_DEM_12. These use cases capture common car-to-cyclist as well as car-to-pedestrian accident scenarios (see Figure 6) in focus.
Page | 12 out of 44 Similar to those proposed by Bosch, the scenarios in each of the addressed demonstrator use case can be further divided into three distinct scenario groups, based on the situation analysis and the risk assessment:
Safe Scenario (S) Critical Scenario (C)
Possible Critical Scenario (PC)
In the following text, the five test scenarios are further explained, and described according to the risk assessment. The possible intervention strategies are defined.
UC_DEM_3, a vehicle is approaching a crossing and wants to continue straight ahead, while a cyclist
is coming from the right side with the intention to continue straight. A collision risk occurs when the car and the cyclist cross the road at the same moment.
In this scenario the vehicle shall warn the driver if a possible collision is predicted and exceeds a certain likelihood. (scenarios C1-4 and PC1-2). Also the presence of a cyclist right next to (or approaching) the car should be indicated if the car does not move (PC3).
Intervention in the form of braking should be triggered if the system predicts an imminent collision (C1-4, PC1-2). A start of the car should be prevented if the cyclist approaches from the side (PC3).
UC_DEM_9, a cyclist is driving on the street. It is assumed the cyclist will continue straight. The
vehicle drives in the same direction and approaches the cyclist from behind with the intention to perform an overtaking.
In this situation the system needs to be able to predict the correct intention of the cyclist. The driver should be warned if the cyclist indicates the intention to perform a left turn, while the distance to the car is critical (PC1). Further a warning should take place if the cyclist slowly approaching the driving corridor of the car (PC2).
If the cyclist makes a left turn in front of the car, the vehicle shall brake (C1).
UC_DEM_10, a vehicle is approaching a crossing and wants to continue straight ahead, while a
pedestrian is approaching from the right side with the intention to cross the street. A collision risk occurs when the car and the pedestrian cross the road at the same moment.
In this scenario the vehicle shall warn the driver if a possible collision is predicted and exceeds a certain likelihood. (scenarios C1-4, PC1-2). Also the presence of the pedestrian right next to (or approaching) the car should be indicated if the car does not move (PC3).
Intervention in the form of braking should be triggered if the system predicts an imminent collision (C1-4, PC1-2). The start of the car should be prevented if the pedestrian approaches from the side (PC3).
UC_DEM_11, a vehicle is approaching a crossing and wants to continue straight ahead, while a
pedestrian is approaching from the right side with the intention to cross the street. However, the pedestrian is occluded by two parking cars. A collision risk occurs when the car and the pedestrian cross the road at the same moment.
In this scenario the vehicle shall warn the driver if a possible collision is predicted and exceeds a certain likelihood. (scenarios C1-4, PC2). Also, the presence of the pedestrian should be indicated during the occlusion time.
Intervention in the form of braking should be triggered if the system predicts an imminent collision (C1-4, PC1-2).
Page | 13 out of 44
UC_DEM_12, a pedestrian is walking on the street. It is assumed the pedestrian will continue straight.
The vehicle drives in the same direction and approaches the pedestrian from behind with the intention to perform an overtaking.
In this situation the system needs to be able to predict the correct intention of the pedestrian. The driver should be warned if the pedestrian indicates the intention to perform a left turn, while the distance to the car is critical (PC1). Furthermore, a warning should take place if the pedestrian is slowly approaching the driving corridor of the car (PC2).
If the pedestrian makes a left turn in front of the car, the vehicle shall brake (C1).
More details on the Daimler demonstrator storyboard test cases are appended in Annex 8.2 under D7.2_Storyboard_Daimler_Demonstrator.pdf.
2.3 Tests scenarios for Continental demonstrator
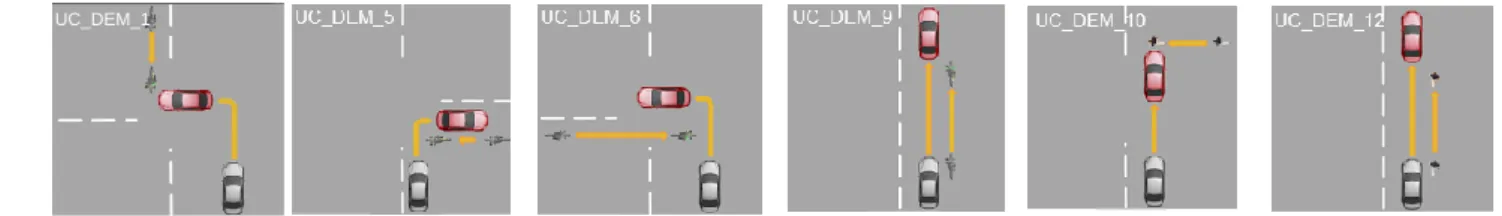
The demonstrator from Continental is planned to be tested in 4 different use cases UC_DEM_1, UC_DEM_5-6, UC_DEM_9 addressing cyclists’ accident scenarios. The additional 2 use cases, UC_DEM_10 and UC_DEM_12 addressing car-to-pedestrian scenarios. (see Figure 7)
Figure 7: Use cases of Continental demonstrator
All use cases, except UC_DEM_1, can either be regarded as longitudinal or crossing scenario, but with different ego velocities. Although the ego vehicle intention is turning in UC_DEM_5 and UC_DEM_6, the hitting point is reached before actually turning. UC_DEM_1 is the only true turning scenario. However, before turning, also UC_DEM_1 is still a longitudinal scenario.
After object detection and classification as a VRU, the next step is to estimate and predict its movement intention (direction and speed) over the time period. Beside the consideration of directly measured object speed and position, other things like active pedaling, acceleration, position history is taken into account.
In all scenarios, it is assumed that the cyclist or pedestrian maintain their speed until the hitting point. Regarding the ego speed, it is assumed that for the turning scenarios UC_DEM_1, UC_DEM_5 and UC_DEM_6 the driver manually reduces the speed with a deceleration of -3 m/s2. In all other scenarios the predicted ego speed is constant.
After the trajectories of the VRU and the ego vehicle are estimated, a decision is made regarding whether, where and when the potential accident (hitting point) might occur. Depending on those parameters, a warning will be activated and afterwards a braking or evading maneuver will take place (or both may occur if needed). The activation threshold for warning is a certain parameter value of calculated time to collision (TTC).
If the driver reacts or the VRU changes the trajectory in a way that the accident is avoided (TTC is steadily increasing or indefinite) the system disengages.
In UC_DEM_1, a vehicle is going to turn left while a cyclist has a straight approach and oncoming
traffic crosses the vehicle path. The cyclist has priority to drive through without reducing its speed and the vehicle should let them continue. A collision risk occurs when vehicle driver does not see the cyclist and continues their manoeuvre without braking. The system reaction besides the warning is
Page | 14 out of 44 braking. The system shall differentiate between the cyclist and the driver actions. The warning shall occur under conditions that the driver does not reduce its speed to avoid the accident, independent of the cyclist movements. If the driver ignores the warning, the brake activation follows to stop the vehicle in front of the cyclist’s predicted path.
In UC_DEM_5, a vehicle is going to turn right on a junction, while a cyclist coming from right side with
the intention to continue straight ahead. A collision risk occurs when the car and the cyclist are crossing the road intersection at the same moment. Generally, the system reaction besides the warning is braking. In this scenario the collision probability is very sensitive to the approaching (predicted) speed of the cyclist and vehicle. A slight change in the cyclist’s (predicted) intentions or the vehicle speed can completely avoid the accident. Therefore, an early warning is issued to attract the driver’s attention to a potential danger. If the situation becomes clearer, neither the cyclist nor the driver changed their intentions and the collision is almost unavoidable (the last point to brake is almost reached) the late warning is issued to provide the driver with information and the system initiated braking follows afterwards. This intervention strategy is helpful to avoid unnecessary system interventions and increase the system acceptance.
In UC_DEM_6, a vehicle is going to turn left on a junction, while a cyclist approaches from the left side
with the intention to continue straight ahead. A collision risk occurs when the car and the cyclist are crossing the road intersection at the same moment. The scenario is similar to the UC_DEM_5, with the exception that the vehicle speed at the hitting point is likely to be higher, since the vehicle is still approaching to its turning point, while in UC_DEM_5 the vehicle collides with the cyclist almost at its turning point. Despite this difference, the system reaction is similar. The system intervention by braking occurs harsh and at the last point to brake, providing an imminent collision warning shortly before that. An early warning is issued at a higher TTC to give the driver the chance to slow down or inform the cyclist about the danger.
UC_DEM_9 is already described in section 2.2. In this scenario, the accident prevention strategy by
Continental demonstrator is to gain as much as possible lateral distance to the cyclist without leaving the lane. This can be done by an evasive manoeuvre, if the driver does not react to an early warning and the vehicle is laterally closer than ca. 0.5m to the cyclist. Additionally, a deceleration to a safer passing speed is initiated, if the vehicle speed is above the threshold. In case the driving lane is not identified or there is not enough lateral space to pass the cyclist safely, a collision warning occurs and braking is issued to slow down the vehicle to the cyclist’s speed.
UC_DEM_10 is also described in chapter 2.2. This case is already addressed by state of the art active
VRU protection systems by issuing the collision warning and braking. At higher vehicle speeds the accident cannot be completely avoided, in particular when the pedestrian movement toward the street cannot be predicted in advance (even if the pedestrian is detected early by environmental sensors). The Continental strategy is to initiate an early lateral shift of the vehicle to the left within lane after the early warning. Additionally, the vehicle is slowed down to the safe speed to give the driver a better chance to react, if the pedestrian does not change their mind in crossing the street.
In UC_DEM_12, as described in section 2.2 the Continental accident avoiding strategy is similar as in
UC_DEM 9. The differences are in the selection of thresholds and manoeuvre parameters, since a pedestrian normally has slower walking speeds than a cyclist.
Page | 15 out of 44
2.4 System performances
The Bosch demonstrator will be tested in the diverse scenarios indicated in section 2.1. The behaviour like the velocity, distance and offset of the vehicle and cyclist will be defined, so that the Safe Scenario, Critical Scenario and Possible Critical Scenario can be realized on the test tracks. In each scenario, the test can be repeated more times and the reaction of the systems will be recorded. According to the real situation criticality and the system reaction, each test result can be evaluated as false positive, false negative, true positive and true negative. By comparing the numbers of the four test result types, the sensitivity (true positive rate), specificity (true negative rate) and precision (positive predictive value) can be calculated and used to evaluate the performance of the systems. By tuning the parameter and threshold of the systems, the performance will be improved to a high level, which means better sensitivity and less false triggers.
The classification of the possible system reactions can be defined as follows: - False positive:
o The system shows a reaction (i.e. braking and/or steering) that is superfluous and not needed in a given scenario
o Driver may become confused or has a disproportionate reaction
o The false positive rate, that still may be accepted or tolerated by the driver, depends on the prevailing system function and environmental conditions and should be kept to the absolute minimum (i.e. zero).
- False negative:
o The system shows no reaction (i.e. braking and/or steering) where an intervention is mandatory. The driving situation becomes critical and will end up in an accident with a missing driver reaction
o The false negative rate shall be zero to avoid any collision or harm to the driver and other road users.
- True positive:
o The system reacts adequate as needed in a critical situation
o What happens if the driver already initiates a (different) manoeuvre (risk awareness)? o True positive rate shall be (near to) 100%.
- True negative:
o No system reaction necessary due to non-critical scenario o No conflicting trajectory present to activate the system
o Result is similar to system deactivated, where no intervention may happen at all (but also provides no protection against critical situation).
While true positive and true negative are the normal, “expected” system reaction cases, the false positive and false negative represent a system malfunction or weakness to detect the correct situation and its criticality. Both these values shall be as low as possible, whilst keeping the true positive and true negative cases as high as possible.
For warning systems, typically higher false values are accepted, compared to intervention systems that have a direct impact on the driving situation and conditions.
Page | 16 out of 44
3 Towards an acceptance model
In the literature (see D2.2 for a review), acceptability is generally distinguished from acceptance.
Acceptability is measured when the person has no experience of the system, and is therefore an
attitude construct (Schade and Schlag [1], 2003). It is an “a priori measure of the extent to which a person thinks they will accept and use a particular system and may be manifest even before a user has any experience with the system”. Acceptance, on the other side, can only be determined after use and is a measure of how much a person actually uses a technology and the satisfaction with this experience”. It consists of attitudes and behavioural reactions after the introduction of a technology. Jamson [2] (2010), in other words, defines acceptability as “how much a system is liked” and acceptance as “how much it would be used”.
Payre [3] (2014) uses the concept of “A priori” acceptability for acceptance tested before any use. He showed that the intention to use fully automated driving can be predicted by attitudes, personality and behavioural adaptation to automated driving, “a priori” acceptability being defined as “the evaluation of that technology before having interaction with it”.
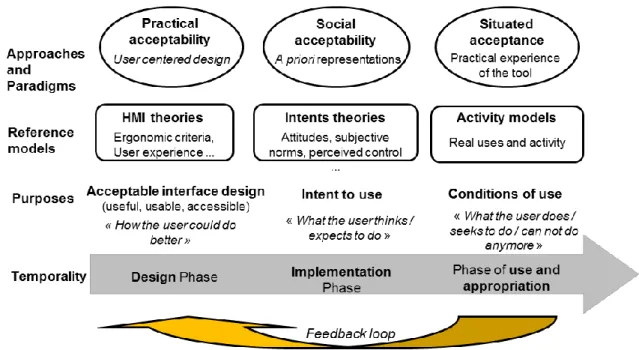
In another framework, Bobillier Chaumon [4] (2016) considers acceptance as a process that starts from acceptability and goes to appropriation, where “appropriation would be an initial condition of technological acceptance.” Because an individual can appropriate a tool, they can give it a meaning and therefore accept it. Bobillier Chaumon [4] proposed a triangulated model (see figure below) composed of: social acceptance, practical acceptance and situated acceptance. To evaluate the technological adoption of a tool, the model relies on technological factors, on the activity and on task factors and perceptual factors.
In this model, the notion of situated acceptance, is defined “as the way in which individual perceives the issues related to these technologies (strengths, benefits, risks, opportunity) through their use in everyday situations, and reacts to them (favourably or not).” (Bobillier-Chaumon and Dubois [5], 2009).
Figure 8 Bobillier-Chaumon model of acceptance (2016)
Such a distinction is important in PROSPECT because only the first steps of acceptance can be tested within the timescales of the project.
Page | 17 out of 44 Another important issue relates to the acceptance stability over time. This has been assessed within the EuroFOT project (http://www.eurofot-ip.eu/). In this project, questionnaires were administered at three time points (before using, after having experienced the system, and at the end of the data collection). The project concluded that despite some cases, acceptance remained stable for at least several systems (specifically ACC - Adaptive Cruise Control -, FCW - Forward Collision Warning -, BLIS - Blind Spot Information System -, IW - Impairment Warning).
3.1 Model of driver acceptance
The Task will utilise the theoretical model of driver acceptance developed in Task T2.3 to assist in the planning for specific evaluation studies that are conducted. Consequently, it will be possible to validate the model under realistic driving situations. Using this model, the Task will investigate the acceptance of all PROSPECT warnings and interventions after having defined a common methodology to use for drivers’ acceptance testing in T7.1 and T7.2.
In the literature review presented in D2.2, we concluded that the following nine factors will have a significant impact on the users’ trust (and ultimately their acceptance) of the collision avoidance technology being developed in the project:
1. Perceived risk – whether users believe that using the system (or not using the system) will have a positive or negative impact on their safety. This factor is closely aligned with a user’s individual sense of control – i.e. the extent to which a driver believes that they could have dealt with the situation themselves.
2. Reliability – the ability of the system to perform as expected. The occurrence of false positives (system warning/responding when the situation didn’t require it) is a key consideration here for the project.
3. Predictability – whether the system’s behaviour matches the expectations of the user. 4. Timing – the point at which the intervention (warning and/or braking/steering) occurs
5. Interface design – especially the transparency of the HMI when faults occur. An HMI with transparency should highlight the logic used by the automated system, ultimately to assist a human operator in their understanding about what a system is trying or tried to do.
6. Dependability – the frequency of automation breakdowns and error messages
7. Individual and demographic factors – various individual characteristics have been demonstrated to effect user trust, including gender, age, cultural background, personality, etc. 8. Privacy – the handling of any personal data associated with the use of the automated system 9. Security – the technical guarantees that ensure measures against threat of intentional attack
on the system/software
These factors form the basis of the theoretical model of driver acceptance. Although it has not been possible to consider all of these factors within the timescales of the PROSPECT project, research studies (conducted and ongoing) have focussed on the first five factors: perceived risk (control), reliability, predictability, timing and interface design.
The first driving simulator study reported in D2.2 considered primarily the occurrence and frequency of false positives for collision warnings with pedestrians. The study revealed that although drivers are likely to stop sooner and apply more gradual braking force if warnings are presented earlier – thereby providing a greater safety margin between vehicle and pedestrian - warnings that are provided too early (or indeed, too late) are likely to annoy drivers due the high potential for false alarms, and thereby inspire lower levels of confidence in the technology.
Furthermore, ongoing research is considering a broader range of the aforementioned factors in the context of a complete collision avoidance system, i.e. a system that warns and brakes in response to a potential collision with a vulnerable road user - in this case a pedestrian. A focus will be placed on
Page | 18 out of 44 issues related to HMI transparency, specifically whether the HMI can mitigate for problems associated with false positives (e.g. driver awareness, acceptance, trust etc.).
The aims of the study are:
- To understand the implications of HMI transparency on trust and acceptance for collision avoidance/warning systems.
- To provide further inputs to our predictive model on the implications of false alarms/positives on trust/acceptance ratings.
The results of this study will further inform the model of driver acceptance. The model (and in particular the first four factors: perceived risk (control), reliability, predictability and interface design) will subsequently be used to assist in the planning of specific studies that are conducted as part of the PROSPECT evaluation trials.
Page | 19 out of 44
4 Methodology for acceptance testing
Questionnaires are generally used to evaluate subjective components of constructs, such as acceptance and trust. The methodology developed in Task 7.3 will be based on common questionnaires to be administered in tests and experiments that will evaluate PROSPECT systems. By using common questionnaires, this task will aim to enable an overall evaluation of the acceptance of the developed functions.
4.1 Research questions
Results from these questionnaires will allow the project to answer the following research questions: 1. Does experience of the system influence its acceptability/acceptance (acceptability a priori
different from practical acceptability)?
Acceptance will be evaluated at two time points: before having used the system (acceptability a priori) and after having experienced the system (practical acceptability).
The fact that participants are familiar or not with the developed system, are experts or a normal driver will influence the acceptance of the systems. The selection of the test participants is therefore an important issue to consider.
Another important issue is that tests of acceptance are generally administered towards system used
during a certain time. Systems like those developed in PROSPECT project are supposed to be
activated only in extremely rare situations and their acceptance will be highly dependent of the moment of the activation.
2. Does the type of warning/intervention have an influence on the acceptance?
Various solutions of feedback including haptic, visual and auditory HMIs have been investigated within WP2 (see the taxonomy developed in D2.2). According to the configuration of the situation and the risk assessment (safe scenario, critical scenario, and possible critical scenario) one solution is likely to be better accepted than another one. The type of warning will consequently be an important issue to consider during the tests and experiments.
The type of intervention may also influence the system acceptance. A steering might be less accepted than an emergency braking intervention if the driver is not aware of the high level of criticality of the situation. For warning systems, typically higher false alarm values are accepted compared to intervention systems, which have a direct impact on the driving situation and conditions.
3. How acceptance is influenced by the performance of the system?
False alarms may lead to unpredictable reactions from un-aware drivers potentially frightened at the moment the system is activated. However, the warning and intervention of the system have to be distinguished, as a false positive may have more critical consequences in case of a steering, than in the case of a warning. Acceptance of false warnings should be higher than the acceptance of false interventions.
4. Is there a level of false alarm that can be acceptable?
University of Nottingham has shown (Deliverable 2.2) that there is a margin regarding the acceptance of a warning (between very long and shorter Time To Collision) within which acceptability can be rated the highest. The driving simulator study reported in D2.2 considered primarily the occurrence and frequency of false positives for collision warnings with pedestrians. During this study, warnings were presented in response to pedestrians who approached the roadside, and comprised either as a static visual alert icon presented on a HUD and/or auditory icon. The number of accurately detected pedestrians (i.e. those who entered the roadway rather than waiting at the kerbside) decreased with increasing time-to-collision (TTC), giving rise to ‘false positive alarms’. Subjectively, participants associated the highest level of trust, confidence and desirability, and lower levels of annoyance (all measures were captured using subjective questionnaires after each drive), when warnings were presented at intermediate TTCs (3.0 and 4.0-seconds, corresponding to relatively high false-alarm
Page | 20 out of 44 rates of 40% and 60%, respectively); trust and confidence reduced significantly with both increasing and decreasing TTC. Driving performance data show that earlier warnings encouraged drivers to begin braking sooner and apply braking force more gradually, ultimately stopping further from the pedestrian - on average 15.25m following 5.0-second warnings compared to 3.45m with 2.0-second warnings. Nevertheless, evidence suggests that some drivers may have disregarded the system at longer TTCs, choosing to rely on their own judgement. Overall, results suggest that, although drivers are likely to stop sooner and apply more gradual braking force, if warnings are provided earlier - thereby providing a greater safety margin between vehicle and pedestrian - warnings that are provided too early (or indeed, too late) are likely to annoy drivers and inspire lower levels of confidence in the technology.
5. How does perceived risk influence the acceptance of the system?
The more a driver perceives a situation as being critical, the more likely it is that an assistance system will be accepted.
According to the criticality of the use cases, acceptance may vary. When the perceived risk is high, then the acceptance of an intervention of the system will be better. In case the perceived risk is low, the system might be less accepted.
The risk perceived will also be influenced by the driver’s control over the situation. When the driver thinks they are able to react correctly themselves without having an accident, a system intervention will be less accepted than if the driver thinks he/she cannot handle the situation on their own.
6. Is there a difference between subjective criticality of the situation and subjective
controllability?
Even though a situation seems critical, it does not directly mean that the driver is not feeling in control of the situation. It is important to understand the effect that subjective criticality has on the feeling of controllability by the driver. When the driver relates criticality with poor controllability, then it is important that the system reacts as soon as a situation becomes critical. Otherwise, if the driver does not relate criticality with controllability (i.e. a situation might be critical but the driver still feels in control), it is important that the warning/intervention system does not react too promptly. There might be a feeling of rejection by drivers when they feel in control at the time the activation occurs.
7. What is the mental model of drivers about safety systems and how they change after using
the system?
Mental models give a broader explanation of the expectations of the drivers in terms of the capabilities and limitations of the system as well as his/her abilities. Mental models create a connection between reality and preconceived concepts by a person. In this study, every participant will have a mental model regarding the critical situation and the ADAS. In such mental models, drivers focus on what they consider important, i.e. they could talk about how much they felt in control of the situation, if the system acted correctly or in time, etc. This can lead to having an insight into the expectations of drivers’ regarding the limitations and capabilities of the systems. This could help in the design of the systems. Also it is important to analyse how the mental models of the drivers change after experiencing the system, once they have experience of the real capabilities and limitations of the system.
4.2 Questionnaires used in the literature
Different scales have been designed in the literature to evaluate trust and acceptance. The following ones are relevant to the PROSPECT system testing.
4.2.1 Usefulness/satisfaction scale (Van der Laan et al. 1997)
Van der Laan et al. [6] (1997) developed a scale that measures acceptance “by direct attitudes toward a system, attitudes being defined as predispositions to respond, or tendencies in terms of ‘approach/avoidance’ or ‘favourable/unfavourable’”. They provide an evaluation in two dimensions: a usefulness scale, which reflects practical aspects, and a satisfying scale. Such dimensions are very important for acceptance evaluation. In their model of acceptance, Ghazizadeh et al. (2012) [7]
Page | 21 out of 44 demonstrated that ‘perceived usefulness’ played the most important role in determining drivers’ intention to use a technology.
Törnros et al. [8] (2002) used this scale in a moving base simulator to measure acceptance of an ACC system in motorway and rural road driving. Regarding user acceptance, the participants reported the ACC to be quite useful and quite pleasant to use.
Dogan et al. [9] (2014) used the same scale to examine the drivers’ acceptability of a Traffic Jam Assist (TJA) system. The scale was administered twice, before having tried the system in a dynamic driving simulator and at the end of the study. Results showed that the acceptance of TJA increased in terms of usefulness after having experienced the system.
Bazilinskyy et al [10] measured self-reported usefulness and satisfaction using the Van der Laan’s questionnaire in driving simulator experiments. They compared different modalities of take-over requests in highly automated driving. Their study showed that vibrotactile takeover requests yielded relatively high ratings of self-reported usefulness and satisfaction, while auditory requests were regarded as useful but not satisfactory. Participants as neither useful nor satisfactory regarded visual-only feedback. Finally, augmented visual feedback was found to support effective steering and braking actions, and may be a useful complement to vibrotactile take-over requests.
The questionnaire was also used by Van Driel [11] (2007) to measure the perceived usefulness and satisfaction of a Congestion Assistant system. Such a system consists of a mix of informing, assisting and controlling functions that support the driver during congested traffic situations on motorways. The participants had to fill in checklists before the driving simulator experiment, after driving with the system under normal visibility, and after driving with the system in the fog. In general, the participants appreciated the Congestion Assistant and acceptance of the system increased significantly after having gained experience with it.
These experiences of the usefulness/satisfaction scale show that administering it before and after having interacted with the system facilitates an understanding of the evolution of user acceptance.
1 Useful |__|__|__|__|__| Useless 2 Pleasant |__|__|__|__|__| Unpleasant 3 Bad |__|__|__|__|__| Good 4 Nice |__|__|__|__|__| Annoying 5 Effective |__|__|__|__|__| Superfluous 6 Irritating |__|__|__|__|__| Likeable 7 Assisting |__|__|__|__|__| Worthless 8 Undesirable |__|__|__|__|__| Desirable 9 Raising Alertness |__|__|__|__|__| Sleep-inducing
Figure 9 Usefulness/satisfaction scale (Van der Laan et al., 1997)
Regarding PROSPECT systems, these dimensions should allow for understanding how the driver sees the system in terms of its usefulness and desirability. It could also give some additional information on how the system supports the driving task and the extent to which the driver thinks it increases safety.
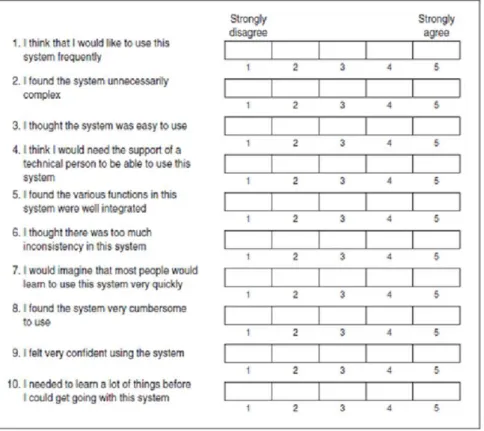
4.2.2 System Usability Scale (Brooke, 1986)
The usability of a system is also a useful dimension for measuring acceptance. Brooke [12] (1986) developed the System Usability Scale (SUS) to evaluate systems as a “quick and dirty” method.
Page | 22 out of 44 This scale consists of a 10 item questionnaire with five response options for respondents (from strongly agree to strongly disagree).
Figure 10: System Usability Scale (Brooke, 1986)
Eyben et al. [13] (2010) used Brooke’s scale to assess the acceptance of driving assistance systems that utilised emotion-oriented technology. After finishing the experiment, every test subject was asked to fill out the System-Usability-Scale. The SUS scale showed good results regarding the use of the system despite the prototypical setup of the system.
While investigating two driving interfaces, Gauerhot et al. [14] (2015) used this scale to investigate drivers’ willingness to cooperate with automated cars. Whereas automated cars allow for sharing information, conventional vehicles lack such information exchanges. The scale was administered after each test drive. To evaluate user acceptance and system trust, Gauerhot et al. also used the trust scale by Jian et al. [15] and the acceptance scale by Van der Laan et al. [6]. Results showed that both systems were perceived to be useful. Participants also gave the system a high rating on the trust scale. However, the results revealed the necessity of an adaption period in order to get used to gesture and touch controls.
Even if usability is important for acceptance testing, it might be difficult to assess this characteristic in relation to PROSPECT functionality. At this stage of the project, only components of the system will be tested. Participants will certainly not gain a global view of the system and of its overall functioning. Only the first question, which addresses intention to use, appears to be relevant for PROSPECT system acceptance testing.
Page | 23 out of 44
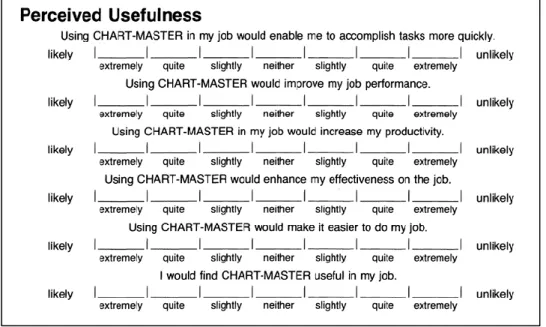
4.2.3 Perceived Usefulness and Perceived Ease of Use scale (Davis, 1989)
According to Ghazizadeh et al. [7] perceived ease of use has an effect on the intention to use, accounting for both perceived usefulness and trust. From their model, this dimension is linked to the ability to use the system successfully with minimal effort and to the understanding of its use.
Davis [16] developed two new scales focused on perceived usefulness and ease of use, which are hypothesized to be fundamental determinants of user acceptance.
Figure 11: Perceived Usefulness scale (Davis, 1989)
Page | 24 out of 44 Höltl and Trommer [17] (2012) used items based on Davis’s questionnaires (1989, [16]) to assess six ADAS functions to investigate the drivers’ perceptions of cooperative systems that offer assistance on fuel efficiency. All ADAS functions were assessed for pre-, on-, and post-trip driving situations. They also included in their model questions on perceived efficiency and expected changes in driving behaviour. The results showed differences in terms of acceptance that were explained using the four acceptance factors.
In another study based on the Technology Acceptance Model (TAM), questionnaires were designed to assess driver acceptance of Intelligent Transport Systems (ITS) interventions. Larue et al. [18] (2015) used three items from the TAM to assess the driver acceptance of such systems in the context of railway level crossings. All three assessed the perceived usefulness of the technology and its perceived ease of use.
4.2.4
Scale of trust between people and automated system (Jian et al.
2000)
The drivers’ trust in the system is a crucial aspect of the acceptance evaluation of the PROSPECT systems. An empirical scale was developed by Jian et al. [15] (2000) with that aim. This scale proposes 12 potential factors of trust between people and automated systems.
Page | 25 out of 44 Figure 13: Jian et al. Scale of trust between people and automated system
Verberne et al.,[19] (2012) examined with this scale whether trust in smart systems is generated analogously to trust in humans and whether the automation level of smart systems affects trustworthiness and acceptability of those systems. They used the Jian et al. scale with descriptions of three different ACC system. ACC systems that shared the driving goals of the user were found to be more trustworthy and acceptable than were ACCs not sharing the driving goals of the user. Furthermore, ACCs that took over driving tasks while providing information were rated to be more
Page | 26 out of 44 trustworthy and acceptable than ACC systems that took over driving sub-tasks without providing information.
Beggiato and Krems,[20] (2013) used the same scale to assess trust in an ACC system in a driving simulator. Results regarding trust and acceptance of the system showed an effect of the initial information. The more potentially critical the situations presented in the preliminary information, the less participants rated the initial trust and acceptance of the system. Accordingly, while the over-informed incorrect group showed the lowest scores for trust and acceptance in the beginning, the incomplete group tended to trust and accept the ACC the most, initially.
To investigate the impact of visualizing the uncertainty of the vehicle automation on drivers’ trust during an automated driving scenario, Helldin et al.,[21] (2013) used a modified version of the trust in automation scale. The analysis of trust showed that participants who were provided with uncertainty information trusted the automated system less than those who did not receive information.
Both studies show the importance of the information given before using a system. This will be an important issue to consider in the design of the PROSPECT system evaluation.
4.2.5 Risk awareness measurement (Bellet, Banet, 2012)
Another important aspect for acceptance measurement is the feeling of the drivers on the situations they have been faced with during the tests, more specifically to their risk awareness and the strategies they would have used in such a situation.
A tool has been developed by Bellet and Banet [22] called CRITIC (Common RIsk awareness measurement meThod for Inter-population Comparisons). This tool was used in the 2-BE-SAFE project to investigate risk awareness in different driving situations, among different populations of motorcyclists. In this framework, the risk awareness refers to the ability of the motorcyclists to perceive hazard including their abilities in criticality assessment of the driving situation.
This tool was used in a video experiment, where the drivers were asked to assess different situations, by using scales. The following factors, which influence the risk awareness were investigated:
- A criticality scale allows for assessing the criticality of the driving situation. This is a subjective assessment of the situational risk, which requires the perception of the critical event and the evaluation of the danger of this threat.
- The predictability of the situation is assessed in terms of frequency (the type of situation is frequent or not) and its foreseeability (such an event is foreseeable or unexpected).
- The situational controllability refers to the participants’ assessment of their abilities to adequately manage the situation and avoid the accident.
- The participants’ emotional feeling allows for taking into account the effect of the situation on the driver (fear, stress).
- The last situational dimension assessed is the feeling of responsibility of the driver when faced to the situation.
These dimensions are very important in the acceptance evaluation of PROSPECT systems, as the risk perceived by the driver, in a given situation should influence the acceptance of the system. The more the driver perceives the situation as being critical, the better the system will be accepted. The risk perceived will also be influenced by the driver’s control over the situation. When the driver thinks they were not able to react correctly and the situation would lead to an accident, a system intervention might be better accepted than if the driver thinks he/she could have handled the situation on his/her own.
Page | 27 out of 44
4.2.6 In summary
Table 1: Comparison table
Questionnaire Literature How
administered? What ADAS examined? What is measured? Drawbacks Usefulness/ Satisfaction Scale
By Van der Laan et al., 1997
Dogan et al., 2017
Before and after experiment
Traffic Jam Assist How useful, pleasant, annoying, effective the system is
A bit long, can be used only before and after the test Only relevant items will be taken up
Not to be administered after each event
Possibly constricted (participants not able to fully explained why they like/dislike), no justification of the items Tornros et al., 2002 Not explained in the paper ACC Van Driel, 2007
Before and after the experiment Congestion Assistant System Gauerhot et al., 2015 Bazilinskyy et al. 2017
After each test drive After tests Assistance system (manually driven) Modalities of take-over requests System Usability Scale By Booke, 1986 Eyben et al., 2010 After the experiment Assistance based on emotion-oriented technology Usability of a system Like Usefulness/Satisfaction Scale – Maybe difficult to measure for system under development
Only one or two items to select Gauerhot et
al., 2015
After each test drive 2 driving interfaces investigated to test drivers’ willingness to cooperate with automated cars Perceived Usefulness and Perceived Ease of Use scale By Davis, 1989 Höltl and Trommer, 2012
Before and after the experiment
Six ADAS functions Usefulness and how easy it is to use
Same as the two above
Larue et al. 2015
After each test drive
ITS of railway level crossing Scale of trust between people and automated systems By Jian et al., 2000 Verberne et al., 2012 Written. After experiment.
ACC Trust of the driver towards the system, reliability of the system
A bit long, can be used only before and after the test Only relevant items will be taken up
Not to be administered after each events Beggiato & Krems, 2013 ACC Heldin et al 2013 Automated driving Gauerhot et al., 2015 Assistance system (manually driven) Risk awareness measurement By Bellet & Banet, 2012 Bellet & Banet, 2012 After each sequence (Visual) Risk awareness, criticality, predictability, controllability, feelings
Page | 28 out of 44
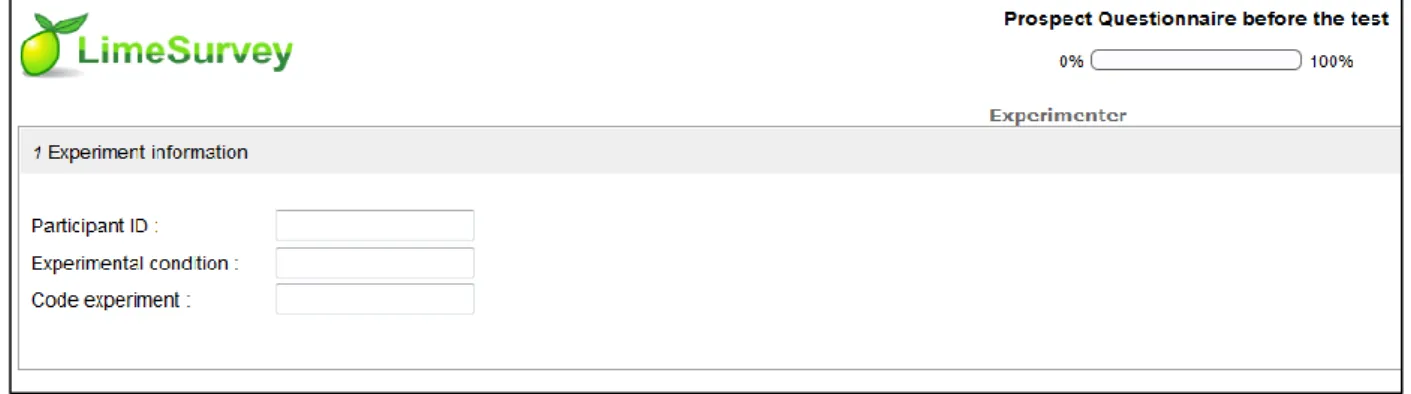
4.3 PROSPECT Questionnaires
In the PROSPECT project, questionnaires have been developed based on existing scales such as those described above. An on-line tool has been developed at IFSTTAR for data collection using LimeSurvey. This tool makes possible to answer the questionnaires on a phone, a tablet or a computer, to the convenience of the experimenters. Such a tool ensures the questionnaire is not too invasive during the tests, in order to minimise disturbance of participants.
In order to balance user acceptance to the robustness and performance of the tested systems, all answers to the questionnaires will have to be linked to the PROSPECT functions tested and to the quality of the PROSPECT systems functioning.
In some cases, the questionnaires will be adapted according to the objectives of the tests run. For example, the questions regarding steering of the system will be skipped for Daimler tests, since an artificial steering response is not possible with the Daimler demonstrator.
Three questionnaires are administered at different times of the tests:
- Before running the test/experiment: questionnaire 1 (participant information) and 3 (global
expected acceptance of the system or a priori acceptability).
- During the test/experiment: questionnaire 2 (feedback on each situation, the participants are
being faced with).
- After the test/experiment: questionnaire 3 (global acceptance of the system after having
experienced it).
Before administering the first questionnaire, the experimenter must give sufficient information about the functioning of the system to the participants. This information will allow the driver to gain some familiarity with the system and to create a mental model of what will be tested.
4.3.1 Questionnaire 1 - Participant’s information (BEFORE)
This part will collect general information about participants such as their driving habits (mileage), their use of ADAS, their general attitude towards new technologies and safety in-car systems and their interest in using automated system for driving.
Description of the items:
At each page, the participant can use some boxes in the bottom of the screen to exit the survey, resume the questionnaire later, or go to the next screen.
A first screen give the experimenter the possibility to write relevant information about the test.
Then, the participants provide general information (gender, age, driving licence…, familiarity with in-vehicle technologies...).
Page | 30 out of 44 How familiar are you with the following in-vehicle technologies?
At which level of automation would you be ready to drive?
- I would enjoy driving a fully automated car: the car drives alone without any driver intervention
- I would enjoy driving a highly automated car: the driver does not need to monitor the road permanently, but can be requested by the system to take-over the control
- I would enjoy driving a partially automated car: the system operates part of the driving is operated by the system, but the driver must monitor the driving permanently)
- I enjoy manual driving
Likert scales are generally used to enable respondents to indicate their level of agreement with a statement. However, to make it easier to compare conditions, continuous scales have been developed for the PROSPECT questionnaires.
4.3.2 Questionnaire 2 - Feedback on events (DURING)
This short section is completed after each event (or series of events) that the participants are faced with during the test/experiment (several times in each test/experiment). Although it is preferable to administer it during the experiment, it can be possible to provide it at the end, using video auto-confrontation.
Page | 31 out of 44 This part focuses mainly on the dimensions of criticality, predictability, controllability and on drivers’ feeling of the situation (see CRITIC scales above).
Page | 32 out of 44 Some questions on the driver behaviour are also added to collect information on what the participant feels they would have done in each situation (keep going, brake, steer) and whether they accept the behaviour of the PROSPECT system.
In case explanations are needed, they can be given at the end of the experiment using auto-confrontation.
4.3.3 Questionnaire 3 - Acceptance of the system (BEFORE & AFTER the
experiment)
This part focuses on the acceptance of the system by the driver through different dimensions already used in the literature. It is administered at a minimum of two time points during the test period in order to measure changes in acceptance as a result of the system experience:
- First, before any interaction with the system, but after having a short presentation of it - Second, after having interacted with the system
Page | 33 out of 44 For each of the following items, the participants will use similar scales to express which of the 2 items is the closest to what they think, by positioning the cursor where relevant. As an example, in the first case they will indicate how they feel the utility of the system from useless (on the left) to useful (on the right).
These items refer to the Perceived usefulness, and Perceived satisfaction described above (Van der Laan et al. 1997) and Perceived ease of use.
Page | 35 out of 44
Trust (see Jian et al. 2000). The scale below will be used to assess all the following components of
Page | 36 out of 44
Intention to use. The scales below will be used to assess all the following issues related to intention