SYNTHÈSE
REVUES
médecine/sciences 2018 ; 34 (focus issue, F1) : 121-32
médecine/sciences
Exploring the
dynamic changes
between pulmonary
and cutaneous
sarcoidosis based
on gene expression
Youyu Sheng1*, Yuxin Yang2*, Yun Wu3*,
Qinping Yang1
>
Sarcoidosis is a disease involving the growth
of abnormal inflammatory granulomas and
affecting multisystems. It has an unknown
etio-logy. The lung and the skin are the most
com-monly involved organs. Although large amounts
of research have focused on the pathogenesis
of sarcoidosis, little is known about the link
between cutaneous sarcoidosis and pulmonary
sarcoidosis. Moreover, the gene expression
pro-files provide a novel way to find diagnostic or
prognostic biomarkers. Therefore, the aim of this
study was to analyze the differentially expressed
genes (DEGs) in pulmonary sarcoidosis and
cuta-neous sarcoidosis patients and to compare them
to healthy individuals. DEGs and their
biolo-gical functions are dynamically dysregulated,
and several common disease-related genes and
mutual disease progression-related genes were
identified which linked pulmonary sarcoidosis
and cutaneous sarcoidosis together. The
bio-logical functional pathways regulated by these
DEGs may allow to define the common mechanism
shared by different type of sarcoidosis, providing
novel insight into the common pathogenesis of
sarcoidosis and opening the way to the
develop-ment of new therapeutic strategies. <
Key words: biological pathways, common
disease-related genes, cutaneous sarcoidosis,
progres-sion-related genes, pulmonary sarcoidosis.
asymptomatic stage to a life-threate-ning condition. In a minority of cases,
sarcoidosis may cause fibrosis of involved organs, leading to permanent organ damage that will not respond spontaneously or poorly to treat-ments [7-9]. Sarcoidosis is rarely fatal with an age- and sex-adjusted mortality rate of less than 5/1,000,000 in the United States. However, it appears that the death rate from sarcoidosis is rising [10]. The majority of deaths result from pulmonary sarcoidosis where pulmonary fibrosis and/or pulmonary hypertension developed [11, 12], although it usually progresses slowly over decades [13].
Mounting research has focused on the pathologic mechanisms of sar-coidosis. It is suspected that exposure to one or more extrinsic antigens in a genetically susceptible individual leads to the overactivation of inflammatory pathways that promote the formation of sarcoidal granu-lomas. Studies have found an elevated risk of sarcoidosis in individuals who have been exposed to microbial agents [14, 15] and environmental substances [16, 17]. Disease susceptibility may be genetically determi-ned, and several genes affecting the prevalence and course of sarcoi-dosis have been identified. Specifically, human leukocyte antigen (HLA) genes have been shown to influence the development and progression of sarcoidosis [18]. Cytokines like TNF-α, IL-12 and interferon gamma (IFN-γ) have been revealed to be involved in the formation of sarcoido-sis [1, 19]. TGF-beta/Smad pathway is involved in the pathogenesis of pulmonary sarcoidosis [20]. The known mechanisms include inflamma-tion, granuloma formainflamma-tion, genetic polymorphism etc., but the primary cause of sarcoidosis remains unclear.
1Department of Dermatology, Huashan Hospital, Fudan University, 12 Middle Wulumuqi Road, Shanghai 200040, China. 2Department of Dermatology, The People’s Hospital of Jianyang City, Sichuan Province, China. 3Department of Dermatology, The First Hospital of Jiaxing, Zhejiang Province, China. *These authors contributed equally to this work.
Corresponding author: Qinping Yang
Introduction
Sarcoidosis is a multi-organ disease characterized by the presence of immune granulomas with uncertain etiology [1, 2]. The pulmonary involvements account for 90% to 95% of cases [3], and skin lesions are present in at least 20% of sarcoidosis cases [4, 5] and are the initial disease manifestation in nearly one third of these sub-jects [6]. The severity of sarcoidosis may range from an
Functional dynamic deviation scoring
Differentially expressed genes of the three groups were linked to different biological progresses. We used the Euclidean distance of quantitative method to calculate each significant GO term relative to the normal state of the skin, the dynamic functional variety under the stages of non-lesion and lesion sarcoidosis [25].
A P
( )
=
(
−
)
=∑
1
2 1N
iX
iY
i NA (P) represented deviation score of function P; N showed the number of differentially expressed genes in that function; Xi was the mean expression level of gene
i in the non-lesion/lesion sarcoidosis; Yi was the mean
expression level of gene i in normal skin. Through cal-culating the Euclidean distance and cumulative sum of all the genes in function P under the non-lesion/lesion sarcoidosis and normal skin, the degree of function P deviating from the normal state under the non-lesion/ lesion sarcoidosis was figured out.
Feature selection
The intersections of disease-related genes and disease progression-related genes between PSC and CSC were applied as features, the gene expression levels were applied as feature values and both were combined with machine learning RFE algorithm for feature selection. Feature set was obtained through combination of a number of iterative features extracted in the process of selection. Feature set number increased gradually, thus making it possible to evaluate efficiency of the highest corresponding feature set, enabling feature selection.
Construction of a SVM classification model
The genes optimized by feature selection were applied as biomarkers to classify patients with PSC or CSC, using the classification of support vector machine (SVM) model. A five-fold cross-validation was performed. All samples were randomly divided into five groups, four of which being used as training set, the other one as test set. Each sample was then used as test set for prediction. A ROC curve was finally used to evaluate the effectiveness of the model.
Results
Analysis of mRNA expression profiles
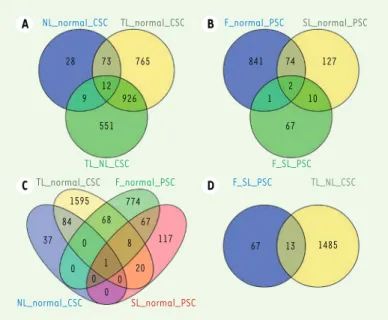
We found 1,903 differentially expressed genes (DEGs) between CSC patients and normal control, and 1,498 DEGs between TL_CSC and NL_CSC patients. For the PSC, there were 1,058 DEGs between disease and nor-mal samples, and 80 DEGs between F_PSC and SL_PSC samples. The DEGs are shown in Table 1.
Modern experimental technologies, such as microarray, have faci-litated research in discovering novel pathogenetic mechanisms of sarcoidosis. Large amounts of information, specifically with regard to the microarray-based mRNA expression analysis of pathological tissues including lung, lymph nodes and blood cells of sarcoidosis patients, have been used to find potential pathogenic mediators and novel biomarkers [9, 21] such as Matrix metalloproteinase 12 (MMP12). Unsupervised bioinformatics analyses of gene expression data can identify highly regulated molecular pathways that are likely to promote abnormal granulomatous inflammation. Up-regu-lated hypoxia inducible factor-1A (HIF-1A) and vascular endothelial growth factor (VEGF) genes have been linked to acknowledged nega-tive prognostics [22].
In this study, we utilized the gene expression profiles of different staged cutaneous sarcoidosis (shorten as CSC) and pulmonary sar-coidosis (abbreviated as PSC) as well as normal controls, to identify specific and mutual gene expression patterns as well as signaling pathways involved in disease occurrence and development and to search relevant biomarkers, reliable endpoints as well as potential efficient treatments.
Material and methods
Study datasetsThe gene expression profiles of pulmonary sarcoidosis (PSC) were downloaded from the GEO [23] (http://www.ncbi.nlm.nih.gov/geo/). In GSE19976, there were eight patients with active but self-limiting pulmonary sarcoidosis and seven with active, progressive, fibrotic pulmonary disease [9]. The gene expression profile was based on the GPL6244 [HuGene-1_0-st] Affymetrix Human Gene 1.0 ST Array [transcript (gene) version]. GSE16538 was based on the GPL570 [HG-U133_Plus_2] Affymetrix Human Genome U133 plus 2.0 Array including six active pulmonary sarcoidosis (n=6) and six normal lung anatomy [24]. In GSE32887, there were 15 samples of sarcoidosis with skin lesions, 11 unaffected skin from patients with cutaneous sarcoidosis (CSC) and 5 normal samples [21]. We marked the self-limiting pul-monary sarcoidosis as “SL_PSC”, the fibrotic pulpul-monary sarcoidosis as “F_PSC”, sarcoidosis with skin lesions as “TL_CSC” and unaffected skin from patients with CSC as “NL_CSC”.
Data analysis
With the “MetaDE” package of R project, we merged the GSE19976 and GSE16538, and finally acquired 8 samples of SL_PSC, 13 samples of F_PSC and 6 normal samples. To explore the pathogenesis of PSC, we considered the SL_PSC and F_PSC as the test groups and the normal samples as control groups. Through the “limma” package of R project, the genes with p-value <0.05 were considered as the differentially expressed genes (DEGs). We performed the function enrichment to find the significant pathways and biological functions with the “Data-base for Annotation, Visualization and Integrated Discovery” (DAVID) (http://david.abcc.ncifcrf.gov/). The functions with p-values for enrichment scores less than 0.05 were extracted.
SYNTHÈSE
REVUES
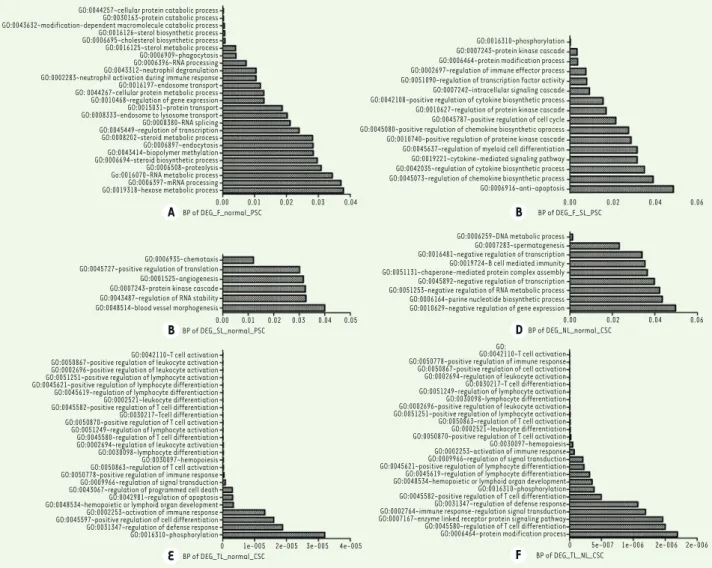
DEGs in F_PSC and SL_PSC mainly regulate phosphory-lation, protein kinase cascade, protein modification process, regulation of immune effector process etc. (Figure 2B).
Regarding to CSC, the DEGs between NL_CSC and normal tissue were significantly enriched in genes encoding DNA metabolic process, spermatogenesis, negative regulation of transcription etc. (Figure 2D). By contrast, DEGs between TL_CSC and normal tissue were markedly enriched in immune cell-related functions including T cell activation, positive regulation of cell activation and of leukocyte activation etc. (Figure 2E).
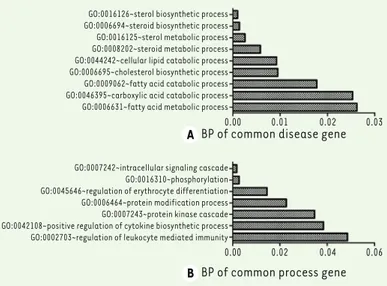
Further-more, DEGs in TL_CSC and NL_CSC mostly modulate T cell activation, positive regulation of immune response, positive regulation of cell activation etc. (Figure 2F). In addition, we also carried out a functional enrich-ment on the mutual disease-related genes and disease progression-related genes (Figure 3). Results showed that the common disease-related genes between CSC and PSC are involved in the sterol biosynthetic process, steroid biosynthetic process and so on (Figure 3A). The common progression-related genes mainly regulate the intracellular signaling cascade, phosphorylation, regu-lation of erythrocyte differentiation, protein modifica-tion process, protein kinase cascade (Figure 3B).
Dynamic functional changes CSC
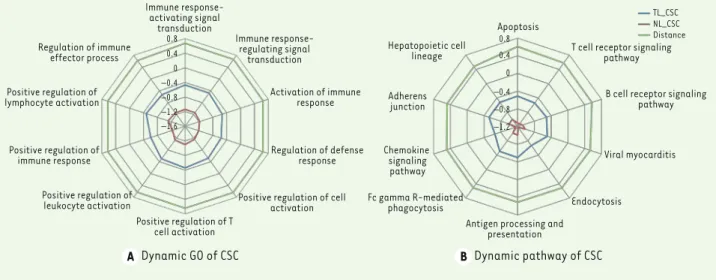
According to the deviation scores, 149 biological func-tions impacted were defined. These biological funcfunc-tions are differentially regulated during the transition from normal to non-invasive sarcoidosis and to skin lesion sarcoidosis (Supplement Table 1). The following biologi-cal processes changed markedly (Figure 3A): immune response-activating signal transduction, immune response-regulating signal transduction, activation of immune response. The most significant differentially expressed genes are involved in apoptosis, T cell recep-tor signaling, B cell receprecep-tor signaling, viral myocar-ditis, antigen processing and presentation, Fcgamma R-mediated phagocytosis (Figure 3B).
PSC
Changes in biological functions were also suggested when the gene expression between normal lung to minor lesion PSC and F_PSC was compared (Supple-ment Table 2). Biological processes such as the positive regulation of antigen receptor-mediated signaling, the regulation of antigen receptor-mediated signaling, the regulation of lymphocyte activation, the regulation of leukocyte activation, lymphocyte differentiation etc., Twelve DEGs were significantly expressed at different stages of CSC
(Figure 1A) whereas 2 genes were found significantly deregulated at different stages of PSC (Figure 1B). Between CSC and PSC, we found 97 common disease-related genes (Figure 1C), and 13 common progres-sion-related genes (Figure 1D).
Functional analysis
Functional enrichment analysis was performed to better understand the role of these DEGs. Our data show that DEGs between F_PSC and normal tissue are significantly enriched in genes encoding proteins involved in cellular protein catabolic process, protein catabolic pro-cess, modification-dependent macromolecule catabolic propro-cess, ste-rol biosynthetic process, etc. (Figure 2A). By contrast, DEGs between SL_PSC and normal tissue were significantly enriched in genes encoding molecules involved in chemotaxis, positive regulation of translation, angiogenesis, protein kinase cascade, etc. (Figure 2C). Moreover, the
NL_normal_CSC TL_normal_CSC F_normal_PSC SL_normal_PSC
28 73 765 12 9 926 551 TL_NL_CSC F_SL_PSC TL_normal_CSC F_normal_PSC F_SL_PSC TL_NL_CSC A B C D 1595 84 37 0 68 774 67 8 117 0 0 0 0 1 20 NL_normal_CSC SL_normal_PSC 841 74 127 1 2 10 67 67 13 1485
Up-regulated Down-regulated Total
TL_normal_CSC 763 1013 1776 NL_normal_CSC 23 99 122 TL_NL_CSC 681 817 1498 SL_normal_PSC 65 148 213 F_normal_PSC 434 484 918 F_SL_PSC 65 15 80
Table 1. The differentially expressed genes in different stages of sarcoidosis.
Figure 1. Numbers of DEGs at different stages of sarcoidosis. (A) DEGs of CSC;
(B) DEGs of PSC; (C) relationships of DEGs between CSC and PSC; (D) relation-ships of process disease DEGs between CSC and PSC.
validation, a ROC curve was generated to evaluate the effectiveness of the model. Our results indicated that the classification model constructed on the basis of disease-related and disease progression-related bio-markers, optimized by feature selection, could effec-tively distinguish patients with PSC or CSC, with effi-ciencies of 87% and 92%, respectively (Figure 6C-D).
Discussion
Sarcoidosis is a multiple system granulomatous disease of unknown etiology [1, 2, 26]. The exact pathogenesis of sarcoidosis is still not fully understood and the link between the CSC and PSC remains unknown [27]. In the recent years, many researches have focused on the were significantly impacted (Figure 4A). Several signaling pathways
are also remarkably changed, such as that involved in Primary immu-nodeficiency, in T cell receptor signaling pathway, in cytokine-cytokine receptor interaction, and in Natural Killer (NK) cell-mediated cytotox-icity (Figure 4B).
Biomarker screening based on feature selection
Feature selection was performed on the intersections of disease-related genes and disease progression-disease-related genes from PSC and CSC. Through iterative feature extraction, three biomarkers (CLDN7, NUDT11 and FAM73A) were obtained from the disease-related genes, and two biomarkers (TAP1 and TAP2) were acquired from the disease progression-related genes (Figure 6A-B). The selected biomarkers were used as features to construct SVM classifier for the supervised clas-sification of patients with PSC or CSC. Combined with a five-fold
cross-GO:0044257~cellular protein catabolic process GO:0030163~protein catabolic process GO:0043632~modification-dependent macromolecule catabolic process GO:0016126~sterol biosynthetic process GO:0006695~cholesterol biosynthetic process GO:0016125~sterol metabolic process GO:0006909~phagocytosis GO:0006396~RNA processing GO:0043312~neutrophil degranulation GO:0002283~neutrophil activation during immune response GO:0016197~endosome transport GO: 0044267~cellular protein metabolic process GO:0010468~regulation of gene expression GO:0015031~protein transport GO:0008333~endosome to lysosome transport GO:0008380~RNA splicing GO:0045449~regulation of transcription GO:0008202~steroid metabolic process GO:0006897~endocytosis GO:0043414~biopolymer methylation GO:0006694~steroid biosynthetic process GO:0006508~proteolysis Go:0016070~RNA metabolic process GO:0006397~mRNA processing GO:0019318~hexose metabolic process
GO:0016310~phosphorylation GO:0007243~protein kinase cascade GO:0006464~protein modification process GO:0002697~regulation of immune effector process GO:0051090~regulation of transcription factor activity GO:0007242~intracellular signaling cascade GO:0042108~positive regulation of cytokine biosynthetic process GO:0010627~regulation of protein kinase cascade GO:0045787~positive regulation of cell cycle GO:0045080~positive regulation of chemokine biosynthetic oprocess GO:0010740~positive regulation of proteine kinase cascade GO:0045637~regulation of myeloid cell differentiation GO:0019221~cytokine-mediated signaling pathway GO:0042035~regulation of cytokine biosynthetic process GO:0045073~regulation of chemokine biosynthetic process GO:0006916~anti-apoptosis
GO:0006259~DNA metabolic process GO:0007283~spermatogenesis GO:0016481~negative regulation of transcription GO:0019724~B cell mediated immunity GO:0051131~chaperone-mediated protein complex assembly GO:0045892~negative regulation of transcription GO:0051253~negative regulation of RNA metabolic process GO:0006164~purine nucleotide biosynthetic process GO:0010629~negative regulation of gene expression
GO:
GO:0042110~T cell activation GO:0050778~positive regulation of immune response GO:0050867~positive regulation of cell activation GO:0002694~regulation of leukocyte activation GO:0030217~T cell differentiation GO:0051249~regulation of lymphocyte activation GO:0030098~lymphocyte differentiation GO:0002696~positive regulation of leukocyte activation GO:0051251~positive regulation of lymphocyte activation GO:0050863~regulation of T cell activation GO:0002521~leukocyte differentiation GO:0050870~positive regulation of T cell activation GO:0030097~hemopoiesis GO:0002253~activation of immune response GO:0009966~regulation of signal transduction GO:0045621~positive regulation of lymphocyte differentiation GO:0045619~regulation of lymphocyte differentiation GO:0048534~hemopoietic or lymphoid organ development GO:0016310~phosphorylation GO:0045582~positive regulation of T cell differentiation GO:0031347~regulation of defense response GO:0002764~immune response-regulation signal transduction GO:0007167~enzyme linked receptor protein signaling pathway GO:0045580~regulation of T cell differentiation GO:0006464~protein modification process 0.00 0.01 0.02 0.03 0.04 BP of DEG_F_normal_PSC A B BP of DEG_F_SL_PSC0.00 0.02 0.04 0.06 0.00 0.02 0.04 0.06 BP of DEG_NL_normal_CSC D
0 5e-007 1e-006 2e-006 2e-006 BP of DEG_TL_NL_CSC
F 0.00 0.01 0.02 0.03 0.04 0.05
BP of DEG_SL_normal_PSC B
0 1e-005 2e-005 3e-005 4e-005 BP of DEG_TL_normal_CSC
E GO:0006935~chemotaxis GO:0045727~positive regulation of translation GO:0001525~angiogenesis GO:0007243~protein kinase cascade GO:0043487~regulation of RNA stability GO:0048514~blood vessel morphogenesis
GO:0042110~T cell activation GO:0050867~positive regulation of leukocyte activation GO:0002696~positive regulation of leukocyte activation GO:0051251~positive regulation of lymphocyte activation GO:0045621~positive regulation of lymphocyte differentiation GO:0045619~regulation of lymphocyte differentiaction GO:0002521~leukocyte differentiation GO:0045582~positive regulation of T cell differentiation GO:0030217~Tcell differentiation GO:0050870~positive regulation of T cell activation GO:0051249~regulation of lymphocyte activation GO:0045580~regulation of T cell differentiation GO:0002694~regulation of leukocyte activation GO:0030098~lymphocyte differentiation GO:0030097~hemopoiesis GO:0050863~regulation of T cell activation GO:0050778~positive regulation of immune response GO:0009966~regulation of signal transduction GO:0043067~regulation of programmed cell death GO:0042981~regulation of apoptosis GO:0048534~hemopoietic or lymphoid organ development GO:0002253~activation of immune response GO:0045597~positive regulation of cell differentiation GO:0031347~regulation of defense response GO:0016310~phosphorylation
Figure 2. Biological process of DEGs regulated at different stages of sarcoidosis. (A) Functional enrichment of DEGs of F_ normal_PSC; (B) functio-nal enrichment of DEGs of F_SL_PSC; (C) functional enrichment of DEGs of SL_normal_PSC; (D) functional enrichment of DEGs of NL_normal_CSC;
(E) functional enrichment of DEGs of TL_normal_CSC; (F) functional enrichment of DEGs of TL_NLCSC. Vertical coordinates show the GO terms and horizontal ordinate the p-values.
SYNTHÈSE
REVUES
function TL_CSC NL_CSC distanceGO:0009074~aromatic amino acid family catabolic process
-0.15
-0.18
0.03
GO:0043065~positive regulation of apoptosis
-0.78
-1.32
0.54
hsa04062:chemokine signaling pathway
-0.66
-1.15
0.49
GO:0051050~positive regulation of transport
-0.65
-1.08
0.43
GO:0031328~positive regulation of cellular bios
ynthetic process -0.87 -1.3 0.43 GO:0006935~chemotaxis -0.64 -1.12 0.48 GO:0030097~hemopoiesis -0.71 -1.26 0.55
GO:0008360~regulation of cell shape
-0.48
-1.07
0.59
hsa04612:Antigen processing and presentation
-0.5 -1.01 0.51 GO:0016477~cell migration -0.72 -1.13 0.41
GO:0043067~regulation of programmed cell death
-0.92
-1.39
0.47
GO:0000904~cell morphogenesis involved in differentiation
-0.66 -1.07 0.41 GO:0007409~axonogenesis -0.61 -1.03 0.42
GO:0008202~steroid metabolic process
-0.46
-0.61
0.15
GO:0032944~regulation of mononuclear cell proliferation
-0.51
-1.12
0.61
GO:0002694~regulation of leukocyte activation
-0.67 -1.25 0.58 GO:0030278~regulation of ossification -0.45 -0.93 0.48
GO:0002526~acute inflammatory response
-0.47
-0.98
0.51
GO:0050867~positive regulation of cell activation
-0.52
-1.16
0.64
hsa04666:Fc gamma R-mediated phagocytosis
-0.51
-1.02
0.51
GO:0002757~immune response-activating signal transduction
-0.47
-1.14
0.67
GO:0002696~positive regulation of leukocyte activation
-0.5
-1.13
0.63
GO:0060548~negative regulation of cell death
-0.74
-1.18
0.44
GO:0010740~positive regulation of protein kinase cascade
-0.58 -1.07 0.49 function TL_CSC NL_CSC distance
hsa04660:T cell receptor signaling pathway
-0.54
-1.12
0.58
GO:0044106~cellular amine metabolic process
-0.52
-0.67
0.15
GO:0050778~positive regulation of immune response
-0.61
-1.24
0.63
hsa04514:Cell adhesion molecules (CAMs)
-0.63 -1.08 0.45 GO:0051260~protein homooligomerization -0.55 -0.96 0.41
GO:0048812~neuron projection morphogenesis
-0.64 -1.07 0.43 hsa05220:Chronic my eloid leukemia -0.5 -0.93 0.43
GO:0006520~cellular amino acid metabolic process
-0.47
-0.61
0.14
GO:0031325~positive regulation of cellular metabolic process
-0.91
-1.34
0.43
GO:0051222~positive regulation of protein transport
-0.45 -0.95 0.5 GO:0048534~hemopoietic or lymphoid or gan development -0.72 -1.27 0.55
GO:0002695~negative regulation of leukocyte activation
-0.5 -1.07 0.57 GO:0022008~neurogenesis -0.84 -1.27 0.43 hsa04144:Endocytosis -0.67 -1.18 0.51 GO:0006334~nucleosome assembly -0.42 -0.45 0.03 GO:0000902~cell morphogenesis -0.75 -1.2 0.45
GO:0010604~positive regulation of macromolecule metabolic process
-0.91
-1.34
0.43
GO:0050870~positive regulation of T cell activation
-0.46
-1.1
0.64
GO:0051174~regulation of phosphorus metabolic process
-0.81 -1.27 0.46 GO:0048732~gland development -0.6 -0.85 0.25 GO:0008544~epidermis development -0.67 -1 0.33 hsa02010:ABC transporters -0.24 -0.39 0.15
GO:0002449~lymphocyte mediated immunity
-0.45 -1.03 0.58 GO:0030098~lymphocyte differentiation -0.54 -1.09 0.55
function
TL_CSC
NL_CSC
distance
GO:0070663~regulation of leukocyte proliferation
-0.51 -1.12 0.61 GO:0048666~neuron development -0.71 -1.17 0.46
hsa04810:Regulation of actin cytoskeleton
-0.66
-1.14
0.48
GO:0042110~T cell activation
-0.6 -1.12 0.52 GO:0006694~steroid bios ynthetic process -0.42 -0.59 0.17
GO:0032268~regulation of cellular protein metabolic process
-0.82
-1.27
0.45
GO:0051249~regulation of lymphocyte activation
-0.62
-1.22
0.6
GO:0007243~protein kinase cascade
-0.76
-1.2
0.44
GO:0030335~positive regulation of cell migration
-0.51
-0.92
0.41
GO:0019220~regulation of phosphate metabolic process
-0.81
-1.27
0.46
GO:0032990~cell part morphogenesis
-0.68
-1.12
0.44
GO:0051223~regulation of protein transport
-0.56 -1 0.44 GO:0048699~generation of neurons -0.82 -1.25 0.43
GO:0046394~carboxylic acid bios
ynthetic process
-0.46
-0.61
0.15
GO:0048858~cell projection morphogenesis
-0.67 -1.11 0.44 hsa00982:Drug metabolism -0.32 -0.43 0.11
hsa04910:Insulin signaling pathway
-0.6
-1.01
0.41
GO:0008284~positive regulation of cell proliferation
-0.8
-1.27
0.47
GO:0050670~regulation of lymphocyte proliferation
-0.5 -1.12 0.62 GO:0048706~embry onic skeletal s ystem development -0.26 -0.42 0.16
GO:0033157~regulation of intracellular protein transport
-0.49
-0.95
0.46
GO:0001942~hair follicle development
-0.18
-0.36
0.18
GO:0043068~positive regulation of programmed cell death
-0.78
-1.32
0.54
GO:0019752~carboxylic acid metabolic process
-0.67
-0.81
0.14
GO:0007242~intracellular signaling cascade
-1
-1.47
0.47
GO:0045596~negative regulation of cell differentiation
-0.67 -1.11 0.44 function TL_CSC NL_CSC distance
GO:0006464~protein modification process
-1.02
-1.44
0.42
hsa04640:Hematopoietic cell lineage
-0.52
-1
0.48
hsa04060:Cytokine-cytokine receptor interaction
-0.7 -1.17 0.47 GO:0016126~sterol bios ynthetic process -0.31 -0.49 0.18 GO:0035136~forelimb morphogenesis -0.11 -0.28 0.17 hsa00280:V
aline, leucine and isoleucine degradation
-0.27
-0.45
0.18
GO:0031175~neuron projection development
-0.68
-1.13
0.45
GO:0045937~positive regulation of phosphate metabolic process
-0.51
-0.94
0.43
GO:0031399~regulation of protein modification process
-0.71
-1.17
0.46
GO:0030217~T cell differentiation
-0.46
-1
0.54
GO:0009966~regulation of signal transduction
-0.94
-1.4
0.46
GO:0009967~positive regulation of signal transduction
-0.71
-1.21
0.5
GO:0051250~negative regulation of lymphocyte activation
-0.49 -1.05 0.56 hsa04360:Axon guidance -0.6 -1.07 0.47
GO:0032386~regulation of intracellular transport
-0.51 -0.98 0.47 hsa05416:Viral my ocarditis -0.49 -1.02 0.53
GO:0007167~enzyme linked receptor protein signaling pathway
-0.78 -1.21 0.43 GO:0002521~leukocyte differentiation -0.58 -1.14 0.56
GO:0048514~blood vessel morphogenesis
-0.64
-1.16
0.52
GO:0019400~alditol metabolic process
-0.15
-0.3
0.15
GO:0051251~positive regulation of lymphocyte activation
-0.48 -1.11 0.63 GO:0009888~tissue development -0.87 -1.3 0.43
GO:0022604~regulation of cell morphogenesis
-0.61 -1.21 0.6 hsa00100:Steroid bios ynthesis -0.19 -0.38 0.19 GO:0048729~tissue morphogenesis -0.63 -1.06 0.43
GO:0050863~regulation of T cell activation
-0.59
-1.18
SYNTHÈSE
REVUES
function TL_CSC NL_CSC distanceGO:0046395~carboxylic acid catabolic process
-0.4
-0.5
0.1
GO:0006333~chromatin assembly or disassembly
-0.45 -0.5 0.05 hsa04210:Apoptosis -0.51 -1.12 0.61
GO:0048667~cell morphogenesis involved in neuron differentiation
-0.62 -1.04 0.42 GO:0042981~regulation of apoptosis -0.92 -1.39 0.47
GO:0006633~fatty acid bios
ynthetic process -0.35 -0.49 0.14 GO:0006695~cholesterol bios ynthetic process -0.25 -0.42 0.17
GO:0009063~cellular amino acid catabolic process
-0.33
-0.44
0.11
GO:0051347~positive regulation of transferase activity
-0.65
-1.17
0.52
GO:0051090~regulation of transcription factor activity
-0.53
-1
0.47
GO:0006631~fatty acid metabolic process
-0.49 -0.63 0.14 GO:0016310~phosphorylation -0.91 -1.36 0.45 GO:0051259~protein oligomerization -0.65 -1.06 0.41 hsa00350:T yrosine metabolism -0.31 -0.36 0.05
GO:0009310~amine catabolic process
-0.36
-0.47
0.11
GO:0070201~regulation of establishment of protein localization
-0.6
-1.04
0.44
GO:0008285~negative regulation of cell proliferation
-0.78
-1.25
0.47
GO:0065004~protein-DNA complex assembly
-0.43 -0.46 0.03 hsa00640:Propanoate metabolism -0.17 -0.35 0.18
GO:0032868~response to insulin stimulus
-0.55
-1.07
0.52
GO:0030099~my
eloid cell differentiation
-0.51
-1.05
0.54
GO:0009952~anterior/posterior pattern formation
-0.35
-0.52
0.17
GO:0010647~positive regulation of cell communication
-0.72
-1.19
0.47
GO:0009891~positive regulation of bios
ynthetic process
-0.87
-1.31
0.44
GO:0030334~regulation of cell migration
-0.61 -1.07 0.46 function TL_CSC NL_CSC distance
GO:0006355~regulation of transcription, DNA-dependent
-0.81
-0.96
0.15
GO:0002764~immune response-regulating signal transduction
-0.48 -1.14 0.66 hsa00480:Glutathione metabolism -0.29 -0.42 0.13
GO:0051272~positive regulation of cell motion
-0.53
-0.95
0.42
GO:0045597~positive regulation of cell differentiation
-0.69
-1.19
0.5
hsa00061:Fatty acid bios
ynthesis
-0.09
-0.2
0.11
GO:0002237~response to molecule of bacterial origin
-0.5
-1
0.5
GO:0050866~negative regulation of cell activation
-0.52 -1.04 0.52 hsa04520:Adherens junction -0.52 -1 0.48 GO:0007398~ectoderm development -0.68 -1.02 0.34
GO:0010942~positive regulation of cell death
-0.78 -1.33 0.55 hsa00650:Butanoate metabolism -0.2 -0.35 0.15 GO:0034728~nucleosome or ganization -0.43 -0.48 0.05 GO:0032496~response to lipopolysaccharide -0.48 -0.97 0.49
GO:0010562~positive regulation of phosphorus metabolic process
-0.51
-0.94
0.43
GO:0015698~inor
ganic anion transport
-0.37
-0.53
0.16
GO:0002253~activation of immune response
-0.53
-1.18
0.65
hsa04662:B cell receptor signaling pathway
-0.51
-1.08
0.57
GO:0009081~branched chain family amino acid metabolic process
-0.11
-0.27
0.16
GO:0050868~negative regulation of T cell activation
-0.45
-1.01
0.56
GO:0002697~regulation of immune effector process
-0.53
-1.15
0.62
GO:0051246~regulation of protein metabolic process
-0.85
-1.29
0.44
GO:0006558~L-phenylalanine metabolic process
-0.11
-0.13
0.02
GO:0031347~regulation of defense response
-0.56
-1.21
0.65
sality of sarcoidosis while the specific genes defined in CSC and PSC represent the specificity of these two diseases. Because the specific genes are only differen-tially expressed in one type of sarcoidosis, these DEGs could represent clinically relevant diagnostic markers to distinguish different types of sarcoidosis. In addi-tion, we also analyzed the differences in patients with sarcoidosis at different stages, identifying disease-related genes and progression-disease-related genes. The abnormal expression of these genes fully displayed the dynamic nature of disease progression. Thus, uti-lizing these genes as diagnostic markers to evaluate a dynamic disease will contribute to identify the turning point of the disease, and could help preventing disease progression and improving the response to treatment. During the functional analysis, we found that disease-related genes in both CSC and PSC are involved in a number of important biological functions, such as sterol biosynthesis and steroid biosynthetic process. During the occurrence of sarcoidosis, some important biological pathways are dysregulated. Correction of these abnormalities during the disease process could prevent disease progression and improve the efficacy of treatment. As the disease progresses, more downstream genes and biological functions are abnormally induced. Our results have identified common progression-related genes regulating intracellular signaling cascades, phos-phorylation, regulation of erythrocyte differentiation, protein modification, and protein kinase cascade. Thus, the specific dysregulated functions probably reveal the biological mechanisms accompanying different types of sarcoidosis. This may help the identification of the etiology of the disease and the development of effec-tive therapeutic strategies.
Data analyses have also demonstrated that several biological processes defined by DEGs contribute to the occurrence of CSC and/or to the development of the disease into cutaneous CSC. For example, T cell activa-tion and the positive regulaactiva-tion of leukocyte activaactiva-tion may mark the occurrence of CSC. Moreover, T cell acti-vation and a set of genes encoding proteins involved in the regulation of immune response were significantly differentially regulated by DEGs in TL_CSC and NL_CSC. It suggests a mechanism of development of the disease from non-lesion CSC to skin lesion CSC. Regarding to PSC, biological processes such as chemotaxis, positive regulation of translation, angiogenesis, protein kinase cascade, were remarkably differentially regulated by the DEGs in self-limiting PSC as compared to normal tissue, which may reveal the occurrence of PSC. DEGs in fibrotic PSC and normal tissue were enriched in genes encoding proteins involved in catabolic processes, in pathogenesis of CSC and PSC [26, 28]. Despite these efforts, it is still
unclear how these two diseases correlate. Identifying the specific bio-markers closely associated with both CSC and PSC could largely contri-bute to early clinical diagnosis of the different types of sarcoidosis and to prevent CSC – PSC transition. Therefore, in this study, we have analyzed and compared the expression profiles of different staged CSC and PSC, identifying specific genes and the related impacted biological functions of the CSC and PSC, respectively. Moreover, the shared genes and functional pathways between CSC and PSC were also analyzed. 97 common disease-related genes and 13 mutual disease progression-related genes were identified. Further analysis showed that these com-mon disease-related genes encode proteins mainly involved in sterol biosynthetic process and steroid biosynthetic process; by contrast, the mutual disease progression-related genes mostly regulate intracel-lular signaling cascade, phosphorylation, erythrocyte differentiation, protein modification process, and protein kinase cascade. We propose that these common genes and their related functions could represent the common features between CSC and PSC, and represent also poten-tial markers for the diagnosis of the CSC-PSC transition. In addition, through feature selection, 3 disease-related biomarkers (CLDN7, NUDT11 and FAM73A) and 2 disease progression-related biomarkers (TAP1 and TAP2) were identified. Moreover, SVM classifier constructed on the basis of these features could effectively distinguish patients with PSC or CSC.
We considered that the shared genes are simultaneously involved in different types of sarcoidosis. Therefore, they are conservative genes significantly associated with sarcoidosis. Abnormal expression of these genes can lead to sarcoidosis. However, their expression is probably affected by other factors, such as distribution, genetic back-ground [29-31] and environmental stimulation [32], as well as other related genes [21, 33]. The intersection of DEGs embodies the
univer-GO:0016126~sterol biosynthetic process GO:0006694~steroid biosynthetic process GO:0016125~sterol metabolic process GO:0008202~steroid metabolic process GO:0044242~cellular lipid catabolic process GO:0006695~cholesterol biosynthetic process GO:0009062~fatty acid catabolic process GO:0046395~carboxylic acid catabolic process GO:0006631~fatty acid metabolic process
GO:0007242~intracellular signaling cascade GO:0016310~phosphorylation GO:0045646~regulation of erythrocyte differentiation GO:0006464~protein modification process GO:0007243~protein kinase cascade GO:0042108~positive regulation of cytokine biosynthetic process GO:0002703~regulation of leukocyte mediated immunity
0.00 0.01 0.02 0.03
BP of common disease gene A
BP of common process gene B
0.00 0.02 0.04 0.06
Figure 3. Function analysis of (A) the common disease-related DEGs and of (B) common disease progression-related genes. Vertical coordinates represent the GO terms and horizontal ordinate was the p-values.
SYNTHÈSE
REVUES
function SL_PSC F_PSC distancehsa04514:Cell adhesion molecules (CAMs)
-1.02
-0.3
0.72
GO:0051251~positive regulation of lymphocyte activation
-1.14
-0.3
0.84
GO:0070665~positive regulation of leukocyte proliferation
-0.95
-0.2
0.75
GO:0051173~positive regulation of nitrogen compound metabolic process
-0.85
-0.76
0.09
GO:0050870~positive regulation of T cell activation
-1.11
-0.28
0.83
GO:0045941~positive regulation of transcription
-0.83
-0.74
0.09
GO:0010468~regulation of gene expression
-1.16
-1.07
0.09
GO:0045893~positive regulation of transcription, DNA-dependent
-0.79
-0.71
0.08
GO:0008285~negative regulation of cell proliferation
-0.82
-0.64
0.18
GO:0044257~cellular protein catabolic process
-0.88 -0.77 0.11 GO:0016568~chromatin modification -0.76 -0.67 0.09
GO:0043067~regulation of programmed cell death
-1.18 -0.45 0.73 GO:0030098~lymphocyte differentiation -1.11 -0.26 0.85
hsa04662:B cell receptor signaling pathway
-1.09 -0.31 0.78 GO:0042981~regulation of apoptosis -1.18 -0.45 0.73
GO:0070663~regulation of leukocyte proliferation
-1.08
-0.27
0.81
GO:0030163~protein catabolic process
-0.89
-0.78
0.11
GO:0032944~regulation of mononuclear cell proliferation
-1.08
-0.27
0.81
GO:0042110~T cell activation
-1.02
-0.37
0.65
GO:0019221~cytokine-mediated signaling pathway
-0.88
-0.31
0.57
GO:0050857~positive regulation of antigen receptor-mediated sig
-naling pathway -1.14 -0.13 1.01 hsa04940:T
ype I diabetes mellitus
-1.01
-0.21
0.8
GO:0050671~positive regulation of lymphocyte proliferation
-0.95
-0.2
0.75
GO:0010557~positive regulation of macromolecule bios
ynthetic
process
-0.86
-0.76
0.1
GO:0050867~positive regulation of cell activation
-1.16
-0.32
0.84
GO:0016071~mRNA metabolic process
-0.8
-0.64
0.16
GO:0051249~regulation of lymphocyte activation
-1.25
-0.38
0.87
GO:0043388~positive regulation of DNA binding
-0.84
-0.25
0.59
GO:0032946~positive regulation of mononuclear cell proliferation
-0.95
-0.2
0.75
GO:0045577~regulation of B cell differentiation
-0.88
-0.14
0.74
GO:0006355~regulation of transcription, DNA-dependent
-1.04
-0.95
0.09
GO:0002696~positive regulation of leukocyte activation
-1.16
-0.32
0.84
GO:0030101~natural killer cell activation
-0.96 -0.21 0.75 function SL_PSC F_PSC distance
GO:0051254~positive regulation of RNA metabolic process
-0.79 -0.71 0.08 hsa05340:Primary immunodeficiency -1.2 -0.2 1
GO:0016070~RNA metabolic process
-0.98
-0.84
0.14
GO:0007166~cell surface receptor linked signal transduction
-1.31
-0.62
0.69
GO:0040029~regulation of gene expression, epigenetic
-0.5
-0.45
0.05
GO:0031326~regulation of cellular bios
ynthetic process -1.16 -1.06 0.1 hsa05330:Allograft rejection -1.01 -0.21 0.8
hsa04660:T cell receptor signaling pathway
-1.19
-0.29
0.9
GO:0019219~regulation of nucleobase, nucleoside, nucleotide and nucleic acid metabolic process
-1.14 -1.05 0.09 GO:0015031~protein transport -0.98 -0.8 0.18 GO:0045449~regulation of transcription -1.13 -1.04 0.09
hsa04650:Natural killer cell mediated cytotoxicity
-1.1
-0.28
0.82
GO:0050778~positive regulation of immune response
-1.12
-0.29
0.83
GO:0050854~regulation of antigen receptor-mediated signaling pathway
-1.14
-0.13
1.01
GO:0050670~regulation of lymphocyte proliferation
-1.08
-0.27
0.81
GO:0050863~regulation of T cell activation
-1.14
-0.3
0.84
GO:0002694~regulation of leukocyte activation
-1.25
-0.38
0.87
GO:0051252~regulation of RNA metabolic process
-1.04
-0.95
0.09
GO:0045935~positive regulation of nucleobase, nucleoside, nucleo
-tide and nucleic acid metabolic process
-0.85
-0.75
0.1
GO:0010628~positive regulation of gene expression
-0.83 -0.74 0.09 GO:0002521~leukocyte differentiation -1.11 -0.31 0.8
GO:0043632~modification-dependent macromolecule catabolic process
-0.88 -0.77 0.11 GO:0006396~RNA processing -0.88 -0.72 0.16
GO:0044267~cellular protein metabolic process
-1.14
-1.01
0.13
GO:0006464~protein modification process
-1.05
-0.91
0.14
GO:0050871~positive regulation of B cell activation
-0.93
-0.21
0.72
GO:0010556~regulation of macromolecule bios
ynthetic process
-1.15
-1.06
0.09
GO:0045619~regulation of lymphocyte differentiation
-1.01
-0.25
0.76
hsa04060:Cytokine-cytokine receptor interaction
-1.29
-0.43
0.86
GO:0050864~regulation of B cell activation
-1.1 -0.29 0.81 hsa05332:Graft-versus-host disease -1.01 -0.21 0.8 Table s2
loma formation in this disease [37]. Although immuno-logical events may determine the granuloma fate, other signaling pathways and factors also play important roles in pathogenesis and/or developmental process of sarcoidosis. Angiogenesis regulated by HIF-1A/VEGF/ inhibitor of growth protein 4 (ING-4) axis may be crucial for the course and outcome of sarcoidosis [22]. Despite these advances, there are no clinically useful biomar-kers that can assist the clinician in diagnosis, prognosis or assessment of treatment effects [17, 28, 38]. Disease progression is a dynamic process and we used a dynamic functional scoring algorithm to identify and analyze the differential functional pathways at different stages of disease progression. We found that functional pathways display a gradient dynamic change sterol biosynthetic process, showing the PSC progressed to a more
serious stage. We also discovered that phosphorylation, protein kinase cascade, protein modification process, regulation of immune effector process, are dysregulated between F_PSC and SL_PSC, indicating that these biological processes play significant roles in the fibrotic progress of PSC. Consistent with our findings, previous researches have reported that persistent stimulation of the immune system plays a major role in granuloma formation and maintenance [26, 34]. Some immune-related cells such as macrophages, dendritic cells, lymphocytes and regulatory T cells, as well as immune-related factors are all closely involved in the cellular and molecular mechanisms of granuloma for-mation [8, 19, 35] and in the immune-pathogenesis of sarcoidosis [34]. Recent research indicated that immune-relevant factors such as IL-33 are important factors in sarcoidosis, making them potential biomarkers [36, 37]. Moreover, IFN-γ plays an important role in
granu-Immune response-activating signal transduction Regulation of immune effector process Positive regulation of lymphocyte activation Positive regulation of immune response Positive regulation of leukocyte activation Positive regulation of T cell activation Immune response-regulating signal transduction Activation of immune response Regulation of defense response Positive regulation of cell
activation 0.8 0.4 0 –0.4 –0.8 –1.2 –1.6 0.8 0.4 0 –0.4 –0.8 –1.2 Hepatopoietic cell lineage Adherens junction Chemokine signaling pathway Fc gamma R-mediated phagocytosis
Antigen processing and presentation
Endocytosis
Viral myocarditis B cell receptor signaling
pathway Apoptosis
T cell receptor signaling pathway TL_CSC NL_CSC Distance Dynamic GO of CSC A B Dynamic pathway of CSC Positive regulation of antigen receptor-… Positive regulation of T cell activation Positive regulation of leukocyte activation Regulation of T cell activation Positive regulation of cell activation Positive regulation of lymphocyte activation Lymphocyte differentiation Regulation of leukocyte activation Regulation of lymphocyte activation Regulation of antigen
receptor-mediated… molecules (CAMs)Cell adhesion B cell receptor signaling pathway
Type I diabetes mellitus
Allograft
rejection Graft-versus-hostdisease Natural killer cell
mediated cytotoxicity Primary immunodeficiency T cell receptor signaling pathway Cytokine-cytokine receptor interaction 1 0.5 0 –0.5 –1 –1.5 1.5 1 1.5 0 –0.5 –1 –1.5 SL_PSC F_PSC Distance Dynamic GO of PSC A B Dynamic pathway of PSC
Figure 4. The top ten dynamic functions in cutaneous sarcoidosis. (A) dynamic GO of CSC; (B) dynamic pathway of CSC.
SYNTHÈSE
REVUES
during disease progression. The functional pathways were mostly close to normal at the early stage of the disease, while the disease pro-gression made the abnormalities of pathways increasing and finally greatly deviating from the normal levels. The correlations of function and disease stimuli were therefore ranked according to the extent of functional variation. The more obvious the dysfunction was, and the closer the correlation with the disease was. Thus, these dysregulated functions may be the key players in the mechanisms that drive the disease, and the genes encoding molecules involved in these functio-nal pathways might represent therapeutic targets.
Furthermore, three disease-related biomarkers (CLDN7, NUDT11 and FAM73A) and two disease progression-related biomarkers (TAP1 and TAP2) were identified by feature selection. Claudin-7 has been pre-viously reported to be expressed in sarcoidosis [39]. NUDT11 belongs to a subgroup of phosphohydrolases that preferentially attack diphos-phoinositol polyphosphates [40]. Dysregulation of NUDT11 may contri-bute to the abnormal metabolism observed during the occurrence of sarcoidosis. However, there was no report on the role of FAM73A in sarcoidosis. The transporter associated with antigen processing (TAP)
A 0.60 0.55 0.50 0.45 0.40 0.35 0.300 10 20 30 40 50 60 70 80
Number of features selected
Cross validation score (nb of correct classifications)
C 1.0 0.8 0.6 0.4 0.2 0.0 0 0.2 0.4 0.6 0.8 1.0
False Positive Rate
True P ositive Rate B 0.60 0.55 0.50 0.45 0.40 0.35 0.300 10 20 30 40 50 60 70 80
Number of features selected
Cross validation score (nb of correct classifications)
Receiver operating characteristic
ROC fold 1 (area = 0.88) ROC fold 2 (area = 0.89) ROC fold 3 (area = 1.00) ROC fold 4 (area = 1.00) ROC fold 5 (area = 0.86) random
Mean ROC (area = 0.92)
D 1.0 0.8 0.6 0.4 0.2 0.0 0 0.2 0.4 0.6 0.8 1.0
False Positive Rate
True P
ositive Rate
Receiver operating characteristic
ROC fold 1 (area = 0.91) ROC fold 2 (area = 0.73) ROC fold 3 (area = 0.96) ROC fold 4 (area = 0.89) ROC fold 5 (area = 0.86) random
Mean ROC (area = 0.87)
Figure 6. Biomarkers between pulmonary and cutaneous sarcoidosis. (A) feature selection for the common disease genes between CSC and PSC;
(B) feature selection for the common processed disease genes between CSC and PSC; (C) ROC of SVM using disease-related biomarkers; (D) ROC of SVM using process-related biomarkers.
may be involved in determining sarcoidosis susceptibi-lity [41, 42]. Previously, serum amyloid-A was reported to be potentially helpful for detecting the activity of sarcoidosis, and it has been also reported that soluble interleukin-2 receptor (sIL2-R) measurement could be useful in exploring the extra-pulmonary organ involve-ment [43]. Despite these, no single biomarker can be reliably used for a correct diagnosis or an exclusion of sarcoidosis [44,45]. Our results indicate that the use of these five biomarkers (CLDN7, NUDT11, FAM73A, TAP1, and TAP2) as features to construct SVM classifier, could effectively distinguish patients with PSC or CSC. Cer-tainly, further clinical confirmations are needed. To conclude, DEGs in pulmonary sarcoidosis and cuta-neous sarcoidosis patients as well as in healthy indi-viduals were analyzed to identify common disease-related genes and mutual disease progression-disease-related genes which linked pulmonary sarcoidosis and cuta-neous sarcoidosis together. DEGs and their biological
functions are dynamically dysregulated. The biological functional pathways regulated by these DEGs may help defining the common mechanism shared by different types of sarcoidosis. They are encoding proteins likely involved in the pathogenesis of sarcoidosis and could serve as disease markers. Our study provides a novel insight into the common pathogenesis of sarcoidosis and could help developing new therapeutic strategies. ‡
DISCLOSURE STATEMENT
The authors disclose no conflict of interest.
REFERENCES
1. Valeyre, D., et al., Sarcoidosis. Lancet, 2014. 383(9923): p. 1155-67.
2. Iannuzzi, M.C., B.A. Rybicki, and A.S. Teirstein, Sarcoidosis. N Engl J Med, 2007. 357(21): p. 2153-65.
3. Baughman, R.P., et al., Clinical characteristics of patients in a case control study of sarcoidosis. Am J Respir Crit Care Med, 2001. 164(10 Pt 1): p. 1885-9.
4. Mana, J., et al., Cutaneous involvement in sarcoidosis. Relationship to systemic disease. Arch Dermatol, 1997. 133(7): p. 882-8.
5. Lodha, S., M. Sanchez, and S. Prystowsky, Sarcoidosis of the skin: a review for the pulmonologist. Chest, 2009. 136(2): p. 583-96.
6. Costabel, U., J. Guzman, and R.P. Baughman, Systemic evaluation of a potential cutaneous
sarcoidosis patient. Clin Dermatol, 2007. 25(3): p. 303-11.
7. Chappell, A.G., W.Y. Cheung, and H.A. Hutchings, Sarcoidosis: a long-term follow up study. Sarcoidosis Vasc Diffuse Lung Dis, 2000. 17(2): p. 167-73.
8. Broos, C.E., et al., Granuloma Formation in Pulmonary Sarcoidosis. Frontiers in Immunology, 2013. 4: p. 437.
9. Lockstone, H.E., et al., Gene set analysis of lung samples provides insight into pathogenesis of
progressive, fibrotic pulmonary sarcoidosis. Am J Respir Crit Care Med, 2010. 181(12): p. 1367-75.
10. Swigris, J.J., et al., Sarcoidosis-related mortality in the United States from 1988 to 2007. Am J Respir Crit Care Med, 2011. 183(11): p. 1524-30.
11. Huang, C.T., et al., Mortality in sarcoidosis. A changing pattern of the causes of death. Eur J Respir Dis, 1981. 62(4): p. 231-8.
12. Arcasoy, S.M., et al., Characteristics and outcomes of patients with sarcoidosis listed for lung
transplantation. Chest, 2001. 120(3): p. 873-80.
13. Iwai, K., et al., Racial difference in cardiac sarcoidosis incidence observed at autopsy. Sarcoidosis, 1994. 11(1): p. 26-31.
14. Brownell, I., et al., Evidence for mycobacteria in sarcoidosis. Am J Respir Cell Mol Biol, 2011. 45(5): p. 899-905.
15. Gupta, D., et al., Molecular evidence for the role of mycobacteria in sarcoidosis: a meta-analysis. Eur Respir J, 2007. 30(3): p. 508-16.
16. Newman, L.S., et al., A case control etiologic study of sarcoidosis: environmental and
occupational risk factors. Am J Respir Crit Care Med, 2004. 170(12): p. 1324-30.
17. Chen, E.S. and D.R. Moller, Sarcoidosis--scientific progress and clinical challenges. Nat Rev Rheumatol, 2011. 7(8): p. 457-67.
18. Zhou, Y., et al., Human leukocyte antigen-A, -B, and -DRB1 alleles and sarcoidosis in Chinese Han
subjects. Hum Immunol, 2011. 72(7): p. 571-5.
19. Grunewald, J. and A. Eklund, Role of CD4+ T cells in sarcoidosis. Proc Am Thorac Soc, 2007. 4(5): p. 461-4.
20. Piotrowski, W.J., et al., TGF-beta and SMADs mRNA Expression in Pulmonary Sarcoidosis. Adv Exp Med Biol, 2015. 852: p. 59-69.
21. Judson, M.A., et al., Molecular profiling and gene expression analysis in cutaneous sarcoidosis: the
role of interleukin-12, interleukin-23, and the T-helper 17 pathway. J Am Acad Dermatol, 2012.
66(6): p. 901-10, 910.e1-2.
22. Piotrowski, W.J., et al., Expression of HIF-1A/VEGF/ING-4 Axis in Pulmonary
Sarcoidosis. Adv Exp Med Biol, 2015.
23. Imai, H. , Kaira, K. and Minato, K. (2017), Clinical significance of post‐ progression survival in lung cancer. Thorac Cancer, 8: 379-386.
24. Crouser, E.D., et al., Gene expression profiling identifies MMP-12 and
ADAMDEC1 as potential pathogenic mediators of pulmonary sarcoidosis. Am
J Respir Crit Care Med, 2009. 179(10): p. 929-38.
25. Eickhoff, S.B., et al., Analysis of neurotransmitter receptor distribution
patterns in the cerebral cortex. Neuroimage, 2007. 34(4): p. 1317-30.
26. Chen, E.S. and D.R. Moller, Etiologies of Sarcoidosis. Clin Rev Allergy Immunol, 2015.
27. Ma, Y., A. Gal, and M.N. Koss, The pathology of pulmonary sarcoidosis:
update. Semin Diagn Pathol, 2007. 24(3): p. 150-61.
28. Morgenthau, A.S. and M.C. Iannuzzi, Recent advances in sarcoidosis. Chest, 2011. 139(1): p. 174-82.
29. Rybicki, B.A., et al., Familial risk ratio of sarcoidosis in African-American
sibs and parents. Am J Epidemiol, 2001. 153(2): p. 188-93.
30. Rybicki, B.A., et al., Racial differences in sarcoidosis incidence: a 5-year
study in a health maintenance organization. Am J Epidemiol, 1997. 145(3):
p. 234-41.
31. Sverrild, A., et al., Heredity in sarcoidosis: a registry-based twin study. Thorax, 2008. 63(10): p. 894-6.
32. Newman, L.S., et al., A case control etiologic study of sarcoidosis:
environmental and occupational risk factors. Am J Respir Crit Care Med,
2004. 170(12): p. 1324-30.
33. Crouser, E.D., et al., Differential expression of microRNA and predicted
targets in pulmonary sarcoidosis. Biochem Biophys Res Commun, 2012.
417(2): p. 886-91.
34. Loke, W.S.J., C. Herbert, and P.S. Thomas, Sarcoidosis: Immunopathogenesis
and Immunological Markers. International Journal of Chronic Diseases, 2013.
2013: p. 13.
35. Ringkowski, S., P.S. Thomas, and C. Herbert, Interleukin-12 family cytokines
and sarcoidosis. Front Pharmacol, 2014. 5: p. 233.
36. Naumnik, W., et al., Interleukin-33 as a New Marker of Pulmonary
Sarcoidosis. Adv Exp Med Biol, 2015.
37. Fischer, A., et al., Identification of Immune-relevant Factors Conferring
Sarcoidosis Genetic Risk. Am J Respir Crit Care Med, 2015.
38. Mana, J., et al., Granulomatous cutaneous sarcoidosis: diagnosis,
relationship to systemic disease, prognosis and treatment. Sarcoidosis Vasc
Diffuse Lung Dis, 2013. 30(4): p. 268-81.
39. Kaarteenaho-Wiik, R. and Y. Soini, Claudin-1, -2, -3, -4, -5, and -7 in Usual
Interstitial Pneumonia and Sarcoidosis. Journal of Histochemistry and
Cytochemistry, 2009. 57(3): p. 187-195.
40. Hidaka, K., et al., An adjacent pair of human NUDT genes on chromosome
X are preferentially expressed in testis and encode two new isoforms of diphosphoinositol polyphosphate phosphohydrolase. J Biol Chem, 2002.
277(36): p. 32730-8.
41. Foley, P.J., et al., Analysis of MHC encoded antigen-processing genes TAP1
and TAP2 polymorphisms in sarcoidosis. Am J Respir Crit Care Med, 1999.
160(3): p. 1009-14.
42. Foley, P., et al., HLA-DPB1 and TAP1 polymorphisms in sarcoidosis. Chest, 1997. 111(6 Suppl): p. 73S.
43. Gungor, S., et al., Conventional markers in determination of activity of
sarcoidosis. Int Immunopharmacol, 2015. 25(1): p. 174-9.
44. Wessendorf, T.E., F. Bonella, and U. Costabel, Diagnosis of Sarcoidosis. Clin Rev Allergy Immunol, 2015. 49(1): p. 54-62.
45. Li, S. , Sun, X. , Miao, S. , Liu, J. and Jiao, W. (2017), Differential protein‐ coding gene and long noncoding RNA expression in smoking‐related lung squamous cell carcinoma. Thorac Cancer, 8: 672-681.