HAL Id: hal-01851903
https://hal.archives-ouvertes.fr/hal-01851903
Submitted on 31 Jul 2018HAL is a multi-disciplinary open access archive for the deposit and dissemination of sci-entific research documents, whether they are pub-lished or not. The documents may come from teaching and research institutions in France or abroad, or from public or private research centers.
L’archive ouverte pluridisciplinaire HAL, est destinée au dépôt et à la diffusion de documents scientifiques de niveau recherche, publiés ou non, émanant des établissements d’enseignement et de recherche français ou étrangers, des laboratoires publics ou privés.
Correlating low energy impact damage with changes in
modal parameters: a preliminary study on composite
beams
Amir Shahdin, Joseph Morlier, Yves Gourinat
To cite this version:
Amir Shahdin, Joseph Morlier, Yves Gourinat. Correlating low energy impact damage with changes in modal parameters: a preliminary study on composite beams. Structural Health Monitoring, SAGE Publications (UK and US), 2009, 8 (6), pp.523-536. �10.1177/1475921709341007�. �hal-01851903�
O
pen
A
rchive
T
oulouse
A
rchive
O
uverte (
OATAO
)
OATAO is an open access repository that collects the work of Toulouse researchers and makes it freely available over the web where possible.
This is a author-deposited version published in: http://oatao.univ-toulouse.fr/
Eprints ID: 2112
To link to this article: DOI:10.1177/1475921709341007
URL: http://dx.doi.org/10.1177/1475921709341007
To cite this version: GOURINAT, Y. MORLIER, J. SHAHDIN, A Correlating low energy impact damage with changes in modal parameters: a preliminary study on composite beams. Structural Health Monitoring, 2009, vol. 8, n°6, pp. 523-536, ISSN 1475-9217
Any correspondence concerning this service should be sent to the repository administrator:
Correlating low energy impact damage with changes in modal parameters: A
preliminary study on composite beams
Amir Shahdin1,*, Joseph Morlier* and Yves Gourinat*
*Université de Toulouse, ISAE, Département Mécanique des Structures et Matériaux (DMSM) 10 av. Edouard Belin BP54032, 31055 Toulouse Cedex 4, France
1 Corresponding author. Email: [email protected], Phone no, + (33) 5 61 33 83 86, Fax no, + (33) 5 61 33 83 30
This paper is an experimental study of the effects of multi-site damage on the vibration response of a composite beam damaged by low energy impact. The variation of the modal parameters with different levels of impact energy and density of impact is studied. Specimens are impacted symmetrically in order to induce a global rate of damage. A damage detection tool Damage Index is introduced in order to verify the estimation of damping ratios. Design of Experiments is used to establish the sensitivity of both energy of impact and density of damage. The DOE analysis results (using natural frequency only) indicate that impact energy for 2nd, 3rd and 4th bending modes is the most significant factor contributing to the changes in the modal parameters for this kind of symmetrical dynamic test.
Keywords Damage detection · Vibration measurement · Design of experiments · Composites
1
Introduction
The use of composite materials in structural components has increased dramatically in recent years by offering enormous potential and benefits to the aerospace industry and many other sectors. However composite laminates are susceptible to delamination from a wide variety of sources which include fabrication stress, environmental cyclic loading and foreign object impact damage [1-3]. Delamination may lead to severe degradation of the mechanical behavior of structures due to loss of structural integrity. The detection of delamination and the study of their influences on the mechanical behavior of delaminated composite structures has become an important issue in recent times. Therefore in this article, problems at low impact energy levels are
analyzed, which arise before delamination (behavior of the structure being relatively linear). So the aim of this work is to understand the relationship between changes in dynamic parameters (natural frequencies and damping ratios) due to impact damage in composite beam specimens at early stages.
The purpose of structural health monitoring systems is to provide information about the condition of a structure in terms of reliability and safety before the damage threatens the integrity of the structure. So the diagnosis of the damage in structural systems requires an identification of the location and type of damage, as well as the quantification of the degree of damage. Therefore, several techniques have been used to detect damage in structures. In recent years, structural health monitoring using vibration based damage detection has been rapidly expanding and shown to be a feasible approach for detecting and locating damage. Doebling et al. [4] gave an overview of the vibration based damage detection methods. The main idea behind this technique is that modal parameters i.e., frequencies, damping ratios and mode shapes change in a detectable manner due to loss of stiffness and mass. Several techniques have been researched for detecting damage in composite materials, many of them showing the effectiveness of dynamic response measurements in monitoring the health of engineering structures [5-16]. These methods are among the earliest and most common, principally because they are simple to implement on any size structure. Structures can be excited by ambient energy, an external shaker or embedded actuators. Accelerometers and laser vibrometers can be used to monitor the structural dynamic responses. Khoo et al. employed different vibration techniques in order to locate damage in structures. They used resonant poles to identify the modes, especially those modes that exhibit relatively large pole shifts are believed to be affected by damage [17]. S.G. Mattson et al. carried out damage detection based on residuals and discussed the phenomenon of false negatives. According to them, false negatives give no indication of damage when damage is present. [18].
The delamination-induced decrease of natural frequencies is one of the most commonly practiced approaches in damage detection. Several authors have tried to explain structural damage
by changes in natural frequencies. Adams and Cawley [19] localized damage in structure from measurements of natural frequencies. Yam et al. [20] showed that with the increase in delamination size the natural frequency decreases, by artificially creating a crack and then vibrating the structure with the help of an embedded actuator. Giannoccaro [21] studied the effects of fatigue damage on modal properties of composite specimens and found a considerable shift towards the left in the frequency response functions (FRF) after about 90% of the specimen life. Shang et al. [22] showed that the changes in the natural frequencies of spot-welded joint specimens varied non-linearly with damage fraction. Arkaduiz [23] found that the presence of a self created delamination reduces the natural frequencies of a composite beam when harmonically excited.
The introduction of damage into a material generally results in an increase of damping, which is related to energy dissipation during dynamic excitation. Therefore, damping has also been proposed as a potentially sensitive and attractive damage indicator, though research works related to damping are fewer in number than those on natural frequency. The main sources of internal damping in a composite material arise from microplastic and viscoelastic phenomena in the matrix together with the interface effects between the matrix and the reinforcement [24]. Zhang and Hartwig [25] recommended damping in the evaluation of damage process which seemed more sensitive than the natural frequencies. Gibson [26] vibration tested composite specimens and found that for higher modes damping loss factor measurements are more significant than frequency measurements. Similarly, Saravanos and Hopkins [27] experimented on composite beams, and showed that the delamination has a more profound effect on modal damping than the natural frequencies. Colakoglu [28] showed that the damping factor increased with the number of fatigue cycles. Richardson and Mannan [29] found that the loss of stiffness in a structure corresponds to a decrease in modal damping frequency combined with an increase in damping. Another way to correlate damage with change in dynamic parameters is to use mode shapes. Works of Pandey et al can be cited as a first reference in this context [30]. This domain of Structural Health Monitoring offers a lot of potential coupled with advanced signal processing tools [31-33].
This paper focuses on the correlation of modal parameters and impact damage in composite beams from an experimental point of view based on low energy impacts. Nowadays, laser vibrometers are employed extensively to measure vibrations instead of accelerometers [34-36]. The article is arranged in such a way that first the material and the experimental procedure are presented then the experimental results are discussed and finally a design of experiments is carried out on the experimental results. A nomenclature for all the symbols used in this article is also provided at the end.
2
Material and Specimen
Resin-containing carbon-fiber/epoxy prepreg of T300/914 is used to fabricate the test specimens. The material is supplied by Hexcel composites, the physical properties are set out in Table 1). The specimens are processed in a press. The curing cycle of the laminates is 2h at 180°C with a warming-up cycle of 0.5h at 135°C. The laminates are cut into beams using a diamond wheel cutter, following the ASTM D3039/D3470 standards.
Table 1 Physical properties of carbon/epoxy prepreg T300/914
Properties Symbol Value
Young’s modulus in fiber direction E1 1.44 106 MPa
Young’s modulus in transverse direction E2 1.0 105 MPa
Shear Modulus G12 4.2 103 MPa
Poisson ratio μ12, μ23, μ31 0.25, 0.3, 0.017
Volume density ρ 1550 kg/m3
Two types of composite beam specimens are tested in this article. The first ones have a thickness of 1.04mm having 8 plies and are discussed under the name of Type 1 specimens, whereas the others have a thickness of 3.12mm having 24 plies and are described as Type 2 specimens. The geometric configurations and lay-up of these two types of specimens are listed in
Table 2. The lay-up is chosen as such, in which the delamination is said to have more profound effects on the dynamic characteristics [27].
Table 2 Geometry and lay-up of the two types of composite test specimens
Type 1 Specimens (1.04mm thickness) Type 2 Specimens (3.12mm thickness)
Length 480 mm Length 480 mm
Width 50 mm Width 50 mm
Thickness 1.04 mm Thickness 3.12 mm
Number of layers (plies) 8 Number of layers (plies) 24
Thickness of each ply 0.125 mm Thickness of each ply 0.125 mm
Lay-up [0/90/45/-45]s Lay-up [(0/90/45/-45)3]s
The vibration tests are carried out with two steel masses attached at the ends [39]. The aim of putting these masses at the ends is to enhance the difference in the modal parameters between the undamaged and the damaged test specimens. The dimensions of these end masses for specimens of Type 1 and 2 are listed in Table 3.
Table 3 Dimensions of the end masses for the two types of composite test specimens
End Masses for Type 1 Specimens End Masses for Type 2 Specimens
Length 50 mm Length 50 mm
Width 12 mm Width 30 mm
Thickness 8 mm Thickness 10 mm
Material Steel Material Steel
3
Experimental Procedure
Two types of experiments are carried out in this work. Vibrations tests for measuring the dynamic characteristics of the composite test specimens and impact tests in order to create damage in the specimens. The experimental procedure for these two types of tests is discussed separately.
3.1 Vibration Tests
The experimental equipment used to obtain the modal parameters discussed in this paper is shown in Figure 1. The experimental set-up is that of a free-free beam excited at its center, based on Oberst method [38]. The Oberst method states that a free-free beam excited at its center has the
same dynamical behavior as that of a half length cantilever beam. The test specimen is placed at its center on a B&K force sensor 8200 which is then assembled on a shaker supplied by Prodera having a maximum force of 100N. A fixation system is used to place the test specimens on the force sensor. The fixation system and the end masses are glued to the test specimens with a HBM X60 rapid adhesive. The response displacements are measured with the help of a Laser Vibrometer OFV-505 provided by Polytec. The shaker, force sensor and the laser vibrometer are manipulated with the help of a data acquisition system supplied by LMS Test Lab.
Figure 1 Diagram of the experimental set-up
The center of the test specimens is excited at Point 17 as shown in Figure 2. Burst random excitation is used which is a broadband type excitation signal [0-1600 Hz]. The signal is averaged 10 times for each measurement point. Hanning windows are used for both the output and the input signals. The linearity is checked and a high frequency resolution (Δf = 0.25Hz) for precise modal parameter estimation is used. Response is measured at 33 points that are symmetrically spaced in three rows along the length of the beam (Figure 2). The modal parameters are extracted by a frequency domain parameter estimation method (Polymax) integrated in the data acquisition system.
Figure 2 Composite test specimen with location of damage, excitation and measurement points
3.2 Impact Tests
A drop tower is employed to carryout the impact tests as shown in Figure 3 and a detailed cut away of the drop assembly is shown in Figure 4.
Figure 3 Arrangement of the test equipment for the impact test
The impactor tip has a hemispherical head with a diameter of 12.7mm. The specimens for the impact tests are fixed at all ends in the support system. Different sensors are used to measure
force, acceleration and the velocity of impact. A force sensor (type 9051A) provided by Kistler is placed between the impactor tip and the free falling mass of 2kg (Figure 4). A Kistler accelerometer (type 8704B5000) is placed at the top of the main block. The impact velocity is measured with the help of an optic sensor having a laser diode. The sensor is positioned in such a way that the main block’s grooves pass the laser beam just before the impact. Further details on the impact test methodology of this drop tower can be found in the reference [40].
Figure 4 Detailed cutaway of the drop assembly, the guidance tube and the blocking system
The impact height h between the specimen surface and the impact head is calculated with
impact tip E h 1.1 g.m = (1) where g is the gravitational constant, mtip is the total weight of the impact head, freefalling mass mass, force sensor and the accelerometer which in this case is 2.03 kg and Eimp is the energy of impact. The factor 1.1 is to compensate losses due to friction between the guidance tube and the drop assembly. The impact parameters for the Type 1 (1.04 mm thickness) and Type 2 (3.12 mm thickness) test specimens are listed in Table 4.
Table 4 Impact test parameters
Beam Thickness Energy of
impact (J) Height (mm) Velocity of impact (m/s) 1 1.04 mm 2.5 138 1.59 2 3.12 mm 3 166 1.74 3 3.12 mm 4 221 1.98 4 3.12 mm 7 387 2.64 5 3.12 mm 8 442 2.83 6 3.12 mm 9 498 3.07 7 3.12 mm 10 553 3.24
Weight of mass + impactor tip + force sensor = 2.03 kg
The composite beam specimens have three states. First one is the undamaged state (UD), the second is the damage state due to 4 impacts (D1) and the third is the damage state due to 8 impacts (D2). Vibration tests are carried out after each of these three states. A simple case is studied where the impact points are chosen as such that the damage is symmetric on both sides of the two axes of symmetry. The impact parameters (Table 4) show that the impact energies can be classified into two major groups. A low impact energy group comprising of impact energies of 3J and 4J, and a high impact energy group with impact energies of 7J to 10J.
4
Results and Discussion
4.1 Tracking of Poles for Damage Detection
Modal parameter estimation is a special case of system identification where the a priori model of the system is known to be in the form of modal parameters. The identification process consists of estimating the modal parameters from frequency response function (FRF) measurements. Modal identification uses numerical techniques to separate the contributions of individual modes of vibration in measurements such as frequency response functions. Each term of the FRF matrix can be represented in terms of pole location and a mode shape. The FRF matrix model is represented mathematically by:
[
]
modes[
]
[
]
k 1 R(k) R(k) * H( ) (j (k) p(k)) (j (k) p(k)*) = ⎧ ⎫ ω = ⎨ ω − + ω − ⎩ ⎭∑
⎬ (2)The numerator R(k) is the residue of the FRF and is a function of the product between mode shape components at all points. The denominator gives the modal frequency and modal damping (second term in Equation (2) is the complex conjugate term). The poles p(k), are the roots that satisfy this equation and are related to modal frequency and damping as follows:
p(k)= −σ(k) j (k)+ ω (3)
The magnitude of each pole is the undamped natural frequency (ωn). The undamped natural frequency (ωn) and the modal damping (σ ) are related to mass, stiffness and damping as follows: given by 2 2 n d K (k ) M ω = ω + σ = (4) C 2 (k) M σ = (5)
The effect of physical properties on poles in the complex s-plane is illustrated in Figure 5.
From Figure 5, it can be observed that a change in stiffness affects only the frequency, while changes in mass and structural damping affect both modal damped frequency (ωd) and modal damping ( ). For this study, the primary interest is to study the decrease in the modal damped frequency (ωd) and the increase in modal damping (
σ
σ ) due to damage in the specimens [29].
4.2 Significance of End Masses
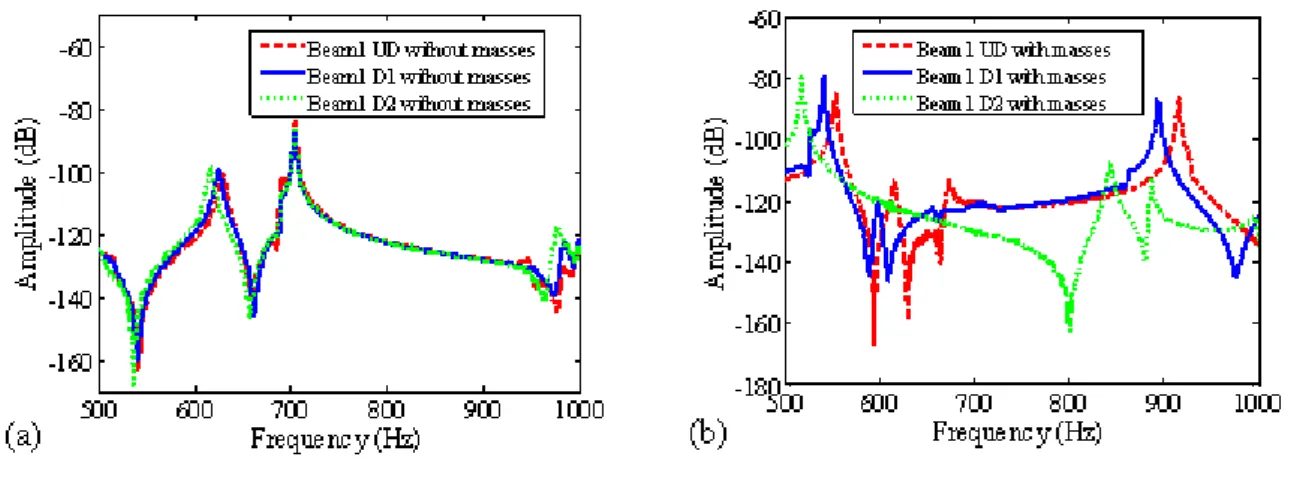
As discussed before, the end masses are placed to enhance the difference between the modal parameters for the undamaged and the damaged cases. In order to verify this, vibration tests are carried out on Beam 1, tested in the intact condition (UD), first without end masses and then with the end masses. Then it is impacted at 2.5J first at 4 points (D1) and then at 8 points (D2). After each of these two series of impacts on Beam 1, vibration tests are again carried out both with and without masses. A comparison of the frequency response functions for the measurement point 5 of Beam 1 with and without end masses is shown in Figure 6.
Figure 6 Comparison of frequency response functions (FRF) of Beam 1 at measurement point 5 for the states UD (undamaged), D1 (damaged at 4 impact points) and D2 (damaged at 8 impact points) for (a) Beam 1 without end masses and (b) Beam 1 with end masses
From Figure 6, it is clear that the difference in the damped modal frequencies before and after impact is greater for the case with end masses. The disadvantage of Type 1 specimens is that, the maximum energy for which they can be impacted is 5J. Above this energy level, the impactor tip penetrates the specimens creating severe damage (creating a hole). The aim of the impact tests is to damage locally the test specimens instead of damaging them globally. Therefore further vibration tests have been carried out on Type 2 specimens (3.12 mm thickness).
4.3 Frequency and Damping Changes
Frequency and damping changes are studied with the help of bending modes as they have the largest amplitudes for the type of test configuration presented in this article. The first three bending mode shapes of the composite beam calculated by the Polymax method integrated in LMS Test Lab are shown in Figure 7.
Figure 7 Mode shapes of composite beam calculated by the Polymax method (a) first bending, (b) second bending and (c) third bending
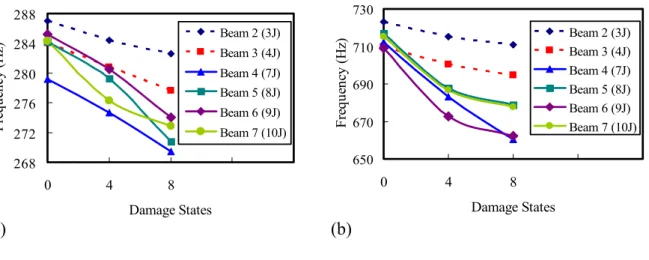
In this section the first bending mode is not studied, because the difference in the damped natural frequencies between the damaged states (D1 and D2) and undamaged state (UD) for the first mode is very small. For the 2nd and 3rd bending modes, the variation of damped natural frequency as a function of the undamaged (UD) and the two damage states (D1 and D2) is presented in Figure 8.
268 272 276 280 284 288 0 4 8 12 16 Damage States F re que nc y ( H z) Beam 2 (3J) Beam 3 (4J) Beam 4 (7J) Beam 5 (8J) Beam 6 (9J) Beam 7 (10J) (a) 650 670 690 710 730 0 4 8 12 Damage States F re que nc y ( H z 16 ) Beam 2 (3J) Beam 3 (4J) Beam 4 (7J) Beam 5 (8J) Beam 6 (9J) Beam 7 (10J) (b)
Figure 8 Variation of damped natural frequencies with damage states for (a) 2nd bending mode and (b) 3rd bending mode : UD is undamaged state, D1 is damaged at 4 points of impact and D2 is damaged at 8 points of impacts, for six levels of impact energy for Type 2 specimens.
As discussed before in section 4.1, that damage in the specimens prompts a decrease in natural frequencies so from Figure 8, it is clear that the decrease in the natural frequencies in case of the high energy group (7, 8, 9 and 10J) is more prominent than that for the low energy group (3J and 4J). Beam 4 for the second bending mode (Figure 8a), has a natural frequency lower than that of the other beams for the undamaged case (UD) but this is not the case for the third bending mode (Figure 8b). This anomaly outlines the inherent possibility of false negatives which can arise due to boundary conditions and gives no indication of damage when it is present as discussed in the reference [18].
The shift in the natural frequencies between the undamaged and the damaged cases is more prominent at higher frequencies. This is evident in Figure 9, which shows a comparison of the sum of the frequency response functions for Beam 7 (impacted at 10J) for the undamaged case (UD), damaged at 4 points (D1) and damaged at 8 points (D2). The sum of the FRF can be compared as for each beam 33 symmetric measurement points have been chosen and the eight impact points are also symmetric on both sides of the two major axes of symmetry.
Figure 9 Comparison of the sum of the frequency response functions for Beam 7 for the undamaged case (UD), damaged at 4 points (D1) and damaged at 8 points (D2)
The variation of damped natural frequencies with damping ratios (shift in the s-plane) for the Beams 3, 4 and 6 for the 2nd and 3rd bending modes is plotted in Figure 10.
268 272 276 280 284 288 0 0,2 0,4 0,6 Damping ratio (%) Fr eq ue nc y ( H z) Beam 3 (4J) Beam 4 (7J) Beam 6 (9J) - + Density of Damage UD D2 D1 UD D1 D2 UD D1 D2 (a) 644 658 672 686 700 714 728 0 0,2 0,4 0,6 Damping ratio (%) Fr eq ue nc y (Hz ) Beam 3 (4J) Beam 4 (7J) Beam 6 (9J) UD UD UD D1 D2 D1 D1 D2 D2 - + Density of Damage (b)
Figure 10 Variation of natural frequencies with damping ratio, for an increase in density of damage, for (a) 2nd bending mode and (b) 3rd bending mode, for Beam 3 (4J), Beam 4 (7J), Beam 6 (9J), where (UD) is undamaged state, (D1) damaged at 4 impact points and (D2) damaged at 8 impact points
Figure 10 shows that damping increases whereas the frequency decreases with the increase in damage. The increase in damping is more prominent in specimens impacted at 7J and 9J (Beam 4 and 6) as compared to 4J (Beam 3). So it can be said that the variation of damping ratio validates the theoretical reasoning presented in Section 4.1.
4.4 Damage Index Variations
Another way to explain the changes in modal parameters due to damage is with the help of a Damage Index (DI) [37]. The first step is to calculate the integral (Ix) of the amplitude of the frequency response functions (FRF) over a defined frequency range (interval) as follows:
fk int x fk int I H( ) + − =
∫
ω dω (6)where H(ω) is the frequency response function matrix obtained experimentally, (fk) is the damped resonant frequency and (int) is the frequency interval chosen.
In the second step, the Damage Index is calculated by taking the percentage difference between the integrals of the resonance peaks of the FRF at the damaged and the undamaged states. In this study, there are two damaged states (D1 and D2) and one undamaged state (UD). So the two damage indices are calculated as follows:
Damage Index for states D1 and UD = 4 100
4 × − = Undamaged x Undamaged x Damaged x I I I DI (7)
Damage Index for states D2 and UD = 8 100
8 × − = Undamaged x Undamaged x Damaged x I I I DI (8)
where IxUndamaged, Ix4Damaged and Ix8Damaged are the integrals of the resonance peaks of the FRF
for the undamaged state (UD), damage state D1 (damaged at 4 points) and damage state D2 (damaged at 8 points) respectively.
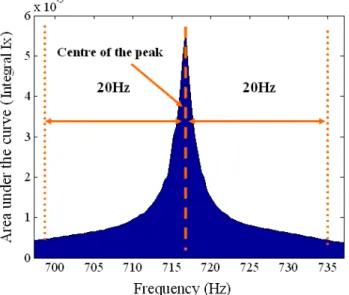
For this article, a frequency interval of ± 20Hz (Figure 11) is chosen to calculate the integral of the resonance peaks of the FRF. In order to verify the robustness of this method, similar calculations have been carried out on frequency intervals of ± 10Hz and ± 40Hz as well. It has been observed that if the intervals are changed, the values of the integral (IX) are different but the damage index always gives the same results being a ratio.
Figure 11 Methodology for the calculation of integral Ix (area under the curve)
The percentage increase in damage index is the percentage difference of DI8 and DI4 based on Equations (7) and (8) and is calculated as follows:
% increase in damage index = DI8 DI4 x100 DI8 − ⎡⎛ ⎞ ⎜ ⎟ ⎢⎝ ⎠ ⎣ ⎦ ⎤ ⎥ (9)
The damage index variation is explained in Figure (12) by plotting the percentage increase in damage index calculated from Equation (9) as a function of the first four bending modes.
Figure 12 Variation of percentage of increase in Damage Index as a function of modes
Figure 12 shows that in case of the low energy impact group (3J and 4J), the percentage increase in damage index is between 2% to 13%. But in the cases of high impact energies (7, 8, 9 and 10J), this percentage ranges from 20% to 60%. Therefore, there is a clear increase in damage index with the rise in impact energy levels which corresponds to damage accumulation in the composite beam specimens.
4.5 Comparison between Damping Ratio and Integral of the Resonance Peaks (Ix)
A comparison between the damping ratio and the integral of the resonance peaks (Ix) is carried out because they both describe the shape of the peak in the frequency response. The damping ratio and the integral (Ix) calculated by Equation (6) plotted as a function of damped natural frequency for the 2nd and 3rd bending modes, for the Beams 3, 4 and 6 is shown in Figure 13. The direction of the increase of damage is represented by the increase in marker size for each plot. The smallest marker size represents the undamaged state (UD), the medium damage at 4 points (D1) and the largest damage at 8 points (D2).
0,1 0,2 0,3 0,4 0,5 0,6 265 271 277 283 289 295 Frequency (Hz) D amp in g R ati o ( % ) 0 0,05 0,1 0,15 0,2 Ix (A re a unde r t he c urve ) Beam 3 (4J) Beam 4 (7J) Beam 6 (9J) Density of Damage -+ (a) 0,1 0,2 0,3 0,4 0,5 0,6 650 670 690 710 730 750 Frequency (Hz) D am pin g Rati o ( % ) 0 0,02 0,04 0,06 Ix (A re a u nd er t he Cu rve ) Beam 3 (4J) Beam 4 (7J) Beam 6 (9J) Density of Damage + -(b)
Figure 13 Variation of Damping ratio and Integral (Ix) as a function of frequency for (a) second
bending mode (b) third bending mode for Beam 3 (4J), Beam 4 (7J), Beam 6 (9J)
Damping ratio (4J), (7J) and (9J). Integral (4J), (7J) and (9J).
It can be seen from Figure 13, that the variation of damping ratio and the integral of the amplitudes of the resonance peaks (Ix) show similar behavior for the same beam specimen which is not surprising because they both describe the form of the resonance peaks. For the other three Type 2 beams (Beam 2, 5 and 7), the damping ratios estimated by the Polymax method are not stable because they do not show an increase with the increase in damage in the specimens. This can be attributed to the fact that damping is a phenomenon that is harder to estimate as compared to the natural frequency [41,42]. On the other hand, the integral (Ix) values for these three beams (Beam 2, 5 and 7) increase with the increase in damage in the specimens. This variation of the integral (Ix) with the increase in damage for Beam 2, 3 and 5 for the 2nd and 3rd bending modes is plotted in Figure 14. As both damping ratio and damage index (based on the integral Ix) explain the same phenomenon, therefore the reason for introducing the Damage Index (DI) parameter is to verify the damping ratio results estimated by Polymax which are not stable for the case of Beam 2, 3 and 5. In using DI, an additional tool is introduced for understanding the damping behavior of damaged composite beams.
0,08 0,1 0,12 0,14 0,16 270 275 280 285 290 Frequency (Hz) Ix ( A re a u nd er th e cu rv e) Beam 2 (3J) Beam 5 (8J) Beam 7 (10J) -+ Density of Damage (a) 0,022 0,028 0,034 0,04 0,046 670 685 700 715 730 Frequency (Hz) Ix ( A rea u nd er th e cu rv e) Beam 2 (3J) Beam 5 (8J) Beam 7 (10J) Density of Damage + -(b)
Figure 14 Variation of Damping ratio and Integral (Ix) as a function of frequency for (a) second bending mode (b) third bending mode for Beam 2 (3J), Beam 5 (8J), Beam 7 (10J)
4.6 Design of Experiments
Design of experiments is a powerful analysis tool for modeling and analyzing the different factors which affect an experimental process and the output of that process. This study is carried out on the six Type 2 composite beam specimens with an aim to identify the factors which have the most significant effect on the experimental results (natural frequencies). The two factors chosen for the design of experiments are the energy of impact and the density of damage. For the energy of impact there are six levels (3, 4, 7, 8, 9 and 10J) and for the density of damage there are two levels (damage at 4 impact points (D1), damage at 8 impact point (D2)). By keeping in view the levels of the two factors, a 6x2 full factorial design is chosen. The results of the design of experiments are shown with the help of leverage plots in Figure 15.
Figure 15 Results of Design of Experiments (Leverage plots with confidence curves)
The leverage plots are shown with confidence curves in dotted blue with their respective values in blue on the y axis. The horizontal red dotted line shows the current predicted value of each Y variable for the current values of the X variables. The black lines show the prediction trace. If the confidence curves cross the horizontal red lines, then the effect of that factor is said to be significant on the results. If the confidence curves are asymptotic to the horizontal line then the effect of the factors is marginally significant and finally if the confidence region between the curves contains the horizontal line then the effect is said to be insignificant. The results shown in Figure 14 prove that the effects of impact energy are significant on the natural frequencies for the 2nd, 3rd and 4th bending modes. The effects of the density of impact are partially significant on these modes as compared to the impact energy. However, these two factors have no influence on the natural frequency of the first bending mode because the frequency shift between the damaged and the undamaged cases is insignificant.
5
Conclusion
Dynamic tests have been carried out on pristine and damaged composite beam specimens using burst random excitation. The variation of modal parameters with damage is studied with the help of changes in natural frequency, damping ratio and damage index. Vibration tests are carried out by placing steel masses at the two ends of the composite beams in order to increase the difference in modal parameters between the undamaged and the damaged cases. Results show that with the accumulation of damage in the specimens, there is a decrease in natural frequency accompanied by an increase in the damping ratio. Damage index tool is also used to study the changes in the modal parameters before and after impact. Damage index is based on the integral of the amplitudes of the frequency response functions (FRF) and therefore estimates the phenomenon of dissipation in the specimens. It is seen that the damage index increases with the increase of damage in the specimens. Therefore the aim of the damage index is to verify the damping ratio results estimated by Polymax and to have an additional tool for understanding the damping behavior of damaged composite beams. Finally a design of experiments is carried out on the results of natural frequencies. It is verified that the energy of impact is the most significant factor and its increase generates a shift in the s-plane.
In the future, similar experiments shall be carried out with sine dwell testing in order to have a better estimation of the damping ratio. The Design of Experiments shall also be expanded by taking into account some other parameters e.g., size and shape of the impactor head, thickness of the specimens and the lay-up of the plies.
6
Nomenclature
Type 1 = Composite beam specimens of 1.04 mm thickness Type 2 = Composite beam specimens of 3.12 mm thickness
UD = undamaged state
D1 = damaged state at 4 points D2 = damaged state at 8 points
h = impact height Eimp = energy of impact (J)
mtip = Total weight of impactor tip + freefalling mass + force sensor + accelerometer g = gravitational constant
FRF = Frequency Response Function
H(ω) = Frequency Response Function matrix j = Imaginary axis in the complex plane * = Complex conjugate
ω(k) = Modal damped frequency for kth mode (rad/s) p(k) = Pole location for the kth mode
R(k) = Residue magnitude (FRF/s) σ (k) = Modal damping for kth mode
ωn = Undamped natural frequency (rad/s) ωd = Damped natural frequency (rad/s)
C = Structural damping matrix (force/velocity) K = Stiffness matrix (force/displacement) M = Mass matrix
Ix = Integral of the amplitude of the frequency response functions (FRF) int = Frequency interval (user defined) (Hz)
fk = Resonance frequency (Hz) DI = Damage Index
DI4 = Damage Index for states D1 and UD DI8 = Damage Index for states D2 and UD
Acknowledgments
The authors gratefully thank M. Labarrère (ISAE - Campus ENSICA) for his technical support during the experimental work.
References
1. S.W. Tsai and H.T. Hann. (1980). Introduction to composite materials, Technic Publishing Company, Westposrt, Connecticut.
2. V.C. Li, T. Kanda and Z. Lin. (1998). Influence of Fiber/Matrix interface properties on complementary energy and composite damage tolerance. Key Engineering Materials, 145, 465. 3. R.M. Gadelrab. (1996). The effect of delamination on the natural frequencies of a laminated composite beam. Journal of Sound and Vibration, 197(3), 283-292.
4. S.W. Doebling, C.R. Farrar, M.B. Prime and D.W. Shevitz. (1996). Damage identification and health monitoring of structural and mechanical systems from changes in their vibration characteristics: a literature review. Research Report, LA-13070-MS, ESA-EA, Los Alamos National Laboratory.
5. R.D. Adams, P. Cawley, C. Pye, C, and B.J Stone. (1978). A vibration technique for non-destructively assessing the integrity of structures. Journal of Mechanical Engineering Science, 20-21, 93–100.
6. M.L. Fugate, H. Sohn and C.R. Farrar. (2001). Vibration-Based Damage Detection Using Statistical Process Control. Mechanical Systems and Signal Processing, 15(4), 707-721.
7. K. Waldron, A. Ghoshal, M.J. Schulz, M.J. Sundaresan, F. Ferguson, P.F. Pai and J.H. Chung. (2002). Damage Detection Using Finite Elements and Laser Operational Deflection Shapes. Journal of Finite Elements in Analysis and Design, 38, 193-226.
8. M.J. Sundaresan, P.F, Pai, A. Ghoshal, M.J Schulz, F. Ferguson and J. Chung. (2001). Methods of distributed sensing for health monitoring of composite material structures, Composites A Journal, 32, 1357-1374.
9. J.R. LeClerc, K. Worden, W.J. Staszewski and J. Haywood. (2007). Impact Detection in an Aircraft Composite Panel – a Neural Network Approach. Journal of Sound and Vibration, 299(3), 672-682.
10. H.T. Banks, D.J. Inman, D.J. Leo and Y. Wang. (1996). An experimentally validated damage detection theory in smart structures. Journal of Sound and Vibration, 191, 859–880.
11. L. Yu and L. Cheng. (2007). Experimental validation of vibration-based damage detection for static laminated composite shells partially filled with fluid. Composite Structures, 79(2), 288-299. 12. M.H. Richardson. (1980). Detection of damage in structures from changes in their dynamic (modal) properties—a survey, NUREG/CR-1431, U.S. Nuclear Regulatory Commission, Washington, District of Columbia.
13. J.J. Tracy and G.C. Pardoen. (1989). Effect of delamination on the natural frequencies of composite laminates. Journal of Composite Materials, 23(12), 1200–1215.
14. D.K. Linder, G.B. Twitty and S. Osterman. (1993). Damage detection for composite materials using dynamic response data, adaptive structures and materials symposium, ASME Winter Annual Meeting, New Orleans, Los Angeles.
15. F. Garesci, L. Catalano and F. Petrone. (2006). Experimental results of a damage detection methodology using variations in modal parameters, Experimental Mechanics, 4, 441-451.
16. Y. Zou, L. Tong and G.P. Steven. (2000). Vibration-based model-dependent damage (delamination) identification and health monitoring for composite structures - a review. Journal of Sound and Vibration, 230(2), 357-378.
17. L.M. Khoo, P.R. Mantena and P. Jadhav. (2004). Structural damage assessment using vibration modal analysis. Structural Health Monitoring, 3(2), 177-194.
18. S.G. Mattson and S.M. Pandit (2006). Damage detection and localization based on outlying residuals, Smart Materials and Strcutures, 15, 1801-1810.
19. R.D. Adams and P. Cawley. (1979). The localisation of defects in structures from measurements of natural frequencies. Journal of Strain Analysis, 14, 49–57.
20. L.H. Yam and L. Cheng. (2005), Damage detection of composite structures using dynamic analysis. Key Engineering Materials, 295-296, 33-39.
21. N.I. Giannocaro and A. Messina. (2005). Fatigue damage evaluation of notched specimens through resonance and anti-resonance data. Engineering Failure Analysis, 13, 340-352.
22. D.G. Shang, M.E Barkey, Y, Wang and T.C. Lim. (2002). Effect of fatigue damage on the dynamic response frequency of spot-welded joints. International Journal of Fatigue, 25, 311-316. 23. J.Z. Arkaduiz. (2005). Non-linear vibration of a delaminated composite beam. Key Engineering Materials, 293-294, 607-614.
24. R.D. Adams. (1993). Damping in composites. Material Science Forum, 119-121, 3-16.
25. Z. Zhang and G. Hartwig. (2004). Relation of damping and fatigue damage of unidirectional fibre composites. International Journal of Fatigue, 24, 713-738.
26. R. F. Gibson. (2000). Modal vibration response measurements for characterization of composite materials and structures, Composites Science and Technology. 60, 2769-2780.
27. D.A. Saravanos and D.A.Hopkins. (1995). Effects of delaminations on the damped dynamic characteristics of composites. Journal of Sound and Vibration, 192, 977-993.
28. M. Colakoglu. (2003). Description of fatigue damage using a damping monitoring technique, Turkish Journal of Engineering and Environmental Sciences, 27, 125-130.
29. M.H. Richardson and M.A. Mannan. (1993). Correlating minute structural faults with changes in modal parameters. Proceedings of SPIE, International Society for Optical Engineering, 1923(2), 893–898.
30. A.K. Pandey, M. Biswas and M.M. Samman. (1991). Damage detection from changes in curvature mode shapes. Journal of Sound and Vibration,145, 321–332.
31. J. Morlier, F. Bos and P. Castéra. (2006). Diagnosis of a portal frame using advanced signal processing of laser vibrometer data, Journal of Sound and Vibration, 297(1-2), 420-431.
32. E. Douka, S. Loutridis and A. Trochidis. (2003). Crack identification in beams using wavelet analysis, International Journal of Solids and Structures, 40, 3557–3569
33. J.C. Hong, Y.Y. Kim, H.C. Lee and Y.W. Lee. (2002). Damage detection using the Lipschitz exponent estimated by the wavelet transform: applications to vibration modes of a beam, International Journal of Solids and Structures, 39, 1803–1816.
34. M.Y. Amraoui and N.A.J. Lieven. (2004). Laser vibrometry based detection of delaminations in glass/epoxy composites, Journal of Sound and Vibration, 126, 430-437.
35. M.J. Sundaresan. (2003). Experimental damage detection on a wing panel using vibration deflection shapes. Structural Health Monitoring, 2(3), 243-256.
36. B J Halkon, S R Frizzel and S J Rothberg. (2003). Vibration measurements using continuous scanning laser vibrometry: velocity sensitivity model experimental validation. Measurement Science and Technology. 14, 773-783.
37. N. Cheraghi and M.J. Riley. (2005). A novel approach for detection of damage in adhesively bonded joints in plastic pipes based on vibration method using piezoelectric sensors. Systems, Man and Cybernetics, IEEE International Conference, 4, 3472- 3478.
38. J.L. Wojtowicki and L. Jaouen. (2004). New approach for the measurements of damping properties of materials using Oberst beam, Review of Scientific Instruments, 75(8), 2569-2574. 39. K. Vanhoenacker, J. Schoukens, P. Guillaume and S. Vanlanduit (2004). The use of multisine excitations to characterise damage in structures, Mechanical Systems and Signal Processing, 18, 43-57.
40. S. Petit, C. Bouvet, a. Bergerot and J.J. Barrau (2007). Impact and compression after impact experimental study of a composite laminate with a cock thermal shield, Composites Science and Technology, 67, 3286-3299.
41. A.M. Iglesias. (2000). Investigating various modal analysis – Extracting techniques to estimate damping ratio. Ph.D. Dissertation, Virginia Polytechnic Institute, USA.
42. J. Morlier , B. Chermain, Y. Gourinat. (2009). Original Statistical Approach for the Reliability in Modal Parameters, Proceedings of the International Modal Analysis Conference, IMAC XXVII.
![Table 2. The lay-up is chosen as such, in which the delamination is said to have more profound effects on the dynamic characteristics [27]](https://thumb-eu.123doks.com/thumbv2/123doknet/12297437.323759/7.892.95.797.249.403/table-chosen-delamination-said-profound-effects-dynamic-characteristics.webp)