HAL Id: hal-01662673
https://hal.archives-ouvertes.fr/hal-01662673
Submitted on 17 Jan 2018
HAL is a multi-disciplinary open access
archive for the deposit and dissemination of
sci-entific research documents, whether they are
pub-lished or not. The documents may come from
teaching and research institutions in France or
abroad, or from public or private research centers.
L’archive ouverte pluridisciplinaire HAL, est
destinée au dépôt et à la diffusion de documents
scientifiques de niveau recherche, publiés ou non,
émanant des établissements d’enseignement et de
recherche français ou étrangers, des laboratoires
publics ou privés.
2010 MEGAPOLI winter campaign
C. Dolgorouky, V. Gros, R. Sarda-Esteve, V. Sinha, J. Williams, Nicolas
Marchand, S. Sauvage, L. Poulain, J. Sciare, B. Bonsang
To cite this version:
C. Dolgorouky, V. Gros, R. Sarda-Esteve, V. Sinha, J. Williams, et al.. Total OH reactivity
measure-ments in Paris during the 2010 MEGAPOLI winter campaign. Atmospheric Chemistry and Physics,
European Geosciences Union, 2012, 12 (20), pp.9593-9612. �10.5194/acp-12-9593-2012�. �hal-01662673�
www.atmos-chem-phys.net/12/9593/2012/ doi:10.5194/acp-12-9593-2012
© Author(s) 2012. CC Attribution 3.0 License.
Chemistry
and Physics
Total OH reactivity measurements in Paris during the 2010
MEGAPOLI winter campaign
C. Dolgorouky1, V. Gros1, R. Sarda-Esteve1, V. Sinha2, J. Williams3, N. Marchand4, S. Sauvage5,6, L. Poulain7, J. Sciare1, and B. Bonsang1
1Laboratoire des Sciences du Climat et de l’Environnement (LSCE), Unit´e Mixte CEA-CNRS-UVSQ (Commissariat `a
l’Energie Atomique, Centre National de la Recherche Scientifique, Universit´e de Versailles Saint-Quentin-en-Yvelines), UMR8212, 91198 Gif-sur-Yvette, France
2Indian Institute of Science Education and Research (IISER) Mohali, Sector 81 SAS Nagar, Manauli PO Punjab 140306, India
3Max Planck Institute for Chemistry, Air Chemistry Department, 55128 Mainz, Germany
4Aix-Marseille Universit´e, CNRS, LCE FRE 3416, 13331, Marseille, France
5Universit´e de Lille Nord de France, 59000 Lille, France
6Ecole de Mines Douai, Departement Chimie environnement, 59508 Douai, France
7Leibniz – Institut f¨ur Troposph¨arenforschung (IFT), Leipzig, Germany
Correspondence to: V. Gros (valerie.gros@lsce.ipsl.fr)
Received: 16 February 2012 – Published in Atmos. Chem. Phys. Discuss.: 27 April 2012 Revised: 6 September 2012 – Accepted: 17 September 2012 – Published: 22 October 2012
Abstract. Hydroxyl radicals play a central role in the tro-posphere as they control the lifetime of many trace gases. Measurement of OH reactivity (OH loss rate) is important to better constrain the OH budget and also to evaluate the completeness of measured VOC budget. Total atmospheric OH reactivity was measured for the first time in an Euro-pean Megacity: Paris and its surrounding areas with 12 mil-lion inhabitants, during the MEGAPOLI winter campaign 2010. The method deployed was the Comparative Reac-tivity Method (CRM). The measured dataset contains both
measured and calculated OH reactivity from CO, NOx and
VOCs measured via PTR-MS, GC-FID and GC-MS instru-ments. The reactivities observed in Paris covered a range
from 10 s−1to 130 s−1, indicating a large loading of
chemi-cal reactants. The present study showed that, when clean ma-rine air masses influenced Paris, the purely local OH
reactiv-ity (20 s−1)is well explained by the measured species.
Nev-ertheless, when there is a continental import of air masses,
high levels of OH reactivity were obtained (120–130 s−1)
and the missing OH reactivity measured in this case jumped to 75 %. Using covariations of the missing OH reactivity to secondary inorganic species in fine aerosols, we suggest that the missing OH reactants were most likely highly oxi-dized compounds issued from photochemically processed air masses of anthropogenic origin.
1 Introduction
The hydroxyl radical (OH) represents the most important ox-idant in the troposphere. It governs the atmospheric lifetime of most reactive trace species of anthropogenic and biogenic origin and contributes to the self-cleansing capacity of the atmosphere.
Budget of OH radical is still associated with large uncer-tainty. Although the source term is generally dominated by ozone photolysis, additional OH sources can also be signif-icant, especially in a urban environment, such as photolysis from nitric acid or from various aldehydes as described in de-tails in Michoud et al. (2012) and references therein. The lost processes, or sink tem, are also still poorly constrained. In most cases the overall sink term of OH radicals is estimated by the sum of the products of concentration and the rate co-efficient of all individually measured species reactive to the OH radical. This method has proved to be rather limited due to the large number of “OH reactive” volatile organic com-pounds (VOCs) in urban air (Lewis et al., 2000; Xu et al., 2003). Recently, Goldstein and Galablly (2007) postulated
that 105 different VOCs have been detected in the Earth’s
atmosphere. Moreover, recent studies showed that there are unknown reactive species that contribute to the total OH re-activity (Di Carlo et al., 2004; Sinha et al., 2010; Kato et
al., 2011). The necessity of measuring the total sink of OH radicals, also called the OH reactivity (s−1), has therefore be-come evident. Presently three different types of instruments exist for the direct measurement of the total OH reactivity. The LIF community has two versions depending on how they detect the decrease of OH in their reactor. The first method is based on the Laser Induced Fluorescence (LIF) technique which records the decay (loss rate) of the OH radicals. Two versions of instruments using LIF technique exist: one that measures the OH reactivity as the inverse of the atmospheric OH lifetime in a reaction flow tube with a movable OH in-jector (Kovacs and Brune, 2001; Mao et al., 2010; Ingham et al., 2009) the other one uses a laser pump and probe tech-nique (Sadanaga et al., 2005). The second method is called the Comparative Reactivity Method (CRM) and is based on comparative OH reactivity measurement in a flow reactor against the known OH reactivity of an added reagent (e.g.
pyrrole, C4H5N). CRM has been developed and described in
detail by Sinha et al. (2008).
Total OH reactivity has been measured in different envi-ronments for the last decade. Lou et al. (2010) reported 18 studies conducted in urban, rural and forested areas. The ur-ban areas investigated included studies over New York City (summer 2001 and winter 2004), Mexico City Metropoli-tan area (spring 2003), Tokyo (summer 2003, winter 2004), Houston (autumn 2000, autumn 2006), Nashville (summer 1999) and Mainz (summer 2008). The results of these stud-ies are synthetized in Table 4. The ranges of the OH reactivity
registered in these urban areas went from 6 s−1, for the clean
atmosphere of the small city of Mainz, Germany (Sinha et al.,
2008) to 200 s−1, for the extremely polluted air of Mexico
City (Shirley et al., 2006). More recently, Sinha et al. (2012) report measurements from El Arenosillo in Spain, where OH reactivity ranged from below detection limit in marine air
masses up to 70 s−1in continental air masses.
Studies from forested areas have identified high percent-ages of missing OH reactivities, obtained from the com-parison between the measured and the calculated reactivity, (70 % in the tropical forest of Surinam, Sinha et al., 2008 and 50 % in boreal forest in Finland, Sinha et al., 2010), but also in rural areas (50 % in a subtropical rural area in PRD of China, Lou et al., 2010). In contrast, missing OH reactivity studies in megacities reported relatively low levels of miss-ing OH reactivity: maximums of 30 % for New York 2004 and Tokyo 2003. If the studies showed that in the case of the forested areas, the “responsible compounds” of the missing OH reactivity were non-measured biogenic compounds, the question is still open for the origin of the missing OH reac-tivity in an urban area.
This paper presents the OH reactivity measurements by CRM method conducted in January–February 2010 within the framework of the EU project MEGAPOLI (http:// megapoli.dmi.dk), in the city of Paris and its surrounding region (called “Ile de France”) with almost 12 million
in-habitants, and which constitutes one of the few megacities in Europe.
The employed method (CRM) was previously described in only four other studies: Sinha et al. (2008), Sinha et al. (2010), Kim and al. (2011) (but this is a modified ver-sion and not strictly our method) and Sinha et al. (2012). All of these measurements were made in environments poor in NO emissions, as interferences dues to OH recycling via
NO + HO2reactions at NO > 5 ppbv in the setup were
re-ported. This is for the first time that the CRM method has been used to measure OH reactivity measurements in an ur-ban area characterized by high levels of NO emissions, as Paris was identified as a city mainly impacted by traffic emis-sions (Vardulakis et al., 2002). Therefore, the initial part of the article presents the experimental setup and the quantifica-tion of interferences in the system used for the MEGAPOLI winter campaign 2010.
The geographical location of Paris – a relatively small-area basin surrounded by rural small-areas – makes it a favourable place to study purely local OH reactivity levels emitted by a megacity when air masses come from the clean marine west-ern sector, and to characterize the impact of the European contribution when air masses come from the eastern sector.
Within the MEGAPOLI framework a large number of compounds has been simultaneously measured during this
campaign: NOx (sum of NO and NO2), carbon monoxide
(CO), ozone (O3), non-methane hydrocarbons (NMHCs) and
oxygenated VOCs (OVOCs). We could therefore compare the observed OH reactivity with the calculated values, which were derived using the observed concentrations of the trace species.
2 Experimental
2.1 Experimental setup and field deployment
2.1.1 Experimental setup
The comparative reactivity method for measuring the total OH reactivity is described in detail by Sinha et al. (2008). A brief overview of the principle of the measurement is never-theless presented here: firstly, a mixture of pyrrole (C4H5N) and synthetic dry air is injected into the reactor. The
con-centration C1of the pyrrole is monitored in the flow exiting
the reactor by a Proton Transfer Reaction – Mass Spectrom-eter (PTR-MS). Secondly, the UV rays emitted by a mercury lamp produce OH radicals ([OH] < [pyrrole]) to react with
pyrrole (kPy+OH =1.2 × 10⁻¹⁰cm3molecules−1s−1,
Atkin-son et al., 1984). The pyrrole concentration registered now is
C2. Next, the synthetic air is replaced with ambient air. The
OH reactive species contained in the ambient air compete with pyrrole for the available OH radicals. This causes an
in-crease in the pyrrole monitored concentration from C2to C3.
The three measured concentrations, C1, C2and C3, allow the
calculation of the total OH reactivity via the following equa-tion based on competitive kinetics, which has been derived by Sinha et al. (2008).
Rair=
C3−C2 C1−C3
·kPy+OH ·C1 (1)
The schematic diagram of the CRM measurement system de-ployed for the MEGAPOLI campaign is shown in Fig. 1. The glass reactor used for the MEGAPOLI winter campaign is identical in shape and dimension with the one described in Sinha et al. (2008).
To measure C1, C2 and C3, three different instrumental
modules were used: the “synthetic air” module, the “nitro-gen” module and the “ambient air” module (see Fig. 1). The “nitrogen” module is used to produce the OH radical via the UV photolysis of the water molecules imported by the hu-midified nitrogen bubbled through a pure water bottle. The same method to produce OH radicals has largely been used in the techniques of OH radical measurements (LIF measure-ments: Kovacs et al., 2003; Mao et al., 2009).
While switching from C1to C2, the synthetic air entering
the reactor is humidified via the “synthetic air” module. Two mass flow controllers (MFC A and MFC B on the Fig. 1) are used and two flows of a 100 % humidified and dry zero air are mixed together. Their mixing proportion determines the humidity of the final zero air flow. The relative humidity of
C2baseline signal during MEGAPOLI was maintained
con-stant at 50 %, for a temperature of 24◦C. For more details
concerning the correction applied to the data set because of the difference in the humidity of the synthetic air and am-bient air, the reader is referred to Sect. 2.2.2, OH reactivity quantifying tests.
When switching from C2to C3, the “synthetic air”
mod-ule is switched OFF and the “atmospheric air” modmod-ule is then connected, via a 3 way valve. This module consists of a Teflon VOC pump (KNF), a Teflon micro valve and 1/4 and 1/16 inch flow reducing Teflon tubing (see Fig. 1).
The used detector located in the exit of the reactor is a high sensitivity PTR-MS, from Ionicon Analytik, Austria. The PTR-MS technology has been firstly introduced in studies of atmospheric chemistry by Lindinger et al. (1998). For this campaign the main monitored compound is pyrrole which is detected at the mass m/z = 68 a.m.u. Other studies showed that this detector is ideal for measuring pyrrole, as the proto-nated ion does not fragment (Sinha et al., 2008, 2009). Also this mass is known to be free of interferences. The explored calibration range of pyrrole concentrations that are measured is from 0.5 to 250 ppbv, but on field measurements were al-ways higher than 10 ppbv. The instrumental precision is of 6 % for 2 standard deviations (2σ ). The humidity inside the reaction cell is important for accurate determination of the OH reactivity. To track the humidity into the reactor, the masses of the first two water clusters are also monitored: m/z 37 (cluster H3O+H2O) and m/z 55 (cluster H3O+(H2O)2),
Page 42 of 56
1
Figure 1. OH reactivity system during MEGAPOLI winter 2010 2 3 PTR-MS Temperature and relative humidity sensor 1/4’ and 1/16’ restrictor Exhaust Pyrrole [C4H5N] Syn air A Syn air B MFC A MFC B KNF teflon pump MFC MFC UV lamp N2 “Nitrogen” module
‘Synthetic air’ module
“Ambient air’ module C1 and C2
C3
OH production
Mis en forme : Anglais (États Unis)
Fig. 1. OH reactivity system during MEGAPOLI winter 2010.
an approach described by Amman et al. (2006) and Sinha et al. (2008).
Besides the water cluster measurements that were used as proxies for the humidity into the reactor, an extra sensor for relative humidity and temperature was also installed in the exhaust line of the reactor (see Fig. 1). In contrast to the re-activity setup of Sinha et al. (2008) for the CRM used dur-ing the MEGAPOLI winter campaign, no other extra pump has been used at the exhaust line, the reactor being therefore maintained at ambient pressure with no over pressure inside the reactor.
2.1.2 Field deployment
The CRM system was deployed at the Laboratoire d’Hygi`ene de la Ville de Paris (LHVP) during the MEGAPOLI winter campaign 2010 (Fig. 2). The site is located in the heart of Paris (the 13th district) and therefore considered to be repre-sentative of the background pollution of central Paris.
The OH reactivity system was installed in a room where
the temperature was maintained at 24◦C. The ambient air
was sampled through a Teflon line of 1/4 inch of diameter and a length of about 10 m. The inlet was situated on the roof of LHVP, at a height of around 14 meters above the ground level. In order to avoid any particulate contamination, a 0.45 µm Teflon filter was used at the entrance of the sampling line. OH reactivity studies showed that the OH reactivity measure-ments are not influenced by the positioning of a Teflon filter in the entrance of the inlet line (Sadanaga et al., 2006).
Ambient air was then sampled at 150 ml min−1in a
to-tal flow of 245 ml min−1(dilution factor of the OH
reactiv-ity into the reactor of 1.65). The residence time of the com-pounds in the inlet lines was kept at < 35 s by using a Teflon
VOC sampling pump which draws a flow of 3 l min−1. A
1/4 inch and 1/16 inch flow-reducing Teflon tubes were used downstream to stabilize the ambient air flow into the reactor
at 150 ml min−1(see Fig. 1).
Atmospheric OH reactivity measurements were performed between 23 January and 13 February. The time resolution of
the measurements was of 2 min. Gaps in the data set were due to regular check-up of the instrument.
2.2 Reactivity tests
2.2.1 Evaluation of the system
At the beginning of the campaign, a series of tests were con-ducted from 8 to 23 January to characterize the system and the new reaction cell.
To check the accuracy of the CRM OH reactivity quantifi-cation, two standards have been used: a propane gas
stan-dard (Westfalen A.G.; 29.8 ppm in N2; stated uncertainty
5 %) and a standard which was a mixture of 3 compounds in
N2: acetone, methanol and isoprene (Messer; 5.01 ppm
ace-tone, stated uncertainty 5 %; 6.78 ppm methanol, stated un-certainty 5 %; 3.90 ppm isoprene, stated unun-certainty 10 %). The second standard has been analyzed in the laboratory in December 2009 prior to the MEGAPOLI campaign. Differ-ent quantities of standard have been introduced into the re-actor. Using the definition of the OH reactivity, the reactivity due to the standard has been calculated via the equation:
Rtotal=
X
kcompound+OH· [compound] (2)
where the kcompound+OH represents the constant rate of
each compound (propane, acetone, methanol and
iso-prene) with the OH radical (kOH+propane=1.1 × 10⁻¹²cm3
molecule−1s−1, kOH+acetone=1.8 × 10⁻²³cm3molecule−1
s−1, kOH+methanol=7.65×10⁻¹³cm3molecule−1s−1, kOH+
isoprene = 1.0×10⁻¹⁰cm3molecule−1s−1, Atkinson et al.,
2006) and the [compound] is the concentration of the
com-pound in molecules cm−3. Figure 3 presents the measured
versus the calculated reactivity. The two standards allowed
us to cover a range of OH reactivity from 3 to 50 s−1for the
propane standard, and a dynamic range comprised from 50
up to 300 s−1 for the acetone, methanol and isoprene
stan-dard. Corrections using the FACSIMILE model for devia-tions from the first order kinetics as described by Sinha et al. (2008) and for dilution of air in the reactor have already been applied.
The total uncertainty of the calculated reactivity is around 20 % and comprises: uncertainty due to the rate coefficient of the standards with the OH radicals (18 %), flow fluctuations (∼ 10 %) and uncertainty due to the accuracy of the standards (5 %). The measured reactivity is obtained with the CRM (vertical axis). The total uncertainty for the measured reac-tivity is around 18 % and comprises: uncertainty due to the rate coefficient of the pyrrole with the OH radicals (13 %), uncertainty of the standards (5 %), due to flow fluctuations (10 %) and the instrument precision (2σ , ∼ 6 %).
The calibration tests show a good linearity and account-ability of the measured reactivity. The estimated detection limit of the ambient OH reactivity measurements within the setup is around 3 s−1.
Page 43 of 56
1
2
Figure 2. Map of Paris and Ile de France region. The star locates the position of the LHVP 3
laboratory. The picture shows the terrace roof of LHVP. 4
5
PARIS
Forest
Forest
Fig. 2. Map of Paris and Ile de France region. The star locates the
position of the LHVP laboratory. The picture shows the terrace roof of LHVP.
2.2.2 OH reactivity quantifying tests
As already identified by Sinha et al. (2008), interferences are potentially present in the setup. Photolysis of pyrrole is one of the possible interferences. Indeed the reactor is a turbu-lent flow reactor in which a which a flow of pyrrole and ze-roair/ambient air mixes in with nitrogen at the mixing site right after the respective arms of the reactor (Fig. 1). While UV generation occurs within the arm, some rays from the Hg vapor lamp still enter the reactor, which is why a wood horn bulge was incorporated in the reactor design (see arm E of Fig. 2 in Sinha et al., 2008 and Fig. 1 of current work). The pen ray Hg lamp has emission lines at 184.9 nm (which photolyzes the water vapour), but also at 253.6 nm. Pyrrole has been reported to absorb around the 253 nm wavelength (Bavia et al., 1976; Cronin et al., 2004) and hence to pho-tolyze. The percentage of pyrrole photolysed in our setup is 19 ± 2 %, but this does not influence our measurement be-cause the Eq. (1) takes into consideration the real pyrrole concentration (after photolysis) available for reaction with the OH radicals (C1 base line). No significant effect has been reported in previous studies from a potential secondary chemistry occurring in the reactor (due for example from rad-icals generated through the photolysis), as investigated in de-tails by Sinha et al. (2008), Kim et al. (2011) and Noelscher et al. (2012).
Humidity difference between the zero air and the ambient air
Another potential interference is the humidity difference be-tween the zero air and the ambient air. Different humidity
conditions for the C2and C3signals correspond to different
yields of OH radicals in the reactor, and therefore can lead to over or under estimation of the total OH reactivity. To avoid this, the humidity of the zero air must be kept the same as the one of the ambient air. In the experimental setup used dur-ing the winter 2010 MEGAPOLI campaign, the zero air was humidified to a constant value of 50 %. As the atmospheric humidity varied over the day, corrections were applied on the C2base line signal so that the overall OH field stays constant.
Page 44 of 56
2
Figure 23. Calibration results using two standards bottles: propane and acetone, methanol and 3
isoprene standard. Error bars stand for estimated uncertainty on the measured and calculated OH 4
reactivity (see text). 5 6 y = 1.007x - 3.160 R² = 0.994 0 50 100 150 200 250 300 350 400 0 50 100 150 200 250 300 350 400 Meas u re d OH r e activity (s -1) Calculated OH reactivity (s-1) Standard 1: Propane
Standard 2: Acetone, Methanol, Isoprene
Fig. 3. Calibration results using two standards bottles: propane and
acetone, methanol and isoprene standard. Error bars stand for es-timated uncertainty on the measured and calculated OH reactivity (see text).
To do this, a “humidity test” was run. The zero air flowing into the reactor was humidified to different degrees by mix-ing varymix-ing amounts of wet and dry zero air, with the help of the “synthetic air” module presented in Fig. 1. The decrease in the pyrrole baseline (C2)is then recorded for different rel-ative humidities. During this test the mercury lamp is main-tained ON, as the purpose is the quantification of the real OH radical production into the setup. The humidity is tracked via the sensor installed on the exhaust line of the reactor and the results of this test are presented on Fig. 4.
A humidity correction has been applied based on this test
on the C2baseline signal. Note that while this correction may
seem significant (∼ up to 30 %), as the ambient air was more humid than zero air, it would only cause underestimation of the true OH reactivity thus leave conclusions of the paper regarding missing OH reactivity robust and intact.
The test revealed that for a relative humidity of between 60–70 %, the setup is much more sensitive to a change in the pyrrole signal than for humidity comprised between 80 and 90 % (the slope being smaller). Therefore, if there is no
possibility of regulating the humidity of the C2signal to the
one of the C3signal, as in the present work, it is advised to
keep the total relative humidity of the C2base line signal in
the ranges of 80 to 90 %. NO interference into the setup
As has been shown previously (Sinha et al., 2008), for high values of the NO into the setup, secondary production of OH
radicals is observed due to the recycling of the HO2radicals.
This interference is non-negligible for measurements made during the MEGAPOLI winter campaign, as the NO atmo-spheric levels went up to 100 ppb during the morning rush hour (see top panel from Fig. 7). To overcome this potential
Page 45 of 56
1
Figure 34. Change in the pyrrole signal (m/z 68) for different percentage of relative humidity 2
into the setup. The temperature of the setup is maintained constant at 24°C 3
4
Fig. 4. Change in the pyrrole signal (m/z 68) for different
percent-age of relative humidity into the setup. The temperature of the setup is maintained constant at 24◦C.
interference, firstly, the NO effect on the OH reactivity was quantified. Afterwards, a correction factor was applied to the ambient OH reactivity.
For the quantification of the NO interference, different amounts of NO were injected into the reactor and the de-crease of the pyrrole signal due to additional OH radicals,
recycled via the HO2+ NO → OH + NO2(kHO2+NO=8.8 ×
10−12cm3molecule−1s−1, Atkinson et al., 2004) reaction,
was analysed. The result of the test is presented in the Fig. 5, where the absolute change in the measured OH reactivity was plotted against the NO values in the setup.
The test was run for an initial OH reactivity of 50 s−1
(us-ing the propane standard described previously) and showed a change in the slope at NO value of 20 ppbv. A secondary NO test was made 2 weeks later with no propane injected into the reactor (OH reactivity null). This secondary test was not presented on Fig. 5, but again, the change in the slope was noted for NO of 20 ppbv into the setup. Two different slopes were therefore considered for correction of the ambient OH reactivity.
The vertical axis uncertainty was 20 % and corresponded to the total OH reactivity uncertainty as quantified for the calibration tests described in Sect. 2.2.1. The total horizontal uncertainty was 11 %, and took into consideration NO flow fluctuations (10 %) and the uncertainty of the NO standard (5 %).
For the MEGAPOLI winter campaign, the OH reactivity data set was corrected for the NO interference as follows: for NO values into the setup smaller than 20 ppbv (equiva-lent to ambient NO concentration of 33 ppbv, for a dilution factor into the reactor of 1.65), the measured OH reactivity was increased with a value equivalent of the product between
the 1st slope determined (1.13 s−1ppbv−1)and the measured
NO value into the setup. For NO values higher than 20ppbv, the measured OH reactivity was increased with the 0.46*NO
Page 46 of 56
1
Figure 45. NO test for OH reactivity of 50s-1: the red and the blue curves represent the 2 2
different slopes obtained for values of NO smaller or bigger than 20ppbv 3 4 y = 1.13x R² = 0.98 y = 0.46x + 12.51 R² = 0.98 0 10 20 30 40 50 60 0 10 20 30 40 50 60 70 80 A b sol u te ch ang e in th e to tal OH r ea ctivi ty ( s -1) NO (ppbv)
Fig. 5. NO test for OH reactivity of 50 s−1: the red and the blue curves represent the 2 different slopes obtained for values of NO smaller or bigger than 20 ppbv.
concentration + 12.51 s−1. 99 % of the OH reactivity dataset
corresponds to the first regime (NO < 20 ppbv) and only 1 % to the second regime (NO > 20 ppbv).
Frequency of the C0, C1and C2signal measurements
No C1 measurements were completed between 23 and 30
January, being replaced by C0 measurements. These
mea-surements correspond to meamea-surements made in the same
conditions as C1 with the UV lamp turned OFF. The
pho-tolytic loss of pyrrole described by the difference between C0and C1signals is an indicator of the stability of the emis-sion rays of the lamp, and therefore of the constant OH field production into the reactor. The photolytic loss for different C0s was quantified at the beginning and during the campaign as follows: from 8 to 23 January and after 31 January. The results indicated a constant photolytic loss of 19 ± 2 % over
the entire period. The missing C1levels were therefore
con-fidently quantified based on the correspondent C0levels.
The CRM method is based on the comparison between the
C2and C3 signals and therefore frequent measurements of
the C2 signal are required. During the MEGAPOLI winter
campaign, the C2baseline signal was determined 2 to 3 times
per day. Although not very frequently measured, the
variabil-ity of the C2showed a daily variation of maximum 15 % over
the entire campaign. An additional error of 15 % due to ex-trapolating successive baselines was therefore considered to the total uncertainty of the measured OH reactivity. A total uncertainty of 24 % was finally considered for the measured OH reactivity values during the MEGAPOLI campaign. This result comprises: uncertainty due to the rate coefficient of the pyrrole with the OH radicals (13 %), uncertainty of the stan-dard (5 %), due to flow fluctuations (6 %), the instrument pre-cision (2σ , ∼ 6 %) and the uncertainty due to low frequency
C2measurements (15 %).
2.3 Ancillary measurements at LHVP site during
MEGAPOLI winter campaign
Within the MEGAPOLI framework, additional
measure-ments of CO, NOx, non-methane hydrocarbons (NMHCs)
and oxygenated volatile organic compounds (OVOCs), as well as aerosol chemical composition were also performed. All sampling lines from VOC instruments were on the roof of LHVP, within a few meters of the OH reactivity sampling line.
Ozone was measured with an analyzer based on UV ab-sorption (41M, Environnement SA) and nitrogen oxides were measured by chemiluminescence with an AC31M analyzer (Environnement SA). CO was measured by an analyzer based on IR absorption (48i-TL instrument, Thermo Electron Corporation, Waltham, MA, USA). More details for these in-struments are given in Gros et al. (2011).
2.3.1 Non-methane hydrocarbon on-line measurements
by gas chromatography
Two portable gas chromatographs equipped with a flame ionization detector (GCFID, Chromatotec, Saint Antoine, France) were used to measure non-methane hydrocarbons (NMHC) in ambient air. The first analyser, ChromaTrap,
al-lowed the measurement of C2-C6hydrocarbons and the
sec-ond, AirmoBTX, the measurement of C6-C10hydrocarbons.
As the same instruments were used for atmospheric measure-ments during the spring 2007 Paris campaign, their technical information (type of columns, sampling flows, preconcentra-tion, desorption-heating temperatures and times, etc.) was al-ready described in details by Gros et al. (2011).
For both GC instruments, the sampling time was 10 min and analysis time was 20 min, and therefore measurements were performed with a time resolution of 30 min.
2.3.2 VOC measurements by PTR-MS
HS-PTRMS (High Sensitivity Proton Transfer Reaction Mass Spectrometer, Ionicon Analytic, Lindinger et al., 1998) was deployed during the intensive field campaign in or-der to quantify VOCs and oxygenated VOCs. The sampling line consisted of 10 m Teflon tubing. A primary flow of
10 l min−1was maintained in the sampling line. During the
campaign 39 m/z were monitored in the SIM mode with a temporal resolution of 2.5 min. These ions include m/z
=25, 32, 37, 39, 55, 80 used to control the PTRMS
per-formances (fragmentation, ionization) and the 33 remain-ing m/z correspond to individual VOC’s or sum of iso-mers. Within this study 5 VOC’s measured by PTRMS were considered: benzene (m/z = 79), toluene (m/z = 93), ace-tonitrile (m/z = 42), methanol (m/z = 33) and acetaldehyde (m/z = 45). Transmission of the PTR-MS quadrupole were adjusted by the mean of 18 individual VOCs with certi-fied concentration overlapping the mass range of the VOCs
monitored within the field campaign. The 5 selected VOCs were also individually calibrated in the range 0.2–8 ppb at 50 % RH.
2.3.3 Oxygenated compounds measurements by
GC-MS
For OVOC measurements, air sampling was performed at 15
ml min−1flow during 30 min by Air server-Unity I (Markes
International, Llantrisant, UK). After sampling, the com-pounds were then thermally desorbed and injected through a transfer line into a high polar column and analyzed by GC (Agilent, Massy, France) equipped with a FID and a Mass Spectrometer. This device allowed the identification and the
quantification of 19 OVOC and 11 NMHC from C2 to C9
with a time resolution of 1.5 h. Technical precisions are given by Roukos et al. (2009).
2.3.4 Fine aerosol measurements by AMS
A suite of instrumentation for the characterization of the physico-chemical properties of particles was deployed in the garden of the LHVP building (approx. 14 m below the sampling line of the OH-reactivity system). The instruments included a High Resolution Time-of-Flight Aerosol Mass Spectrometer (HR-ToF-AMS), here simply referred to as AMS, Aerodyne Research Inc., DeCarlo et al. (2006). A col-lection efficiency of 0.4 was calculated for the HR-ToF-AMS based on comparison with concurrent TDMPS and particle-into-liquid sampler (PILS) data (Healy et al., 2011). All in-struments were connected to the same sampling system
con-sisting of a PM10 inlet located approximately 6 m above
ground level directly followed by an automatic aerosol dif-fusion dryer system maintaining the relative humidity in the line below 30 % Tuch et al. (2009).
The AMS was operated at 5 min time resolution. Due to
the 600◦C surface temperature of the vaporizer, the AMS can
only measure the non-refractory (NR) part of the particles (ammonium, nitrate, chloride, sulphate, and organic matter). Therefore, based on the aerodynamic lenses transmission ef-ficiency and the detected compounds, AMS results are com-monly considered to correspond to the non-refractory PM1 aerosol (NR-PM1) Canagaratna et al. (2007).
2.4 Description of the FLEXPART model
The FLEXPART model represents a quantitative dispersion model which takes into consideration turbulence, convection parameterizations, dry and wet deposition to do backwards calculations from a measurement site (receptor) for the vol-ume mixing ratio of a generic inert tracer with infinite life-time. The generic inert tracer consists of 40 000 particles re-leased in a small box at the measurement location and dur-ing the measurement interval (3 h) and followed backward in time for 20 days. The model output unit is called PES, acronym from “potential emission sensitivity” distribution.
The unit of the PES is in s kg−1 and its value in a
particu-lar grid (geographical place) is proportional to the particle residence time in that cell. It is a measure for the simulated
mixing ratio at the receptor that a source of unit (1 kg s−1)
in the respective grid cell would produce. For more details on the way that the model works, the reader is sent to the FLEXPART descriptive paper of Stohl et al. (2005).
3 Results and discussion
In order to understand the OH reactivity results, a short de-scription of the air masses impacting the site and a brief dis-cussion on the pollution levels registered in Paris during the MEGAPOLI winter campaign are presented as follows.
3.1 Air mass origins during MEGAPOLI
OH reactivity measurements were made from 23 January un-til 13 February. During this time, a wide variety of air masses passed over Paris and its surroundings. In the Supplement of the article, all of these air masses are synthesized along with their origins (see Appendix A), as represented by the 20 days back trajectories calculated with the FLEXPART model.
We have chosen for discussion in this paper three con-trasting periods characterising different regimes in the OH reactivity measurements. The corresponding backward tra-jectories are given in Fig. 6. The first period (hereafter called “period I”) starts with 26 January, 03:00, and ends on 27 Jan-uary, 21:00 LT. This period corresponded to air masses orig-inating from the eastern part of Europe, passing firstly over the Benelux area and in the second part of this period over Germany.
The second period (hereafter called “period II”) started on 2 February, 09:00, and ended on 4 February, 03:00. In this period, clean air masses originating from the Atlantic Ocean arrived over Paris.
The third period (hereafter called “period III”) started with 9 February, 18:00, and lasted until the end of the campaign, 13 February, 16:00. The air masses originated again from the northern part of the continent, passing over Germany before joining Paris.
In conclusion, periods I and III were therefore character-ized as “continental air masses”, while period II was charac-terized as “oceanic air masses”.
3.2 Air quality in Paris during MEGAPOLI
3.2.1 Ambient levels of VOCs in Paris – comparison to
levels observed in other urban environments The median values of the main gas tracers recorded in Paris over the entire MEGAPOLI winter campaign were:
300 ± 98 ppbv for CO, 27 ± 11 ppbv for NO2and 13 ± 8 ppbv
for ozone (O3). NO presented a high variability during this
Page 47 of 56 1
Figure
56
. Backward trajectories characterizing the air masses of the three contrasted OH
2
reactivity periods (a) continental air masses on the 27th of January, (b) ocean air masses on the
3
3rd of February and (c) continental air masses on the 9th of February Source: FLEXPART
4
model
5 6
Fig. 6. Backward trajectories characterizing the air masses of the three contrasted OH reactivity periods (a) continental air masses on 27
January, (b) ocean air masses on the 3rd of February and (c) continental air masses on 9 February Source: FLEXPART model (see text).
Previously a campaign has been conducted in Paris dur-ing sprdur-ing 2007 (Gros et al., 2007) and a brief compari-son with the pollutant levels is given on the same site as the MEGAPOLI winter campaign 2010. The median values
corresponding to CO, NO, NO2 and O3 measured during
spring 2007 were 248 ± 80 ppbv for CO, 4.4 ± 1.6 ppbv for
NO, 11.2 ± 7.4 ppbv for NO2and 26 ± 13 ppbv for O3. It can
be seen that higher levels of CO, NO and NO2were
regis-tered during MEGAPOLI 2010 than for the 2007 campaign, and this is likely because of the higher anthropogenic emis-sions expected during the cold season. Because of a lower
photochemical activity during winter, the O3level measured
during MEGAPOLI 2010 campaign was lower than in spring 2007.
A brief comparison between the pollution levels reported from several cities where OH reactivity measurements are available is presented in Table 1. These cities were: Houston, New York, Mexico City, Tokyo and Paris. The background
and the maximum registered levels of CO, NOx, O3 and
the sum of non-methane hydrocarbons (NMHC) are sum-marized. The periods of the year when the measurements were done and the total population of the Metropolitan Areas were also presented. The most populated city was Tokyo with 36 million inhabitants, followed by New York and Mexico City, each of 22 million inhabitants. Paris and its surrounding area, called Ile de France, counted for 12 million inhabitants, representing one of the few megacities in Europe. Among
the studied cases, Tokyo (36◦N, 140◦E) presented
measure-ments in winter, in the same period when the measuremeasure-ments
of Paris were realized. As Tokyo is at about 35◦N one may
expect the winter effect of more emissions to be less pro-nounced.
The measured levels of the compounds presented in the Table 1 correspond to median daily values. The background values correspond to midnight median levels, while the max-imums represent the maximum registered of the median daily values. For more details on the measured data for Houston,
New York and Mexico City, the reader is sent to Shirley et al. (2006) and Mao et al. (2009) and references therein. For Tokyo measurements, see Yoshino et al. (2006).
In terms of carbon monoxide, the background levels mea-sured in Paris are generally lower than values meamea-sured in the other cities. In winter, Tokyo registered a maximum of CO 3 to 4 times higher than the Paris maximum, but 2 times lower than the maximum observed for Mexico-City. Never-theless, the maximum level of CO in Paris measured in the cold season remains comparable to maximums observed in New York City and Houston, though smaller and for differ-ent periods.
In terms of NOx, the Paris background is slightly higher
than the background levels measured in the other cities. Nev-ertheless, the maximum value remains comparable to the val-ues measured in New York City and Tokyo (in summer and in autumn), but still almost two times lower than the max-imum registered for the Mexico City in spring season and Tokyo in winter season. This is a comparison only on levels and does not consider inter annual variation of this pollutant concentration.
Generally, the Paris background level of NMHC sum was two times lower than in New York and Houston, 2000. The maximum is being 30 % to 50 % lower than those of New York and Houston, 2000 respectively. The high values in the sum of the NMHC measured for Houston in 2006 were mainly due to spikes at night correlated to emission events from plants in the Houston Ship Channel (Day et al., 2010). Greater discrepancies were nevertheless noted with respect to Mexico City when both the background and the maximum levels were 10 times higher than in Paris.
This quick comparative analysis allowed us to conclude that Paris presents intermediate levels of gaseous pollutants
(CO, NOx, NMHC), between medium size cities (Houston)
and megacities like Tokyo, New York and Mexico City. This is explained by its smaller population and its less industrial-ized character.
Table 1. Gaseous pollutants levels registered in different urban atmospheres.
Populationain Period of CO BGND CO max NO
xBGND NOx Ozone BGND Ozone NMHC NMHC
2010 (10ˆ6) the year level (ppbv) (ppbv) levels (ppbv) max (ppbv) level (ppbv) max (ppbv) BGND (ppbv) max (ppbv)
Houston 6 Aug–Sep 2000 200 250 5 22 25 70 100c 200c
New York City 22 Jun–Aug 2001 400 450 25 50 20 50 100c 150c
Mexico City 22 Apr 2003 100 3000 20 110 25 125 500c 1000c
Houston 6 Aug–Sep 2006 200 250 8 25 25 70 400c 750c Tokyo 36b Jan–Feb 2004 400d 1200d 25d 105d 10d 40d NA NA Tokyo 36b May 2004 300d 550d 13d 50d 50d 80d NA NA Tokyo 36b Nov 2004 400d 1000d 20d 65d 10d 60d NA NA Paris 12 Jan–Feb 2010 250 350 30 60 15 17 12 17 50c 100c
aCities and Metropolitan Areas;b2007;cvalues in ppbC (ppbCarbon);ddaily mean values were taken into consideration when median diurnal cycles were not available; BGND: corresponds to background levels measured at midnight, local time;
NA: Non Available Data.
Fig. 7. Campaign time series: top panel: NO in light-blue solid
line and the sum of xylenes in dark-blue solid line; 2nd panel: CO in light-green solid line and benzene in dark-green solid line; 3rd panel: acetone in light-orange solid line and acetaldehyde in dark-orange solid line. The three air mass periods are colored as follows: in yellow the Period I, in green, Period II, and in violet, Period III.
Examining now the speciated VOCs measured during the MEGAPOLI winter campaign, Table 2 gives their mean and range over the measurement period. Some compounds (ex. Benzene, Toluene) were measured by several instruments and measurements from the instrument with the better time resolution were selected. Their corresponding OH reactivity, calculated as the product between the concentration and the equivalent reaction rate constant (Kovacs and Brune, 2001; Kovacs et al., 2003; Sadanaga et al., 2005; Mao et al., 2009, 2010) is also given and will be discussed in Sect. 3.4.
Alkanes, alkenes-alkynes (and isoprene, though usually under the detection limits, because of the cold season), aro-matics and the oxygenated compounds accounted for 26, 19, 7 and 48 % respectively of the total volume mixing ratio of the measured VOCs. The oxygenated VOCs contribute a large part to the total concentration of the compounds mea-sured during the campaign. Among the oxygenated species, ethanol by itself accounted for more than half (56 %) to the
total OVOC concentration, followed by the sum of methanol and acetaldehyde 30 %, and acetone with 8 %.
VOC source apportionment analysis was conducted by Gaimoz et al. (2011) for the spring 2007 campaign, allow-ing the characterization of the local pollution in Paris. The term “local pollution” means pollution from Paris and “Ile de France”. The main source identified for VOC was traf-fic emission (fuel exhaust and evaporation) contributing to 50 %. Other contributing sources included natural gas emis-sions, background input and biogenic emissions.
3.2.2 VOC variability: influence of local sources versus
long-range transport
To characterize the air quality of Paris during the MEGAPOLI winter campaign, the variability of specific compounds showing different sources and atmospheric life-times were analyzed. The three panels of the Fig. 7 present selected compounds and a discussion on their variability, sources and their relation to the air mass origin is given af-terwards.
In the upper panel of Fig. 7, nitrogen oxide and the sum of
o, m and p xylenes are presented. The baseline levels of these
two anthropogenic and short life-time (a few hours) com-pounds do not seem to be significantly influenced by the dif-ferent origins of the air masses. Secondly, as previously pre-sented, the NO represents a typical marker of the traffic ex-haust emissions. The covariation of the xylenes with the NO suggests that the xylenes’ variability (but also that of other aromatic compounds, like toluene) in Paris was mainly con-trolled by the traffic source. This finding is in agreement with the conclusions from Gaimoz et al. (2011) (see Sect. 3.2.1).
The second panel presents two anthropogenic compounds with longer lifetimes: CO and benzene. CO represents a com-bustion tracer, having fossil fuel and biomass burning as pri-mary sources. Its atmospheric life-time is relatively long, ∼ 2 month (Crutzen, 1994). Benzene has a lifetime of about 6
days (for an OH concentration of 1.5 × 10⁶molecules cm−3,
Seinfeld and Pandis, 2006) and its emissions in Paris are, like other aromatic compounds, linked to traffic activities. Both
Table 2. Mean values of the main volatile-organic-compounds (VOC) volume mixing ratio measured during the campaign (TMB,
trimethyl-benzene; MVK, methyl vinyl ketone).
Compound Measurement Mean Min Max OH reactivity
technique (ppbv) (ppbv) (ppbv) (s−1) Ethane GC-FID 2.45 1.14 7.12 0.015 Ethene GC-FID 2.61 0.33 8.36 0.547 Propane GC-FID 2.12 0.76 5.04 0.057 Propene GC-FID 0.44 0.07 1.67 0.323 i-Butane GC-FID 0.91 0.15 2.84 0.052 n-Butane GC-FID 1.54 0.34 5.03 0.087 Acetylene GC-FID 1.77 0.62 5.04 0.044 1-Butene GC-FID 0.09 0.02 0.26 0.093 i-Butene GC-FID 0.19 0.02 0.55 0.306 c-2-Butene GC-FID 0.05 0.02 0.53 0.080 trans-2-Butene GC-FID 0.07 0.01 0.23 0.126 Isoprene GC-FID 0.17 0.05 1.43 0.423 n-Hexane GC-FID 0.14 0.01 1.34 0.019 n-Pentane GC-FID 0.40 0.07 1.39 0.040 Benzene PTR-MS 0.33 0.08 1.65 0.010 Toluene PTR-MS 0.54 0.09 2.36 0.079 Xylenes GC-FID 0.67 0.13 2.88 0.265 TMB GC-FID 0.29 0.08 0.76 0.289 Acetonitrile PTR-MS 0.55 0.09 3.69 0.000 i-Propanol GC-MS 0.24 0.04 1.06 0.031 Ethanol GC-MS 7.68 2.22 23.57 0.605 MVK GC-MS 0.09 0.02 0.44 0.042 Acetone GC-MS 1.05 0.58 2.97 0.005 2-Butanone GC-MS 0.29 0.06 0.94 0.009 Hexanal GC-MS 0.09 0.01 0.22 0.000 Benzaldehyde GC-MS 0.07 0.02 0.18 0.025 i-Butanol GC-MS 0.08 0.02 0.20 0.014 Methanol PTR-MS 2.35 0.89 6.18 0.052 Acetaldehyde PTR-MS 1.87 0.92 4.49 0.691
compounds show higher baseline levels during periods I and III. As the life-time of these two compounds exceeds the day, additional imported sources are considered to be responsible for the higher levels registered during the periods where pol-luted air masses were originating from the continent.
In the third panel, two oxygenated compounds with dif-ferent lifetimes are presented: acetone (lifetime less than a month taking into account its photolysis and its reaction with OH, Seinfeld and Pandis, 2006) and acetaldehyde (11
h for an OH concentration of 1.5 × 10⁶molecules cm−3,
Se-infeld and Pandis, 2006). These two compounds have pri-mary sources mainly of biogenic origin and an important secondary source: the oxidation of non-methane hydrocar-bons (NMHC). As shown in Fig. 7, both compounds show relatively lower baseline levels during the oceanic episode (period II) (except for the two maximums observed for the acetone) and higher baseline levels monitored during the continental air masses episodes (periods I and III). The fact that this increase is observed also for acetaldehyde, an oxy-genated compound with a relatively short life-time, suggests
that during the continental imported air masses, two type of sources are responsible of the high pollution levels: the di-rect pollution and the imported from over the continent and already processed air masses.
In summary, the examination of the variability of the com-pounds that have different lifetimes and sources shows that the measurement campaign was impacted during Period II only by local and regional (Paris and its surroundings, so-called “Ile de France”) emissions, whereas during the other periods (periods I and III), a significant contribution to the pollution levels in Paris was due to direct import of primary and secondary pollutants emissions that had undergone pho-tochemical aging and mixing during transport to Paris.
The diurnal variation of the main gaseous pollutants in Paris is presented in Appendix B. We have observed that the primary species – CO, NMHC and NO – show the same daily profile related to their common source, the traffic emissions. They show a minimum value during the night, a first peak in the early morning, a slight decrease in the afternoon and a second peak formed in the evening. This double peak profile
of the primary pollutants has also been remarked in Paris during spring 2007 (Gros et al., 2011) but also in other city boundaries (de Gouw et al., 2009; Velasco et al., 2007). The main primary emission source in Paris is considered to be the traffic activity which is confirmed by the results of a sim-ilar VOC source apportionment exercise performed for the MEGAPOLI campaign (Gros et al., 2012). This study will allow further investigation of the role from local emissions on reactivity.
3.3 OH reactivity in Paris
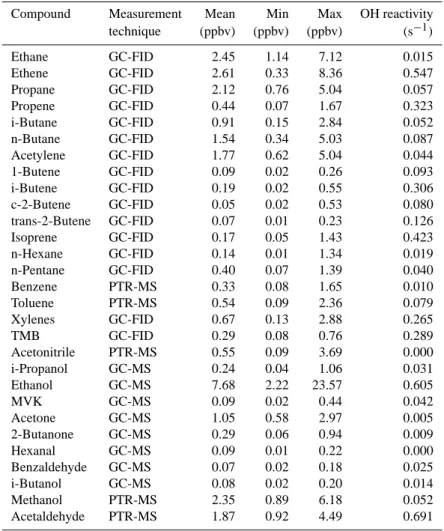
3.3.1 OH reactivity variability during the MEGAPOLI
campaign
The OH reactivity measurements were made from 23 January until 13 February. Figure 8 presents the OH reactivity levels measured: the 2 min and the 30 min averaged data series.
OH reactivity ranged from below the detection limit
(3.5 s−1) up to 130 s−1. The median value over the entire
campaign was of 33 s−1. Missing points in the data set
cor-respond to periods when instrument check and calibrations were run.
Generally we observed higher OH reactivity levels mea-sured during the night time compared to daytime levels. This variability of the OH reactivity is explained by the evolution of the height of the boundary layer, which is lower during the night, and therefore at this time the OH reactivity is less di-luted. This result is in good agreement with the higher level of the OH reactivity during nighttime than during daytime (except for the double peak due to traffic emissions) mea-sured in other megacities around the world: Nashville, USA (1999) (Kovacs et al., 2003), Houston, USA (2000 and 2006) (Mao et al., 2010), New York (2001) (Ren et al., 2003) and Mexico City (2003) (Shirley et al., 2006).
These same studies showed also that, under the influence of local pollution, the OH reactivity usually followed the di-urnal cycle of the pollutants emitted by traffic emissions: a first peak more or less accentuated, in the early morning (06:30), followed by a slight decrease in the late morning (10:30) and a second peak in the late after-noon and early evening. Nevertheless, we noticed that very few days during this campaign presented the typical diurnal (diel) cycle of a city impacted by traffic emissions. The main reason for this was that the diurnal variability was most of the time over-taken by the impact of long range transport as discussed be-low.
Regarding the entire MEGAPOLI winter campaign, three contrasting periods have been identified. The origins of the air masses corresponding to these OH reactivity periods have been previously described (see Sect. 3.1).
The “Period I” started with 26 January, mid-day, and ends on 27, at 21:00 h. The period is characterized by high OH
re-activity levels with a maximum value of 120 s−1reached on
27 January. The air masses originated from the eastern part
Fig. 8. OH reactivity time series (2 min blue dots; 30 min black
diamonds). Errors bars corresponding to the estimated uncertainty are given for three levels of OH reactivity, low (20 s−1), medium (60 s−1)and high (110 s−1).
of the continent and passed over Germany, before reaching Paris. They were therefore charged in pollutants (see discus-sion from Sect. 3.2.2), and can explain the high OH reactivity levels registered during “period I”.
“Period II” lasted from 2 to 4 February. During this period,
low levels of OH reactivity were registered (20 s−1). This
result is consistent with the marine origin of the air masses during this period (see Fig. 6).
“Period III” started with 8 February, 15:00, and lasted until the end of the campaign, 13 February. The OH reactivity
lev-els reached again very high values of 110 s−1. As for “period
I”, the air masses mainly originated from the north-eastern part of the continent and the Benelux area. Therefore an ad-ditional pollutant source due to the long range transport is considered to be responsible for the higher levels of the mea-sured OH reactivity
When considering the other time periods not-discussed here (time periods between period I, II and III), the air masses characterized intermediate regimes. The air masses origi-nated either from the central part of France, either from in-termediate regimes between the continental and oceanic (see Appendix A). These periods correspond to intermediate OH reactivity levels.
Table 3 synthetises the mean values of OH reactivity and the main gaseous pollutants for the three periods previously mentioned.
Generally all the compounds showed lower levels during the marine air mass period (II), than for the continental im-port periods (I and III), as already described in the previous section. The primary compounds exclusively emitted by lo-cal sources (considering their short life-time), here presented by the NO and the xylenes, show levels almost double dur-ing “period I” compared to “period III”, both continental air masses periods. These high concentrations denote higher local pollution during period I, and implicitly, higher “lo-cal” OH reactivity. The other primary compounds presented (CO, benzene and NMHC) showed also the same difference
Table 3. Mean values of the main pollution compounds measured during period I, II and III.
OH reactivity CO NO NO2 Benzene Xylenes Acetone NMHC OVOC Air
(s−1) (ppbv) (ppbv) (ppbv) (ppbv) (ppbv) (ppbv) (ppbv) (ppbv) masses
Period I 26/01–27/01 130 536 24 39 0.7 1.0 2.1 20.6 18.7 Continental
Period II 02/02–04/02 20 249 4 28 0.2 0.5 0.7 10.1 13.1 Ocean
Period III 09/02–13/02 110 311 7 27 0.3 0.6 1.0 13.2 12.4 Continental
between the two continental import periods, but because of their longer life-time, we can conclude that an additional im-ported source of primary compounds contributes to the total OH reactivity. Keeping in mind that the OH reactivity data are associated with an uncertainty of about 24 %, some dif-ferences can still be seen between these two different periods. Surprisingly, the sum of the oxygenated VOCs shows higher values during the oceanic air masses period. This re-sult is due to ethanol (which represents 50 % of the OVOCs) and which shows higher level during period II. Biogenic emissions are considered to be the main source of ethanol (Naik et al., 2010) and we note that Lewis et al. (2005) observed also higher OVOCs compared to other species in North Atlantic marine air too.
We conclude that the lowest OH reactivity levels corre-sponded to the marine period and were than only impacted by the local and regional pollution. The higher OH reactivity registered during periods I and III was mainly due to long distance transport.
3.3.2 OH reactivity levels registered over a local
pollution episode
The previous section suggested that the Paris OH reactivity larger variability is mainly driven by long range transport when comes to continental air masses. A discussion concern-ing the diel variation of the OH reactivity can therefore be done on periods influenced by oceanic air masses, and when only the local pollution is observed. The day of 4 Febru-ary (Thursday) was chosen because of its mainly oceanic air mass origins (pure oceanic air masses before 09:00, and oceanic and central France after 09:00; see Fig. A1 in the Supplement). We specifically use this day as it was the only one available with marine air mass origins and enough OH reactivity data. The other days had either larger blank period in the data set due to daily instrumental check, or either did not represent the typical diurnal cycle governed by the morn-ing and evenmorn-ing pollution peaks because they were weekend days. Still, 4 February presented a blank of 2 h in the data set, from 09:30 to 11:30, which was corresponding to the base line measurements.
Figure 9 presents in the top panel the variation of the OH reactivity with NO and in the bottom panel the OH reactivity plotted with acetone.
For this local pollution episode, NO showed a modified diurnal cycle. Indeed, instead of a double peak normally
ob-served during the day and corresponding to the traffic rush hours, on 4 February, NO showed only the morning peak which was doubled. A small peak was observed in the early morning (06:30), followed by a larger one in the late morn-ing, around 11:00. We note that 4 February was a Thursday, when the local public transportation had a strike, probably leading to enhanced use of private vehicle and unusual rush hour time. This conclusion is also sustained by the double peak observed for the same day on other compounds related to traffic emissions: CO and xylenes.
The first maximum in the NO level corresponding to the morning rush hour is clearly seen on the OH reactivity as well as the decrease observed around 08:00 and the begin-ning of the increase observed at 09:00. Unfortunately the second maximum is not captured by the OH reactivity mea-surement because of two hours gap in the data set. The good agreement between the OH reactivity and the NO denotes that Paris local OH reactivity is well impacted by traffic re-lated emissions. Nevertheless, in the second part of the day, an increase compared to the morning level (06:00) of the OH reactivity was observed, increase which was not showed by the NO variability. The second plot of Fig. 9 shows that ace-tone presents the same change in the concentration level, at the same time of the day. As acetaldehyde shows the same increase of the level measured as acetone, we concluded that for this episode, the in-situ photochemical formation of oxy-genated compounds may be responsible of the increase of the OH reactivity in the afternoon.
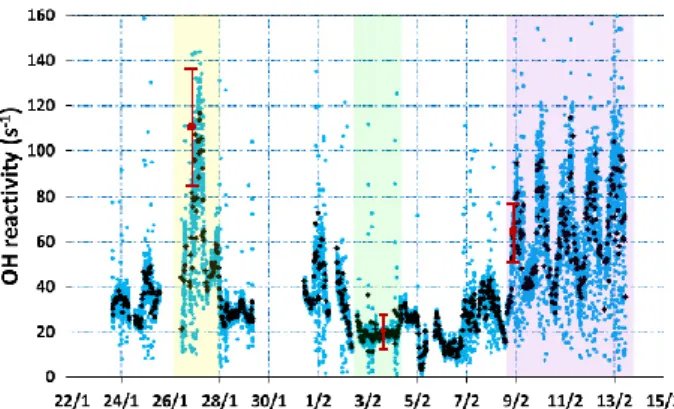
3.4 Missing OH reactivity in Paris
The calculated OH reactivity represents the sum of the prod-uct of OH reactants and their reaction rate coefficient. As previously shown (Kovacs et al., 2003; Di Carlo et al., 2004), comparison between the measured and the calculated OH re-activity denotes the so-called “missing OH rere-activity” and tests the assumption that all significant OH reactants have been measured and can be used to infer missing OH reac-tants.
Figure 10 presents the total measured OH reactivity plot-ted with the calculaplot-ted OH reactivity due to the simultane-ously measured OH sink compounds. The VOC species con-sidered for these calculations are presented in Table 2. In
ad-dition, results of CO, NO and NO2were also taken in
consid-eration. Because of the winter season, no biogenic emissions were identified (isoprene signal under the detection limit
Page 50 of 56
1
2
Figure 89. Daily variability of the OH reactivity during a local pollution episode: top panel: OH 3
reactivity time series (2min blue dots and 10min black diamonds) and NO time series (5min 4
green triangles). Bottom panel: OH reactivity time series (2 min blue dots and 10 min black 5
diamonds); acetone time series (30 min red squares). 6 7 -30 -10 10 30 50 70 90 110 10 20 30 40 50 0:00 3:00 6:00 9:00 12:00 15:00 18:00 21:00 0:00 NO (pp b v) OH reactivity (s -1) 0.0 0.5 1.0 1.5 2.0 2.5 3.0 3.5 4.0 10 20 30 40 50 0:00 3:00 6:00 9:00 12:00 15:00 18:00 21:00 0:00 Ace tone (pp b v) OH reactivity (s -1)
Fig. 9. Daily variability of the OH reactivity during a local pollution
episode: top panel: OH reactivity time series (2min blue dots and 10 min black diamonds) and NO time series (5min green triangles). Bottom panel: OH reactivity time series (2 min blue dots and 10 min black diamonds); acetone time series (30 min red squares).
most of the time), and therefore no biogenic compounds were considered. No formaldehyde measurements were made at the LHVP site during the MEGAPOLI winter cam-paign. Nevertheless, calculations considering high values of formaldehyde were conducted but the equivalent OH
reac-tivity was not significant (only 2 s−1for 10pbbv of
formalde-hyde, kCH2O+OH=8.5 × 10
−12cm3molecule−1s−1,
Atkin-son et al., 2006). No formaldehyde reactivity was therefore
considered. The CH4 concentration of 1950 ppbv was
as-sumed. Due to the temporal resolution of the instruments, calculated reactivity was performed every 1 h and 30 min.
When comparing the measured and the calculated OH re-activity, the calculated level is systematically smaller than the measured one, with the exception of 5 and 8 February, when instrumental interferences were noted. These interfer-ences were mainly due to perturbations of the system when some sporadic “bursts” of pyrrole (a sticky compound) were observed. The median (mean) value of the calculated OH re-activity over the entire campaign is 16 s−1(17.5 s−1), while
the measured OH reactivity is double, 33 s−1(40 s−1).
The breakdown of the total OH reactivity measured during the entire campaign is presented in Fig. 11. The mean values were taken in consideration for the calculations. The missing OH reactivity, given by the difference between the measured and the calculated reactivity, is quite high: 54 %, showing that when averaged over the entire campaign, more than half of the measured OH reactivity is not explained. Pie chart b) presents the contribution of the different compounds to the calculated OH reactivity. The main compounds explaining
the calculated part of the OH reactivity are NO2(55 %),
fol-lowed by the sum of NMHCs (15 %), NO and CO (account-ing each for 10 %) and finally the sum of OVOCs (8 %).
Examining now the missing reactivity according to the air mass origins, we note significant difference if the air mass
Page 51 of 56
2 3
Figure 910. Calculated (90 min time resolution red curve) versus the measured OH reactivity (2 4
min time resolution blue dots, 30 min average, black diamonds) 5 6 7 8 0 20 40 60 80 100 120 140 160 22/1 24/1 26/1 28/1 30/1 1/2 3/2 5/2 7/2 9/2 11/2 13/2 15/2 OH r e ac ti vi ty ( s -1)
Fig. 10. Calculated (90 min time resolution red curve) versus the
measured OH reactivity (2 min time resolution blue dots, 30 min average, black diamonds).
Page 52 of 56
1
Figure 1011. Breakdown of the a) total OH reactivity and b) calculated OH reactivity for the 2
entire MEGAPOLI winter campaign. Average total OH reactivity values were respectively 40.3 3 s-1 (a) and 17.5 s-1 (b) 4 5 b a NMHC 15% OVOC 8% CO 10% NO 10% NO2 55% CH4 2% NMHC 7% OVOC4% CO 5% NO 4% NO2 24% CH4 1% Missing OH reactivity 54%
Mis en forme : Exposant Mis en forme : Exposant
Fig. 11. Breakdown of the (a) total OH reactivity and (b) calculated
OH reactivity for the entire MEGAPOLI winter campaign. Average total OH reactivity values were respectively 40.3 s−1(a) and 17.5
s−1(b).
was of oceanic or of continental origin. Figure 12 presents the enclosed piecharts of the breakdown total OH reactiv-ity for periods II and III. During the period associated with oceanic air masses and therefore characteristic of the local pollution in Paris, the measured and the calculated OH re-activity agreed within 12 % (see piechart a), which is within the uncertainty range (± 24 %) of the measured and calcu-lated reactivity. This good agreement points out that during period II, all the main OH reactive species were measured.
As Paris is impacted by traffic emissions, high levels of NOx
are emitted into the atmosphere. NO2and NO explain about
60 % of the total measured OH reactivity. This large contri-bution is expected as in urban atmosphere, the main sink of
OH being the formation of the nitric acid (HNO3)(Delmas et
al., 2005). The OH reactivity due to the NMHC accounts for
∼14 %, while the OVOC and the CO contribute with 7 and
respectively 8 % to the total OH reactivity. When consider-ing only the measured VOCs presented in Table 2, among the NMHC, the species that contributed the most to the OH reactivity were ethene with 13 % and propene with 7.5 %. Among the oxygenated VOCs, the acetaldehyde and ethanol
Page 53 of 56
1
Figure 1112. The Breakdown of the total OH reactivity for a) period II and b) period III. Average 2
total OH reactivity values were respectively 18.8 s-1 (a) and 63.3 s-1 (b)
3 4 5 b a NMHC 14% OVOC 7% CO 8% NO 4% NO2 55% Missing OH reactivity 12% NMHC 4% OVOC 2% CO3% NO 2% NO2 15% Missing OH reactivity 74%
Fig. 12. The Breakdown of the total OH reactivity for (a) period II
and (b) period III. Average total OH reactivity values were respec-tively 18.8 s−1(a) and 63.3 s−1(b).
contributed with 16 % and respectively 14 % to the OH reac-tivity.
We note a very good agreement between the contribu-tion of the different compounds to the total OH reactivity on the entire campaign (see piechart of Fig. 11) and during the local pollution period from Fig. 12a). This clearly points out that when not under continental pollution plumes, the species which were measured during the MEGAPOLI
cam-paign (CO, NOxand list of VOCs from Table 2) characterize
correctly the Paris OH reactivity levels.
Figure 12b indicates that during continental import, the measured OH reactivity was much higher than the calculated value. The missing OH reactivity was now of 75 %. This is a huge value compared to missing OH reactivities registered in other urban areas (for more details, see Sect. 3.5.3).
Cal-culations indicate that the reactions of OH with NO2are the
greatest contributors to the total OH reactivity, and followed by NMHC, CO, OVOCs and NO.
For a better understanding of the variability of the not-measured OH reactivity nature, Fig. 13 presents on the top panel the missing OH reactivity series.
As already predicted, the highest values were registered during the continental air mass imports, while the lowest level was registered under the marine air mass influence. We can conclude that during the local pollution period all of the main OH reactive species were measured and there-fore the OH reactivity budget can be closed simply by using the already measured compounds. On the contrary, during continental import periods, the non-measured OH reactive species are considered to be at the origin of the high level of the missing OH reactivity. Therefore these non-measured species could be: (a) either primary OH reactive compounds, or (b) secondary species, characteristic of reprocessed air masses. The first suggestion is less probable, if we consider that the most important classes of OH reactive species, al-ready measured in other studies, were also measured dur-ing the MEGAPOLI winter campaign. Furthermore, the good agreement between the measured and calculated OH reactiv-ity found for “period II” reinforces this conclusion.
Page 55 of 56 1
2
Figure 1213. Top panel: Benzene/Toluen ratio and Missing OH reactivity; Bottom panel: sum of 3
SO4, NO3 and NH4 4 5 0 10 20 30 40 50 60 70 80 90 100 0 0.2 0.4 0.6 0.8 1 1.2 1.4 1.6 1.8 2 22/01 24/01 26/01 28/01 30/01 01/02 03/02 05/02 07/02 09/02 11/02 13/02 15/02 Missing OH rea ctivi ty ( s -1) b enz ene/ to luen e 0 5 10 15 20 25 30 35 40 45 22/01/2010 00:00 27/01/2010 00:00 01/02/2010 00:00 06/02/2010 00:00 11/02/2010 00:00 Sum of SO 4 , NO 3 an d N H4 (µ g/m 3)
Fig. 13. Top panel: Benzene/Toluene ratio and Missing OH
reactiv-ity; bottom panel: sum of SO4, NO3toluene and NH4.
Figure 13a shows as well the evolution of the ben-zene/toluene ratio. This ratio has been largely used in the lit-erature (following the initial idea of Roberts et al., 1984) to estimate the age of an air mass as these two aromatics com-pounds are usually issued from the same source whereas their reaction rate with OH differ by a factor 5. Therefore a low benzene/toluene ratio will suggest a fresh pollution whereas a higher value will suggest an older pollution. Figure 13 shows that the highest values of the benzene/toluene ratio were ob-served during period I and III confirming the sampling of air masses impacted by aged pollution at that time. We note that one very high value of the ratio was also observed on 24 Jan-uary but this was due to a high peak of benzene which may have been caused by a local specific source.
The temporal variability of submicron secondary inor-ganic salts (ammonium nitrate and ammonium sulphate) measured by AMS is reported in Fig. 13 (second panel). At many locations ammonium nitrate has shown to be cor-related with freshly (less-) photochemically aged organic aerosols (OA) whereas ammonium sulphate was more re-lated to regional heavily aged OA (Lanz et al., 2007; Jimenez et al., 2009; Ulbrich et al., 2009). The sum of these two secondary ion components may be then used to infer the role of photochemical processes involved in the formation
![Figure 1. OH reactivity system during MEGAPOLI winter 2010 2 3 PTR-MS Temperature and relative humidity sensor 1/4’ and 1/16’ restrictor Exhaust Pyrrole [C4H5N] Syn air ASyn air B MFC AMFC BKNF teflon pumpMFC MFC UV lampN2 “Nitrogen” module](https://thumb-eu.123doks.com/thumbv2/123doknet/12279432.322324/4.892.466.821.93.301/reactivity-megapoli-temperature-relative-humidity-restrictor-exhaust-nitrogen.webp)