2012 — Differential geometry methods for biomedical image processing : from segmentation to 2D/3D registration
209
0
0
Texte intégral
(2) This Creative Commons license allows readers to download this work and share it with others as long as the author is credited. The content of this work cannot be modified in any way or used commercially..
(3) BOARD OF EXAMINERS THIS THESIS HAS BEEN EVALUATED BY THE FOLLOWING BOARD OF EXAMINERS:. Mr. Mohamed Cheriet, Thesis director Département de la génie de la production automatisée, École de technologie supérieure Mr. Sylvain Deschênes, Thesis co-director Département d’imagerie médicale, CHU Ste-Justine Mrs. Rita Noumeir, Committee president Département de génie électrique, École de technologie supérieure Mr. Tien Dai Bui, External examiner Department of Computer Science and Software Engineering, Concordia University Mr. Jean-Marc Lina, Examiner Département de génie électrique, École de technologie supérieure. THIS DISSERTATION WAS PRESENTED AND DEFENDED IN THE PRESENCE OF A BOARD OF EXAMINERS AND PUBLIC ON THE 14TH OF JUNE 2012 AT ÉCOLE DE TECHNOLOGIE SUPÉRIEURE.
(4)
(5) FOREWORD. Now virtue is concerned with passions and actions, in which excess is a form of failure, and so is defect, while the intermediate is praised and is a form of success; and being praised and being successful are both characteristics of virtue. Therefore virtue is a kind of mean, since, as we have seen, it aims at what is intermediate. Aristotle, Nicomachean Ethics, Book II. Engineering is the art of creating valuable processes. It is not merely the direct application of mathematical formulas, nor is it a synthesis of observations and measurement. Rather the method is analogous to construction, where the experimental data are the bricks and the mathematical techniques the mortar. As far as engineering is concerned, the method is without merit if it doesn’t have practical value, and the data are just a collection of artifacts until they are analyzed and their nature understood. The method is not to be evaluated based on a restricted set of criteria, but as whole. From the balance between the conceptual and the factual emerges the value of the method. The engineering research presented in this thesis focuses on image processing, and is the result of pursuing such balance. Now, the techniques we apply in engineering must have context to be of any use. Hence, neither the proposed segmentation algorithms nor the registration method we describe can be considered to constitute definitive solutions to the image processing problem in its most fundamental meaning. Hopefully, by formalizing these techniques within their respective context, and by seeking to balance the conceptual and the factual, an important subset of problems can be solved..
(6)
(7) AVANT-PROPOS. Or, la vertu a rapport à des affections et à des actions dans lesquelles l’excès est erreur et le défaut objet de blâme, tandis que le moyen est objet de louange et de réussite, double avantage propre à la vertu. La vertu est donc une sorte de juste milieu en ce sens qu’elle vise le moyen. Aristote, Éthique à Nicomaque, Livre II. L’ingénierie est l’art de créer des processus utiles. Il ne n’agit donc pas de la simple application de formules mathématiques, ni d’une synthèse de mesures et d’observations. Plutôt, la méthode s’apparente à une construction où les données expérimentales sont les briques et les techniques mathématiques composent le mortier. En ingénierie, la méthode n’est rien si elle ne mène pas à une application pratique ; les données ne sont qu’une collection de faits si elles ne sont pas analysées et comprises. Ainsi, la méthode ne sera-t-elle pas jugée qu’en fonction d’un seul critère précis, fut-il théorique ou pratique, mais en fonction de ses performances générales. De l’équilibre entre le conceptuel et le factuel se dégage la valeur de la méthode. Les travaux de recherche présentés dans cette thèse s’intéressent au traitement des images et sont le fruit d’une telle poursuite de l’équilibre. Bien sûr, la technique se doit également d’être encrée dans son contexte. Ainsi, ni les méthodes de segmentation proposées, ni la méthode de recalage décrite ne prétendent résoudre le problème du traitement des images en son sens le plus fondamental. Néanmoins, ces méthodes ont été formalisées consciencieusement, en dosant le mieux possible l’apport théorique et l’apport pratique, de façon à résoudre un sous-ensemble intéressant de problèmes..
(8)
(9) À Nadine, pour son soutien inconditionnel.
(10)
(11) ACKNOWLEDGEMENTS. I wish to express my deepest gratitude to Mohamed Cheriet, my thesis advisor, for his guidance, support and insight. Above all, Mohamed instilled in me his passion for research, an undertaking that cannot be reduced to the simple application of complex formulas. He has taught me that research requires imagination, personal commitment, and hard work. I will always be indebted to him. I am grateful to Sylvain Deschênes, my thesis co-advisor, for sharing with me his expertise and introducing me to to the realities of clinical practice at CHU Ste-Justine Hospital. I thank the board of examiners, Jean-Marc Lina, Rita Noumeir, and Tien Dai Bui, for their time and your precious comment. I am grateful to my collaborators on many of the articles presented in this thesis: Hari Sundar, Reza Farrahi Moghaddam, Luc Duong, Julien Couet, Chantale Lapierre, and Sylvain Deschênes. This work could not have been done without them. I must also thank my past and present colleagues at Synchromedia: Reza, Samir, Vincent, Sebastián, Solen, Mathias, Adolph (Guoqiang), Fereydoun, Rachid, Shaohua, Youssouf, Abdelhamid, Ali, Ehsan, Tara, Lukáš, Martha, Moshiur, Jonathan, Ridha, and Martin. I will always remember our many stimulating discussions. Luc Duong provided his encouragement and timely advice on many occasions. Many thanks, too, to the member of the LinCS lab: Jonathan, Julien, Faten, Jean-Philippe, and Mathieu, not to mention my colleagues in the Livia lab, my first lab at the ÉTS: Carlos, Clément, Dominique, Eduardo, Eulanda, Éric, Jean-François, Luana, Paulo, and Marcelo. I am deeply grateful to Farida Cheriet, director of the Liv4D lab at the École Polytechnique de Montréal, for her guidance in the biomedical world, and thank all the members of her lab, including Herve, Philippe, Pascale, Fouzi, Rafik, Rola, Olivier, Martin, Lama, Jonathan, Jérémie, Pascal, Samuel, Claudia, Fantin, Séverine, among others, for their time and lively discussions. Special thanks to all the members of the research team at CHU Ste-Justine. The involvement of Nagib Dahdah, Chantale Lapierre, and Josée Dubois was essential to the accomplishment of this research. I am indebted to Hari Sundar, who was my supervisor at Siemens Corporate Research, from whom I learned so much, to the managers at Siemens, Christophe Chefd’Hotel, Rui Liao, and Frank Sauer, who made this experience possible, to my colleagues Pascal Dufour, Sofiene Jenzri, and the Siemens Demons team, and many too numerous to name..
(12) XII. I thank all team members at C-Tec. I am particularly grateful to Ludovic, Jean-Christophe, Nicolas, Yan, Christian, Philippe, Israel and John whose ideas certainly influenced my research. I also wish to thank my family and friends: Je tiens également à remercier les membres de ma famille et mes amis. En tout premier lieu, je veux souligner l’importance des valeurs que m’ont transmises mes parents. Cette thèse n’aurait jamais vu le jour sans la présence de Claudel, ma mère, qui m’a transmis patience, constance et tempérance, ces marques de caractère si essentielles en recherche, ou celle de André, mon père, qui m’a amené à croire que je pouvais changer le monde, même modestement, et qui m’a appris à remettre en question l’ordre établi. À mon frère et à mes soeurs, Léa, Maude, Louis, Christine, Noémie, Emmanuelle et Camille, je vous dis merci pour tous ces moments de joie, mais aussi pour tous vos projets et idées les plus décalés. À ma famille élargie, merci d’avoir su attiser ma curiosité. Cette thèse est dédicacée à ma femme, Nadine, pour son soutien inconditionnel et indéfectible. Sans toi, je n’aurais pas pu aller au bout de cette odyssée. J’exprime avec plaisir ma reconnaissance envers les membres de ma belle-famille, Lise, Paul et Julie, pour leur accueil complet et leur générosité sans faille. Assurément, à vos côtés je suis devenu une meilleure personne. L’apport de mes amis est également trop important pour je puisse le passer sous silence. Tout d’abord mes amis d’enfance, Jonathan, Benoit, Fred, Patrick2 , aussi Jean-François le disparu, Anne-Christine, Amélie, Geneviève, Isabelle, Richard, Gilles, Stéphane, Pascal, Linda, Maryanick, Félix, Valérie, Karl, Jérome. Avec vous, au quotidien et durant nos aventures, j’ai pu me définir. Tout aussi important est la contribution de mes amis que la vie m’a amené à connaître un peu plus tard : Fred, Jean-Charles, Patrick, Fernand, Karine, Nancy, Alex, Delphine, Marc, Hélène. Au travers ces soirées, travaux et sorties, vous avez ouvert mes horizons. J’adresse aussi de sincères remerciements à mon cousin Vivek pour ses commentaires précis et attentionnés lors de la relecture de certains de mes textes. Finally, I acknowledge the financial support of the Natural Sciences and Engineering Research Council of Canada (NSERC-CRSNG), le Fond de recherche du Québec - Nature et technologie (FQRNT), and the ÉTS scholarship program, which made this research possible..
(13) DIFFERENTIAL GEOMETRY METHODS FOR BIOMEDICAL IMAGE PROCESSING: FROM SEGMENTATION TO 2D/3D REGISTRATION David RIVEST-HÉNAULT ABSTRACT This thesis establishes a biomedical image analysis framework for the advanced visualization of biological structures. It consists of two important parts: 1) the segmentation of some structures of interest in 3D medical scans, and 2) the registration of patient-specific 3D models with 2D interventional images. Segmenting biological structures results in 3D computational models that are simple to visualize and that can be analyzed quantitatively. Registering a 3D model with interventional images permits to position the 3D model within the physical world. By combining the information from a 3D model and 2D interventional images, the proposed framework can improve the guidance of surgical intervention by reducing the ambiguities inherent to the interpretation of 2D images. Two specific segmentation problems are considered: 1) the segmentation of large structures with low frequency intensity nonuniformity, and 2) the detection of fine curvilinear structures. First, we directed our attention toward the segmentation of relatively large structures with low frequency intensity nonuniformity. Such structures are important in medical imaging since they are commonly encountered in MRI. Also, the nonuniform diffusion of the contrast agent in some other modalities, such as CTA, leads to structures of nonuniform appearance. A level-set method that uses a local-linear region model is defined, and applied to the challenging problem of segmenting brain tissues in MRI. The unique characteristics of the proposed method permit to account for important image nonuniformity implicitly. To the best of our knowledge, this is the first time a region-based level-set model has been used to perform the segmentation of real world MRI brain scans with convincing results. The second segmentation problem considered is the detection of fine curvilinear structures in 3D medical images. Detecting those structures is crucial since they can represent veins, arteries, bronchi or other important tissues. Unfortunately, most currently available curvilinear structure detection filters incur significant signal lost at bifurcations of two structures. This peculiarity limits the performance of all subsequent processes, whether it be understanding an angiography acquisition, computing an accurate tractography, or automatically classifying the image voxels. This thesis presents a new curvilinear structure detection filter that is robust to the presence of X- and Y-junctions. At the same time, it is conceptually simple and deterministic, and allows for an intuitive representation of the structure’s principal directions. Once a 3D computational model is available, it can be used to enhance surgical guidance. A 2D/3D non-rigid method is proposed that brings a 3D centerline model of the coronary arteries into correspondence with bi-plane fluoroscopic angiograms. The registered model is overlaid on top of the interventional angiograms to provide surgical assistance during image-guided chronic total occlusion procedures, which reduces the uncertainty inherent in 2D interven-.
(14) XIV. tional images. A fully non-rigid registration model is proposed and used to compensate for any local shape discrepancy. This method is based on a variational framework, and uses a simultaneous matching and reconstruction process. With a typical run time of less than 3 seconds, the algorithms are fast enough for interactive applications.. Keywords: Segmentation, 2D/3D registration, registration, level-set, local-linear region model, variational framework, vessel detection, curvilinear structures, brain tissues, cardiology, coronary arteries, MAPCA, CT, CTA, MRI, MRA, fluoroscopy, angiography.
(15) MÉTHODES DE GÉOMÉTRIE DIFFÉRENTIELLE POUR LE TRAITEMENT DES IMAGES BIOMÉDICALES : DE LA SEGMENTATION AU RECALAGE 2D/3D David RIVEST-HÉNAULT RÉSUMÉ Cette thèse introduit une plate-forme d’imagerie biomédicale pour la visualisation avancée de structures biologiques. Elle est constituée de deux principaux types d’opérations : 1) la segmentation de quelques structures d’intérêt dans des images 3D ; et 2) le recalage d’un modèle 3D de structures biologiques propres à un patient avec l’imagerie interventionnelle 2D. Le fait de segmenter une structure biologique en 3D résulte en un modèle discret qui soit simple à visualiser et à comprendre. Ce dernier peut également être analysé et mesuré de façon informatisée. En contrepartie, recaler un modèle 3D avec les images interventionnelles permet de situer celui-ci dans le monde physique et donc de le positionner par rapport aux autres objets de la salle d’opération. En combinant l’information d’un modèle 3D et celle des images interventionnelles 2D, la plate-forme proposée vise à améliorer le guidage chirurgical en réduisant les ambiguïtés inhérentes à l’interprétation des images 2D. En ce qui a trait à la segmentation, deux problèmes spécifiques sont considérés : 1) les structures présentant des variations d’intensité de basse fréquence ; et 2) la détection de structures curvilinéaires fines. Premièrement, nous nous sommes concentrés sur la segmentation de structures larges présentant des variations d’intensité de basse fréquence. De telles structures sont importantes dans le contexte de l’imagerie médicale puisqu’elles se retrouvent fréquemment, notamment en imagerie par résonance magnétique (IRM). De même, en angiographie, il est possible qu’une diffusion non-uniforme de l’agent de contraste résulte en des structures présentant de telle variation d’intensité. Nous avons donc défini une méthode par surfaces de niveaux utilisant une modélisation localement linéaire des intensités de régions et appliqué cette méthode au problème de la segmentation de ces structures. Il est démontré que les caractéristiques propres à cette méthode permettent de prendre en compte de façon implicite la non-uniformité de l’intensité des structures dans les IRM. Ainsi, au meilleur de notre connaissance, cette méthode est la première utilisant les surfaces de niveaux à atteindre des résultats convaincants pour la segmentation des tissus cérébraux dans les IRM. Le deuxième problème de segmentation considéré consiste en la détection et la segmentation des structures curvilinéaires fines dans les images tridimensionnelles. En imagerie médicale, la détection de ces structures est cruciale puisque ces dernières peuvent représenter des veines, des artères, des bronches ou d’autres classes importantes de tissus. Malencontreusement, la plupart des méthodes présentement disponibles produisent un signal fortement atténué à la rencontre de deux structures formant un carrefour. Cette singularité peut donc réduire la performance d’un traitement subséquent tel que : l’étude automatisée d’une image d’angiographie, le calcul de la trajectoire des vaisseaux, ou l’étiquetage automatique des pixels composant l’image. La présente thèse introduit un nouveau filtre de vaisseaux qui est robuste à la présence de carrefours en X ou en Y apparaissant le long des structures. En même temps, il reste conceptuellement.
(16) XVI. simple, déterministe et il permet une représentation intuitive des directions principales de la structure de l’image. Une fois qu’un modèle 3D discret a été créé, celui-ci peut être utilisé afin d’améliorer le guidage chirurgical. Aussi, une méthode de recalage non-rigide 2D/3D est proposée pour amener un modèle des artères coronaires en correspondance avec des images de fluoroscopie biplan. Le modèle ainsi recalé est superposé sur les images interventionnelles afin de favoriser un meilleur guidage chirurgical durant les interventions percutanées pour les opérations d’occlusions totales chroniques. De ce fait, l’incertitude inhérente aux images bidimensionnelles s’en trouve amoindri. Une méthode de recalage complètement non-rigide est définie et permet de réduire de façon localisée toute différence de forme. Cette nouvelle méthode, fondée sur le calcul variationnel, met en scène un processus d’appariement et de reconstruction simultanés afin de calculer la transformation. Grâce à un temps de calcul généralement sous les trois secondes, l’algorithme reste assez rapide pour être utilisé de façon interactive.. Mots-clés: Segmentation, recalage 2D/3D, recalage, level-set, modèle de région localement linéaire, méthode variationnelle, détection de vaisseaux sanguin, structures curvilinéaire, tissus cérébraux, cardiologie, artères coronaires, artères collatérales aorto-pulmonaires majeures (MAPCA), CT-scan, CTA, IRM, ARM, fluoroscopie.
(17) CONTENTS Page INTRODUCTION . . . . . . . . . . . . . . . . . . . . . . . . . . . . . . . . . . . . . . . . . . . . . . . . . . . . . . . . . . . . . . . . . . . . . . . . . . . . . . 1 0.1 Clinical context . . . . . . . . . . . . . . . . . . . . . . . . . . . . . . . . . . . . . . . . . . . . . . . . . . . . . . . . . . . . . . . . . . . . . . . 6 0.2 Problem statement . . . . . . . . . . . . . . . . . . . . . . . . . . . . . . . . . . . . . . . . . . . . . . . . . . . . . . . . . . . . . . . . . . . . 13 0.3 Outline of the thesis . . . . . . . . . . . . . . . . . . . . . . . . . . . . . . . . . . . . . . . . . . . . . . . . . . . . . . . . . . . . . . . . . . 19 CHAPTER 1 LITERATURE REVIEW . . . . . . . . . . . . . . . . . . . . . . . . . . . . . . . . . . . . . . . . . . . . . . . . . . . 1.1 Medical imaging segmentation. . . . . . . . . . . . . . . . . . . . . . . . . . . . . . . . . . . . . . . . . . . . . . . . . . . . . . . 1.1.1 The level-set method . . . . . . . . . . . . . . . . . . . . . . . . . . . . . . . . . . . . . . . . . . . . . . . . . . . . . . . . 1.1.2 Level-set segmentation of vascular structures . . . . . . . . . . . . . . . . . . . . . . . . . . . . . 1.1.3 Brain tissue segmentation. . . . . . . . . . . . . . . . . . . . . . . . . . . . . . . . . . . . . . . . . . . . . . . . . . . 1.2 Vessel detection filters . . . . . . . . . . . . . . . . . . . . . . . . . . . . . . . . . . . . . . . . . . . . . . . . . . . . . . . . . . . . . . . . 1.2.1 Analysis of the Hessian . . . . . . . . . . . . . . . . . . . . . . . . . . . . . . . . . . . . . . . . . . . . . . . . . . . . . 1.2.2 Optimally oriented flux . . . . . . . . . . . . . . . . . . . . . . . . . . . . . . . . . . . . . . . . . . . . . . . . . . . . . 1.2.3 Polar intensity profile . . . . . . . . . . . . . . . . . . . . . . . . . . . . . . . . . . . . . . . . . . . . . . . . . . . . . . . 1.3 2D/3D registration of medical imaging . . . . . . . . . . . . . . . . . . . . . . . . . . . . . . . . . . . . . . . . . . . . . . 1.3.1 Types of 2D/3D registration methods . . . . . . . . . . . . . . . . . . . . . . . . . . . . . . . . . . . . . . 1.3.2 Image-to-image methods . . . . . . . . . . . . . . . . . . . . . . . . . . . . . . . . . . . . . . . . . . . . . . . . . . . 1.3.3 Model-to-image methods . . . . . . . . . . . . . . . . . . . . . . . . . . . . . . . . . . . . . . . . . . . . . . . . . . . 1.3.4 Model-to-model methods . . . . . . . . . . . . . . . . . . . . . . . . . . . . . . . . . . . . . . . . . . . . . . . . . . .. 21 21 22 26 26 29 30 31 32 33 34 35 36 37. CHAPTER 2 OBJECTIVES AND GENERAL METHODOLOGY . . . . . . . . . . . . . . . . . . . . 2.1 Objectives of the research . . . . . . . . . . . . . . . . . . . . . . . . . . . . . . . . . . . . . . . . . . . . . . . . . . . . . . . . . . . . 2.2 General methodology . . . . . . . . . . . . . . . . . . . . . . . . . . . . . . . . . . . . . . . . . . . . . . . . . . . . . . . . . . . . . . . . . 2.2.1 Large structures segmentation using the level-set method . . . . . . . . . . . . . . . . 2.2.2 Vessel detection and segmentation . . . . . . . . . . . . . . . . . . . . . . . . . . . . . . . . . . . . . . . . . 2.2.3 2D/3D registration for the guidance of surgical procedures . . . . . . . . . . . . . .. 41 41 43 43 45 46. CHAPTER 3 3.1. 3.2. UNSUPERVISED MRI SEGMENTATION OF BRAIN TISSUES USING A LOCAL LINEAR MODEL AND LEVEL SET . . . . . . . . . . . . . . . . . . Introduction . . . . . . . . . . . . . . . . . . . . . . . . . . . . . . . . . . . . . . . . . . . . . . . . . . . . . . . . . . . . . . . . . . . . . . . . . . . 3.1.1 State-of-the-art techniques and their limitations . . . . . . . . . . . . . . . . . . . . . . . . . . . 3.1.2 The need for a more comprehensive model . . . . . . . . . . . . . . . . . . . . . . . . . . . . . . . . 3.1.3 Organization of this paper . . . . . . . . . . . . . . . . . . . . . . . . . . . . . . . . . . . . . . . . . . . . . . . . . . A local linear level set approach to MRI segmentation . . . . . . . . . . . . . . . . . . . . . . . . . . . . . 3.2.1 Formulation of the problem . . . . . . . . . . . . . . . . . . . . . . . . . . . . . . . . . . . . . . . . . . . . . . . . 3.2.2 Local linear region model . . . . . . . . . . . . . . . . . . . . . . . . . . . . . . . . . . . . . . . . . . . . . . . . . . 3.2.3 Segmentation using the level set method . . . . . . . . . . . . . . . . . . . . . . . . . . . . . . . . . . 3.2.4 Extension to a 4 phase model. . . . . . . . . . . . . . . . . . . . . . . . . . . . . . . . . . . . . . . . . . . . . . . 3.2.5 Outliers rejection . . . . . . . . . . . . . . . . . . . . . . . . . . . . . . . . . . . . . . . . . . . . . . . . . . . . . . . . . . . . 3.2.6 Implementation issues . . . . . . . . . . . . . . . . . . . . . . . . . . . . . . . . . . . . . . . . . . . . . . . . . . . . . .. 49 49 50 53 54 54 54 55 57 61 62 62.
(18) XVIII. 3.3. 3.4. 3.2.7 3D extension of the model . . . . . . . . . . . . . . . . . . . . . . . . . . . . . . . . . . . . . . . . . . . . . . . . . . 3.2.8 Computational cost . . . . . . . . . . . . . . . . . . . . . . . . . . . . . . . . . . . . . . . . . . . . . . . . . . . . . . . . . 3.2.9 Initialization by Fuzzy C-means clustering . . . . . . . . . . . . . . . . . . . . . . . . . . . . . . . . 3.2.10 Overview of our new segmentation model . . . . . . . . . . . . . . . . . . . . . . . . . . . . . . . . . Experimental validation . . . . . . . . . . . . . . . . . . . . . . . . . . . . . . . . . . . . . . . . . . . . . . . . . . . . . . . . . . . . . . 3.3.1 Synthetic Data . . . . . . . . . . . . . . . . . . . . . . . . . . . . . . . . . . . . . . . . . . . . . . . . . . . . . . . . . . . . . . . 3.3.2 Real Data . . . . . . . . . . . . . . . . . . . . . . . . . . . . . . . . . . . . . . . . . . . . . . . . . . . . . . . . . . . . . . . . . . . . Discussion and conclusions . . . . . . . . . . . . . . . . . . . . . . . . . . . . . . . . . . . . . . . . . . . . . . . . . . . . . . . . . .. 63 64 64 65 66 66 67 69. CHAPTER 4 4.1 4.2. 4.3. 4.4 4.5. 3D VESSEL DETECTION FILTER VIA STRUCTURE-BALL ANALYSIS . . . . . . . . . . . . . . . . . . . . . . . . . . . . . . . . . . . . . . . . . . . . . . . . . . . . . . . . . . . . . . . . . . . . . . . . . 77 Introduction . . . . . . . . . . . . . . . . . . . . . . . . . . . . . . . . . . . . . . . . . . . . . . . . . . . . . . . . . . . . . . . . . . . . . . . . . . . 77 Methodology . . . . . . . . . . . . . . . . . . . . . . . . . . . . . . . . . . . . . . . . . . . . . . . . . . . . . . . . . . . . . . . . . . . . . . . . . . 80 4.2.1 The structure ball: a local structure model . . . . . . . . . . . . . . . . . . . . . . . . . . . . . . . . 81 4.2.2 Band-limited spherical harmonics representation . . . . . . . . . . . . . . . . . . . . . . . . . 82 4.2.3 Contrast-invariant diffusivity index . . . . . . . . . . . . . . . . . . . . . . . . . . . . . . . . . . . . . . . . 85 4.2.4 Geometric descriptors. . . . . . . . . . . . . . . . . . . . . . . . . . . . . . . . . . . . . . . . . . . . . . . . . . . . . . . 85 4.2.4.1 Ratio descriptors. . . . . . . . . . . . . . . . . . . . . . . . . . . . . . . . . . . . . . . . . . . . . . . . . . . 86 4.2.4.2 Oriented bounding box . . . . . . . . . . . . . . . . . . . . . . . . . . . . . . . . . . . . . . . . . . . . 86 4.2.4.3 Fractional anisotropy . . . . . . . . . . . . . . . . . . . . . . . . . . . . . . . . . . . . . . . . . . . . . . 87 4.2.4.4 Flux . . . . . . . . . . . . . . . . . . . . . . . . . . . . . . . . . . . . . . . . . . . . . . . . . . . . . . . . . . . . . . . . 87 4.2.5 Vesselness measure . . . . . . . . . . . . . . . . . . . . . . . . . . . . . . . . . . . . . . . . . . . . . . . . . . . . . . . . . 89 4.2.6 Multiscale integration . . . . . . . . . . . . . . . . . . . . . . . . . . . . . . . . . . . . . . . . . . . . . . . . . . . . . . . 92 4.2.7 Parameter selection . . . . . . . . . . . . . . . . . . . . . . . . . . . . . . . . . . . . . . . . . . . . . . . . . . . . . . . . . 92 Experimental results . . . . . . . . . . . . . . . . . . . . . . . . . . . . . . . . . . . . . . . . . . . . . . . . . . . . . . . . . . . . . . . . . . 94 4.3.1 Experiments on synthetic images . . . . . . . . . . . . . . . . . . . . . . . . . . . . . . . . . . . . . . . . . . 94 4.3.2 Experiments on clinical images . . . . . . . . . . . . . . . . . . . . . . . . . . . . . . . . . . . . . . . . . . . . 98 Discussion and conclusion . . . . . . . . . . . . . . . . . . . . . . . . . . . . . . . . . . . . . . . . . . . . . . . . . . . . . . . . . . . 99 Acknowledgement . . . . . . . . . . . . . . . . . . . . . . . . . . . . . . . . . . . . . . . . . . . . . . . . . . . . . . . . . . . . . . . . . . . . 102. CHAPTER 5. 5.1 5.2 5.3 5.4. 5.5. NON-RIGID 2D/3D REGISTRATION OF CORONARY ARTERY MODELS WITH LIVE FLUOROSCOPY FOR GUIDANCE OF CARDIAC INTERVENTIONS . . . . . . . . . . . . . . . . . . . . . . . . . . . . . . . . . . . . . . . . . . . . . . . . . . . . . . . . . 103 Introduction . . . . . . . . . . . . . . . . . . . . . . . . . . . . . . . . . . . . . . . . . . . . . . . . . . . . . . . . . . . . . . . . . . . . . . . . . . . 104 Background Information . . . . . . . . . . . . . . . . . . . . . . . . . . . . . . . . . . . . . . . . . . . . . . . . . . . . . . . . . . . . . 107 Translational, rigid, and affine alignment. . . . . . . . . . . . . . . . . . . . . . . . . . . . . . . . . . . . . . . . . . . . 109 5.3.1 Multi frame alignment . . . . . . . . . . . . . . . . . . . . . . . . . . . . . . . . . . . . . . . . . . . . . . . . . . . . . . 113 Non-rigid registration. . . . . . . . . . . . . . . . . . . . . . . . . . . . . . . . . . . . . . . . . . . . . . . . . . . . . . . . . . . . . . . . . 114 5.4.1 Image energy . . . . . . . . . . . . . . . . . . . . . . . . . . . . . . . . . . . . . . . . . . . . . . . . . . . . . . . . . . . . . . . . 115 5.4.2 Internal energy . . . . . . . . . . . . . . . . . . . . . . . . . . . . . . . . . . . . . . . . . . . . . . . . . . . . . . . . . . . . . . 117 5.4.3 Energy minimization . . . . . . . . . . . . . . . . . . . . . . . . . . . . . . . . . . . . . . . . . . . . . . . . . . . . . . . . 117 5.4.4 Parameter selection . . . . . . . . . . . . . . . . . . . . . . . . . . . . . . . . . . . . . . . . . . . . . . . . . . . . . . . . . 118 Experimental results . . . . . . . . . . . . . . . . . . . . . . . . . . . . . . . . . . . . . . . . . . . . . . . . . . . . . . . . . . . . . . . . . . 120 5.5.1 Simulations . . . . . . . . . . . . . . . . . . . . . . . . . . . . . . . . . . . . . . . . . . . . . . . . . . . . . . . . . . . . . . . . . . 121.
(19) XIX. 5.5.1.1 Dependence on the initial solution . . . . . . . . . . . . . . . . . . . . . . . . . . . . . . . 5.5.1.2 Robustness to image noise . . . . . . . . . . . . . . . . . . . . . . . . . . . . . . . . . . . . . . . . 5.5.1.3 Non-rigid deformation . . . . . . . . . . . . . . . . . . . . . . . . . . . . . . . . . . . . . . . . . . . . 5.5.2 Clinical data . . . . . . . . . . . . . . . . . . . . . . . . . . . . . . . . . . . . . . . . . . . . . . . . . . . . . . . . . . . . . . . . . 5.5.3 Global alignment: evaluation of the performance of the optimizers. . . . . . 5.5.4 Comparison of the global alignment method with non-rigid registration 5.5.5 Global alignment in the multi frame scenario . . . . . . . . . . . . . . . . . . . . . . . . . . . . . 5.5.6 Semiautomatic tracking of the right coronary artery.. . . . . . . . . . . . . . . . . . . . . . Multimedia Material . . . . . . . . . . . . . . . . . . . . . . . . . . . . . . . . . . . . . . . . . . . . . . . . . . . . . . . . . . . . . . . . . . Discussion and conclusion . . . . . . . . . . . . . . . . . . . . . . . . . . . . . . . . . . . . . . . . . . . . . . . . . . . . . . . . . . .. 121 122 124 125 126 129 130 134 135 135. CHAPTER 6 DISCUSSIONS . . . . . . . . . . . . . . . . . . . . . . . . . . . . . . . . . . . . . . . . . . . . . . . . . . . . . . . . . . . . . 6.1 A level-set method using local-linear region models for the segmentation of structures with spatially varying intensity . . . . . . . . . . . . . . . . . . . . . . . . . . . . . . . . . . . . . . . . . . . 6.2 Brain tissues segmentation in MRI . . . . . . . . . . . . . . . . . . . . . . . . . . . . . . . . . . . . . . . . . . . . . . . . . . 6.3 Accurate local structure modeling and vessel detection using structure balls . . . . . 6.4 2D/3D registration of centerline models with X-ray angiography using global transformation models . . . . . . . . . . . . . . . . . . . . . . . . . . . . . . . . . . . . . . . . . . . . . . . . . . . . . . . . . . . . . . . . 6.5 Non-rigid 2D/3D registration of centerline models with X-ray angiography . . . . . . 6.6 Improved surgical guidance using 2D/3D registration . . . . . . . . . . . . . . . . . . . . . . . . . . . . . . 6.7 Application for MAPCAs procedure . . . . . . . . . . . . . . . . . . . . . . . . . . . . . . . . . . . . . . . . . . . . . . . .. 137. 5.6 5.7. 137 138 139 140 141 142 143. GENERAL CONCLUSION . . . . . . . . . . . . . . . . . . . . . . . . . . . . . . . . . . . . . . . . . . . . . . . . . . . . . . . . . . . . . . . . . . . 145 APPENDIX I. EULER-LAGRANGE EQUATION FOR LOCAL LINEAR STATISTICS149. APPENDIX II. SEMI-AUTOMATIC SEGMENTATION OF MAJOR AORTO-PULMONARY COLLATERAL ARTERIES (MAPCAS) FOR IMAGE GUIDED PROCEDURES . . . . . . . . . . . . . . . . . . . . . . . . . . . . . . . . . . . . . . . . . . . . . . . . . . . . . . . . . . . . . 153. REFERENCES . . . . . . . . . . . . . . . . . . . . . . . . . . . . . . . . . . . . . . . . . . . . . . . . . . . . . . . . . . . . . . . . . . . . . . . . . . . . . . . . . 163.
(20)
(21) LIST OF TABLES Page Table 1.1. Categories of 2D/3D registration methods . . . . . . . . . . . . . . . . . . . . . . . . . . . . . . . . . . . . . . 35. Table 3.1. Average Tanimoto index for various segmentation methods on the IBSR 20 normal brain scan . . . . . . . . . . . . . . . . . . . . . . . . . . . . . . . . . . . . . . . . . . . . . . . . . . . . . . 68. Table 3.2. Average Dice index for various segmentation methods on the newer IBSR 18 normal brain scan . . . . . . . . . . . . . . . . . . . . . . . . . . . . . . . . . . . . . . . . . . . . . . . . . . . . . . 69. Table 4.1. Values of the proposed shape descriptors computed on the six vessel voxel configurations presented in Fig. 4.2. . . . . . . . . . . . . . . . . . . . . . . . . . . . . . . . . . . . . . 91. Table 4.2. Values of the proposed shape descriptors computed on the eight non vessel voxel configurations presented in Fig. 4.4 . . . . . . . . . . . . . . . . . . . . . . . . . . . . . . 91. Table 5.1. RMS residual energy and resulting 2D error, in function of the transformation model. . . . . . . . . . . . . . . . . . . . . . . . . . . . . . . . . . . . . . . . . . . . . . . . . . . . . . . . . . .130. Table 5.2. Total computational time for the two global optimizers. . . . . . . . . . . . . . . . . . . . . . .131. Table 5.3. Mean residual 2D projection error, in mm, calculated after rigid, affine and non-rigid registration for five patients. . . . . . . . . . . . . . . . . . . . . . . . . . . . . .132.
(22)
(23) LIST OF FIGURES Page Figure 0.1. Brain tissue segmentation . . . . . . . . . . . . . . . . . . . . . . . . . . . . . . . . . . . . . . . . . . . . . . . . . . . . . . . 8. Figure 0.2. Pulmonary vessels, heart, and lungs . . . . . . . . . . . . . . . . . . . . . . . . . . . . . . . . . . . . . . . . . . . . 9. Figure 0.3. Normal blood flow through the heart . . . . . . . . . . . . . . . . . . . . . . . . . . . . . . . . . . . . . . . . . . 10. Figure 0.4. X-ray angiography of MAPCAs . . . . . . . . . . . . . . . . . . . . . . . . . . . . . . . . . . . . . . . . . . . . . . . 10. Figure 0.5. CTA scan of a young child with MAPCAs . . . . . . . . . . . . . . . . . . . . . . . . . . . . . . . . . . . . 11. Figure 0.6. The coronary arteries . . . . . . . . . . . . . . . . . . . . . . . . . . . . . . . . . . . . . . . . . . . . . . . . . . . . . . . . . . . 12. Figure 0.7. Biplane fluoroscopy of a left coronary artery with CTO . . . . . . . . . . . . . . . . . . . . . . 13. Figure 0.8. Research problems . . . . . . . . . . . . . . . . . . . . . . . . . . . . . . . . . . . . . . . . . . . . . . . . . . . . . . . . . . . . . . 14. Figure 1.1. A simple level-set function . . . . . . . . . . . . . . . . . . . . . . . . . . . . . . . . . . . . . . . . . . . . . . . . . . . . . 22. Figure 1.2. Evolution of the level-set during a segmentation . . . . . . . . . . . . . . . . . . . . . . . . . . . . . . 23. Figure 1.3. MAPCAs segmentation. . . . . . . . . . . . . . . . . . . . . . . . . . . . . . . . . . . . . . . . . . . . . . . . . . . . . . . . . 27. Figure 1.4. Geometry of a 2D/3D imaging system. . . . . . . . . . . . . . . . . . . . . . . . . . . . . . . . . . . . . . . . . 34. Figure 3.1. Two consecutive sample slices from the IBSR, subject 5_8 . . . . . . . . . . . . . . . . . . 53. Figure 3.2. Comparison of a segmentation with our local linear model and with the piecewise smooth model . . . . . . . . . . . . . . . . . . . . . . . . . . . . . . . . . . . . . . . . . . . . . . . . . . . 61. Figure 3.3. Results obtained on a slice of IBSR subject 4_8 . . . . . . . . . . . . . . . . . . . . . . . . . . . . . . 66. Figure 3.4. Sample segmentations obtained with our method on the BrainWeb synthetic scans . . . . . . . . . . . . . . . . . . . . . . . . . . . . . . . . . . . . . . . . . . . . . . . . . . . . . . . . . . . . . . . . . . 71. Figure 3.5. Results obtained on the 1mm BrainWeb data for various noise level . . . . . . . . 72. Figure 3.6. Results obtained on the 3mm BrainWeb data, INU=40%. . . . . . . . . . . . . . . . . . . . . 72. Figure 3.7. Sample segmentation for the IBSR dataset . . . . . . . . . . . . . . . . . . . . . . . . . . . . . . . . . . . . 73. Figure 3.8. Performance index for the 20 normal brain of the IBSR . . . . . . . . . . . . . . . . . . . . . . 74. Figure 3.9. Sample result for subject 17_3 of the IBSR database. . . . . . . . . . . . . . . . . . . . . . . . . 75.
(24) XXIV. Figure 3.10. Sample segmentation for the newer IBSR dataset. . . . . . . . . . . . . . . . . . . . . . . . . . . . . 75. Figure 4.1. Icosahedron and subdivision pattern . . . . . . . . . . . . . . . . . . . . . . . . . . . . . . . . . . . . . . . . . . . 82. Figure 4.2. Illustration of the shape of the SBall and DBall for various configurations. . 83. Figure 4.3. Oriented bounding box of a DBall and computation of the A (x) function on the circle defined by the v3 vector . . . . . . . . . . . . . . . . . . . . . . . . . . . . . . . . 88. Figure 4.4. DBall representation for some interfering patterns . . . . . . . . . . . . . . . . . . . . . . . . . . . . 90. Figure 4.5. Multiscale response for simple cylindrical patterns with various radii . . . . . . . 93. Figure 4.6. Multiscale response for a simple 3D vessel pattern at various angles . . . . . . . . 95. Figure 4.7. Vesselness filter responses for the slice in Fig. 4.6 for 5 different filters . . . . . 96. Figure 4.8. Vesselness filter responses for the median slice of the structural noise test volume . . . . . . . . . . . . . . . . . . . . . . . . . . . . . . . . . . . . . . . . . . . . . . . . . . . . . . . . . . . . . . . 97. Figure 4.9. True Positive Rate, and False Positive Rate for the fish bone image as a function of the classification threshold . . . . . . . . . . . . . . . . . . . . . . . . . . . . . . . . . . . 98. Figure 4.10. True Positive Rate and False Positive Rate for the structural noise image as a function of the classification threshold . . . . . . . . . . . . . . . . . . . . . . . . . . . . 98. Figure 4.11. Vessel detection in a cropped clinical TOF–MRA volume . . . . . . . . . . . . . . . . . .100. Figure 4.12. Vessel detection in a cropped clinical cardiac CTA volume . . . . . . . . . . . . . . . . .101. Figure 5.1. Geometry of the imaging system . . . . . . . . . . . . . . . . . . . . . . . . . . . . . . . . . . . . . . . . . . . . . .108. Figure 5.2. Sample images for 2D/3D registration . . . . . . . . . . . . . . . . . . . . . . . . . . . . . . . . . . . . . . . .109. Figure 5.3. Progression of a non-rigid registration . . . . . . . . . . . . . . . . . . . . . . . . . . . . . . . . . . . . . . . .115. Figure 5.4. Point matching and myocardium constraints . . . . . . . . . . . . . . . . . . . . . . . . . . . . . . . . .116. Figure 5.5. Total displacement of the centerline as a function of the number of iterations . . . . . . . . . . . . . . . . . . . . . . . . . . . . . . . . . . . . . . . . . . . . . . . . . . . . . . . . . . . . . . . . . . . . . . .118. Figure 5.6. Illustration of the behavior of parameter λ in the non-rigid registration method . . . . . . . . . . . . . . . . . . . . . . . . . . . . . . . . . . . . . . . . . . . . . . . . . . . . . . . . . . . .119. Figure 5.7. Mean 2D and 3D error after non-rigid registration . . . . . . . . . . . . . . . . . . . . . . . . . . .120. Figure 5.8. Creation of the DRRs . . . . . . . . . . . . . . . . . . . . . . . . . . . . . . . . . . . . . . . . . . . . . . . . . . . . . . . . . .122.
(25) XXV. Figure 5.9. Performance of the optimizers with respect to a perturbation of the initial position . . . . . . . . . . . . . . . . . . . . . . . . . . . . . . . . . . . . . . . . . . . . . . . . . . . . . . . . . . . . . . . . .123. Figure 5.10. Performance of the optimizers with respect to the standard deviation of the input DRR noise . . . . . . . . . . . . . . . . . . . . . . . . . . . . . . . . . . . . . . . . . . . . .124. Figure 5.11. Sample non-rigid registration with simulated data . . . . . . . . . . . . . . . . . . . . . . . . . . .125. Figure 5.12. Residual 3D error with respect to the simulated non-rigid deformation level . . . . . . . . . . . . . . . . . . . . . . . . . . . . . . . . . . . . . . . . . . . . . . . . . . . . . . . . . . . . . .126. Figure 5.13. Sample output obtained with the affine transformation model using nine different optimizers on the Patient 3 dataset . . . . . . . . . . . . . . . . . . . . . . . . . . . .128. Figure 5.14. Mean 2D error, per optimizer, and per patient, after alignment with the affine transformation model. . . . . . . . . . . . . . . . . . . . . . . . . . . . . . . . . . . . . . . . . . . . . . .131. Figure 5.15. Total computational time, in millisecond, for all local optimizers, when aligning the 3D centerline using the translation only, rigid, and affine transformation models, successively . . . . . . . . . . . . . . . . . . . . . . . . . . . . . .132. Figure 5.16. Input image, rigid alignment, affine alignment, and non-rigid registration .133. Figure 5.17. Registration over a sequence of frames . . . . . . . . . . . . . . . . . . . . . . . . . . . . . . . . . . . . . . .134. Figure 5.18. Tracking the RCA. . . . . . . . . . . . . . . . . . . . . . . . . . . . . . . . . . . . . . . . . . . . . . . . . . . . . . . . . . . . . .135.
(26)
(27) LIST OF ABBREVIATIONS 2D. Bidimensional. 2D+t. Time series of 2D images. 3D. Tridimensional. 3D+t. Time series of 3D images. CHU. Centre hospitalier universitaire. CS. Coordinate system. CSF. Cerebrospinal fluid. CT. X-ray computed tomography. CTA. X-ray computed tomography angiography. CTO. Chronic total occlusion. DBall. Diffusion-index ball. DIBCO. Document image binarization contest. DRR. Digitally reconstructed radiograph. dtMRI. Diffusion tensor magnetic resonance imaging. ECG. Electrocardiogram. EM. Expectation-maximization. ETS. École de technologie supérieure. FCM. Fuzzy C-means. FMM. Fast marching method. fMRI. Functional magnetic resonance imaging. FPR. False positive rate. GFA. Generalized fractional anisotropy. GHz. Gigahertz. GM. Gray matter. GMM. Gaussian mixture model.
(28) XXVIII. GPU. Graphical processing unit. HARDI. High angular resolution diffusion (magnetic resonance) imaging. HU. Hounsfield unit. IBSR. Internet Brain Segmentation Repository. ICDAR. International Conference on Document Analysis and Recognition. IEEE. Institute of Electrical and Electronics Engineers. INU. Intensity nonuniformity. ITK. Insight segmentation and registration toolkit. LCA. Left coronary artery. MAPCA. Major aorto-pulmonary collateral artery. Max. Maximum. MGH. Massachusetts General Hospital. Min. Minimum. MNI. Montreal Neurological Institute. MPM-MAP. Maximizer of the posterior marginal — maximum a posteriori. MPR. Multiplanar reconstruction. MR. Magnetic resonance. MRA. Magnetic resonance angiography. MRF. Markov random field. MRI. Magnetic resonance imaging. NOFlux. Normalized oriented flux. NSFlux. Normalized spherical flux. OBB. Oriented bounding box. OOF. Optimally oriented flux. PCI. Percutaneous coronary intervention. PFA. Planar fractional anisotropy. PVE. Partial volume effect.
(29) XXIX. RCA. Right coronary artery. RF. Radio frequency. RMS. Root mean square. SBall. Structure ball. SFlux. Spherical flux. SH. Spherical harmonic. SPIE. International society for optics and photonics. SVM. Support vector machine. T. Tesla. TOF. Time of flight. TPR. True positive rate. Voxel. Volume element, a 3D anolog to the pixel. VTK. Insight visualization toolkit. WM. White matter.
(30)
(31) INTRODUCTION In recent decades, medical imaging had a fundamental impact in almost every branch of medicine. With in vivo techniques to image patient tissues, practitioners are able to accurately diagnose an even broader range of conditions, study the structure and the functions of human brain, perform sophisticated laparoscopic interventions on a daily basis, and make detailed surgical plans before entering the operating room. The development of non-invasive imaging procedures, such as magnetic resonance imaging and ultrasound, makes it ethically possible to study healthy subjects, enabling scientists to acquire a deeper understanding of the living body. But this sophistication is not in itself sufficient to surmount all the medical hurdles. As the world’s population is getting older, the increase in prevalence of aging-associated diseases represents a major medical challenge. The causes of many of those conditions, such as the Alzheimer’s disease and dementia, are still only partially understood. More prospective and retrospective studies are needed if neurologists are to sharpen their expertise and to gain a better understanding of the causes and characteristics of those conditions. New imaging devices allow to observe an always increasing range of biophysical phenomena, but analyzing the acquired images requires time and energy, which puts a practical bound on how much information we can extract from them. An aged population is also more at risk of developing vascular disorders. In fact, heart diseases are now the leading causes of mortality in Canada, where they account for 32% of all deaths (Fondation des maladies du coeur, 2008), a situation similar to that in the USA (36.3% of deaths) (AHA News, 2008; Rosamond et al., 2008; Kung et al., 2008) and in the rest of the world (30% of deaths) (World Health Organization, 2008). But vascular problems are not only an issue among the elderly. Heart diseases are among the most commonly encountered congenital disorders, and, among them, are the principal cause of death. In many of those cases, the well being of the patient depends on the outcome of a complex surgical procedure. The always improving imaging tools consistently help to make routine ambitious clinical protocols, but many challenges still lay on the way to risk-free intervention. While modern medical imaging modalities permit to gain fabulous insight about the patients inner structures, the interpretation and study of medical images remains tedious, complex, and error prone. In some circumstances, the targeted tissues might be poorly visible, or adjacent structures might be hard to discriminate. In other cases, accurately delineating the structures of interest manually might be too time consuming to be of practical use. The problem of accurately positioning the image information within the physical world is also of the highest.
(32) 2. importance in many clinical situations. Notwithstanding those various difficulties, recognizing and extracting high level information from medical images is key to gaining a better understanding of a patient inner structures, and, ultimately, will foster the emergence of innovative treatments. The objective of this thesis is to establish a biomedical image analysis framework for advanced visualization and surgical guidance. It consists of two main parts: 1) the creation of 3D patients-specific models by segmenting some structures of interest in 3D medical scans, and 2) the registration of patient-specific 3D models with other medical images. Image segmentation is concerned with the accurate and repeatable delineation of biological structures in medical images. Such techniques are highly valuable since the segmented image regions constitute a computational model of some important patient structures, and thus enable scientists and practitioners to study the morphology of the tissues in a detailed and quantitative way. Similarly to a road map, a 3D model can also serve as a reference during surgical intervention planning and execution. But it is also possible to envision more sophisticated applications for such 3D model. This model can also serve during the operation to enhance the interventional image. If the 3D model is carefully aligned and warped on top of the interventional images, it will complement those images, and reveals critical information that is not directly available from the interventional methodology. We refer to such alignment and warping process as 2D/3D model to feature image registration, and this constitutes the second part of our framework. Since a 2D/3D registration process positions the 3D model with respect to the interventional image, and thus with respect to the physical world, it creates a convincing and intuitive geometrical reference that can significantly reduce the ambiguity inherent to the guidance of percutaneous interventions. At the practical level, two broad types of applications were targeted for the evaluation of the performance of the proposed methods: 1) brain morphological studies, and 2) vascular interventions. The study of brain morphology is a fundamental part of many researches on Alzheimer’s disease and dementia. At the image processing level, it is often required to discern between the three main tissue classes. In the past few years, this segmentation problem formed an almost canonical benchmark for general purpose and specialized image segmentation algorithms, and thus presented an interesting opportunity to test an important constituent of our framework. In what concerns the vascular interventions, two specific clinical situations were considered. In work done in collaboration with Ste-Justine Hospital, we were interested in segmenting two types of complex vascular structures, major aorto-pulmonary arteries and coronary arteries, in order to ease surgical planning. The assumption being that a 3D model of.
(33) 3. the structure is easier to visualize and understand than the full scan. The 2D/3D registration and surgical guidance aspect of framework described here was developed in great part in collaboration with Siemens Corporate Research. There, it was question of registering a model of the coronary arteries with interventional fluoroscopy. Clinically speaking, this can help to reduce ambiguities during one of the most delicate type of non-invasive heart surgeries: percutaneous intervention of chronic total occlusion of a coronary artery. In the following paragraphs, we briefly cover the specific problems that were tackled in this research, and discuss their relative importance. As it will be possible to recognize, the research presented here encompass a large variety of methods and a broad range of practical applications. While this rather large field of view might seem unnecessary at first, we feel that it was essential to clearly demonstrate the theoretical benefits of all proposed image processing approaches. Segmenting large, relatively uniform, structures in 3D medical scans has many practical applications in biomedical analysis, especially when the exact shape of some tissue is of great interest. Perhaps one of the most striking example of such application is the segmentation of brain tissues in magnetic resonance imaging. In morphological neurological studies, an important task is to separate the white matter from the gray matter and cerebrospinal fluid. Having those structures segmented greatly facilitates the study of the brain morphology and helps to characterize many conditions and pathologies. Unfortunately, various limitations of the acquisition device result in images that are corrupted by different types of noise. Imperfections in the radio frequency coil cause low frequency wave-like interfering patterns to appear and results in non-uniform voxel intensity recordings even for uniform structures. This characteristic of the image is very challenging for most automatic segmentation algorithms since the correct segmentation depends on local feature of the images: no global threshold would produce an acceptable segmentation. This does not imply that the problem cannot be solved by an automatic process, only that a capable method would need to consider more involved processes and features. But what type of process and what kind of features would permit to segment such structures that might be relatively uniform locally, but where the intensity could present large variation from one region of the image to the other, even for the same class of tissues? The solution that is proposed in this thesis is to compute local linear models of the image intensity, which are robust to low frequency non-uniformity, and to use those models to guide the segmentation process. This idea, based on a differential geometry formulation of the problem, has been implemented within the level-set active contour framework. This algorithm was able to generate, to the best of our knowledge, the best published results for this category of algorithms on the publicly available IBSR database..
(34) 4. After having defined our method for the segmentation of large structures, we attempted to adapt this framework to another vastly different problem that is clinically relevant: the segmentation of vascular structures. During work done in collaboration with Ste-Justine Hospital and also with Siemens Corporate Research, it soon appeared that the proposed region based active contour method was of limited use in what concerns the segmentation of very fine tubular structures. The reason of this limitation is twofold. On one side, the viscosity term used in most active contour schemes causes a bias against all small or narrow structures. On the other side, the recorded voxel intensities for very fine structures become dominated by the partial volume effect, which makes regional pixel intensity modelling ineffective at those locations. Those two aspects of the fine tubular structure segmentation problem call for a method that is more specific than the proposed active contour scheme. Fine tubular, or curvilinear, structures can be detected by analyzing the local contrast around each voxel position: if a structure is present, one would expect little intensity variation in one direction, and much larger intensity variation in the other directions. As it would be discussed in chapter 1, many approaches of this type were proposed in the literature, but most of them are ineffective when the target structure present bifurcations or crossings. This brings the following question: is it possible to define a generic image filter that would detect fine curvilinear structures in 3D medical images without excluding bifurcations? In our research, we investigated a new computational model that uses finite differences and a spherical sampling scheme to this end. The results is a new curvilinear structure detection method that is both more specific and more sensitive than the existing method. This new technique has been demonstrated on MRI and CT scan for the detection of different curvilinear structures, and is not tied to any specific 3D imaging modality or biological structures. This new curvilinear detection method can be used standalone to segment simple tubular structure, or it can complement the segmentation generated by a more general purpose algorithm. For example, for the segmentation of a pulmonary artery tree, the main vessels could be segmented by an active contour method, and the fine ramification by the curvilinear detection method proposed. If the structure of interest is approximately tubular and reasonably salient, the two segmentation results can be merged and will integrate gracefully. Thus, the two methods can be perceived as complimentary. We believe that in a clinical situation, those two techniques can be used together to segment a large variety of vascular structures. Segmenting tissues in medical images permits to clearly distinguish the target structures from the background elements and ease various morphological studies. In fact, the segmentation result can essentially be regarded as a patient-specific 3D model of the anatomical structures.
(35) 5. of interest. If we are to consider the domain of image-based surgical assistance, this brings the question of quantitatively relating the virtual 3D model with the interventional images, and thus with the physical world. That is, how to position the 3D model with respect to the patient body and surgical instruments in the operative room? Let us assume that during a certain surgical procedure, the interventional biplane fluoroscope has been dutifully calibrated, then it is reasonable to admit that the visualized image are an accurate geometric representation of the scene and that they can be used to guide the surgical operation. Unfortunately, although the interventional images might be correct, there are situations where they are too limited to unambiguously guide the procedure. For example, the visibility of some structures of interest might depends on the presence of a toxic contrast agent, which, for patient safety sake, might only be injected parsimoniously into a human body. In other situation, the 2D nature of the interventional image can make it very challenging to correctly understand the 3D geometry of the target structures. In such cases, displaying a 3D model of the patient structures on top of, or along with, the interventional images can certainly help the practitioner building a more accurate mental image of the patient body, in less time. However, the 3D model needs to be carefully aligned within the scene in order to minimize the observed inter-modality discrepancy and to constitute a coherent representation of the whole scene. Using the calibration of the apparatus as a starting point and the 2D and 3D images features, it is possible to convincingly align the 3D model with the 2D interventional images, a process known as a 2D/3D registration. In mathematical optimization terms, the 2D/3D registration problem is generally considered as well posed if only rigid, affine, or other restricted parametric transformation models are considered. Nevertheless, the rotational nature of the problem makes it strongly non-linear, and thus hard to minimize. In addition, various patient movements, such as respiration and the beating of the heart, can significantly deform the structures of interest during the course of the intervention. This makes it very important to non-rigidly deform the 3D patient model to preserve visual consistency. This, however, is a hard ill-posed problem. Since, surgical guidance is considered, there is also the question of computational complexity. Indeed, it is hard to believe that the surgeon would place an intervention on hold to accommodate a slow registration algorithm. Thus, the question is: is it possible to create a 2D/3D non-rigid registration process that is fast enough to be used during an intervention? The algorithm defined in this thesis takes benefit of a differential geometry formulation to tackle this challenge. This allows the proposed approach to compute a non-rigid 2D/3D registration in typically less than 3 seconds on contemporary commodity hardware. The method has been tested on datasets from 5 patients with cardiac disorders with good results. Thus, its capability, performance and speed makes this method suitable for intra-operative usage..
(36) 6. Taken together, the level-set segmentation method, the curvilinear structure detection technique, and the 2D/3D registration algorithm defined in this thesis form a segmentation and registration framework that is useful in the context of general biological structure visualization, with a special emphasis on vascular interventions. Taken individually, they allow to perform their own range of specific task, as described in the following chapters. Nonetheless, before developing the theoretical aspect of this research further, it is essential to consider the clinical context of the work, and to highlight the challenges arising at the practical level. Then, the research problems that are considered can be stated and discussed more formally. Finally, an outline of this thesis is presented. 0.1. Clinical context. The practical value of any computerized biomedical analysis tool will strongly depends on the specific characteristics of the problem considered. It is therefore necessary to precise the application domains of the research, both in clinical and in biomedical image analysis terms. As introduced earlier, during the course of our research, we were interested in brain tissue imaging and also in two severe vascular conditions: residual major aorto-pulmonary collateral arteries (MAPCAs) in pediatric cardiology, and chronic total occlusion (CTO) of the coronary arteries in adults. In the case of brain imaging, the modality of choice is the magnetic resonance imaging (MRI). In what concerns vascular conditions, the pre operative assessment modality of choice is generally the computerized tomography (CT), a technology that uses X-rays to generate a 3D image of the vascular structures. These CT scans are used to analyze the problematic structures at the diagnostic, planning and surgical levels. In the following paragraphs we expose those various pathological conditions and discuss the challenges associated with the imaging modalities involved in both their study and treatments. The morphology of the human brain changes widely during the lifespan of an individual (Sakai et al., 2011). In fact, neurologists have observed than the accumulation of memories and experiences are linked with physiological changes in the brain tissues. While in the past this knowledge could only be acquired from the study of post-mortem organs, the advance of MRI in recent decades made it possible to acquire in-vivo images of a patient’s brain with virtually no risk for the health of either the patient or the practitioners. The acquisition of multiple snapshots of the brain of an individual at different points in time, in a longitudinal study, allows to appreciate how brain development is related with morphological changes with an interesting accuracy. While some of those morphological changes are part of the normal aging process,.
(37) 7. others are linked with the progressions of divers neurological conditions such as Alzheimer’s disease, dementia with Lewy bodies, or Parkinson disease. Although these aging-related neurological disorders are widespread among the elderly, their complex pathophysiological mechanisms are still only poorly understood. As a result, few treatments exist for those conditions (Venneri, 2007). Brain volumetric studies permit to support diagnostic, help monitor the progress of the condition, and permit to gain knowledge about the structural aspects of the diseases. (Bozzali et al., 2008) In a brain volumetric study, the volume and shape of the various brain structures are analyzed and compared. This allows to localize abnormalities, and to quantify the change in volume of the various brain tissues on a voxel-to-voxel basis. The validity and accuracy of the study thus depends on the availability of good quality segmentations of a number of brain scans. Most brain volumetric studies use T1-weighted MRI as the input modality. Such images present a high soft tissues contrast that, in the best case scenario, allows to clearly identify the boundaries between the congregation of neurons, or gray matter (GM), the interconnections, or white matter (WM), and the cerebrospinal fluid (CSF). Brain tissues segmentation is generally performed initially using a manual or semi-automatic method (Bozzali et al., 2008). When a segmentation becomes available for a certain patient, registration based approaches can then be used to capture relatively small changes.1 Unfortunately, T1-weighted MR images are generally corrupted by low-frequency intensity non-uniformities, caused by imperfection in the radio-frequency coil of the MRI apparatus (van Leemput et al., 1999). This defect, often referred to as the bias field of the system, makes it difficult to clearly distinguish between the different brain tissue classes. In addition, the limited resolution available from the imaging technology implies that more than one tissue class might be present in a single voxel. This socalled partial volume effect blurs the boundaries between the different tissues and complicates the task of the neurologists further. The presence of the bias field and the partial volume effect makes it difficult to obtain accurate and repeatable brain segmentation, which in turn can limit the accuracy of brain volumetric studies. Theses difficulties call for the development of automatic brain tissue segmentation methods that would be more repeatable and requires less effort than the manual or semi-manual methods. However, designing a method that is appropriated for this task is especially challenging because of the presence of intensity non-uniformity. In the worst cases, the voxel representing the white 1 Registration-based brain tissue segmentation is a rapidly evolving field with always improving methods able to cope with larger and larger variations. However, the problem of producing good initial segmentations is still of interest in the definition of atlases, for immature brains, and for brains with abnormalities..
(38) 8. matter in a certain image region are darker than the voxel representing gray matter in another image region, a situation that would confuse most classical segmentation algorithms. In such case, the voxel intensities need to be interpreted locally: on a T1-weighted image, white matter voxels are always lighter than surrounding gray matter voxels, in a certain neighbourhood, even if than is not true for all the voxels over the complete image domain. In addition, the bias field induced variation is generally smooth and of low frequency. This suggests that an appropriate segmentation method could use a region model capable of taking into account such characteristics. Also, since the different biological structures are mostly continuous, a certain degree of spacial coherence can be taken into account. In summary, a segmentation method that is robust to progressive change in the intensity of the structures to segment and that can enforce a certain spacial coherence could help to produce repeatable and accurate brain tissue segmentations. 180. 213 180. WM CSF. 177. GM 171 (a). (b). (c). Figure 0.1 Sample brain tissue segmentation. a) expert segmentation, b) intensity non-uniformity in a white matter region, the numbers indicate the intensity level, and c) one case where WM voxels are darker than GM voxels. The problem of segmenting structures with intensity variation is frequently encountered in medical imaging, and from a broader perspective, this thesis focuses on researching computational tools for diagnosis and surgical planning and guidance. As such, it is our goal to propose methods that are applicable to a large set of medical situations. Consequently, we did not restrict ourselves to brain volumetric studies as an application, and we also address the topic of surgical guidance in vascular interventions. Specifically, we were interested in two other clinical problems: the treatment of MAPCAs, and chronic total occlusions (CTO) of the coronary arteries..
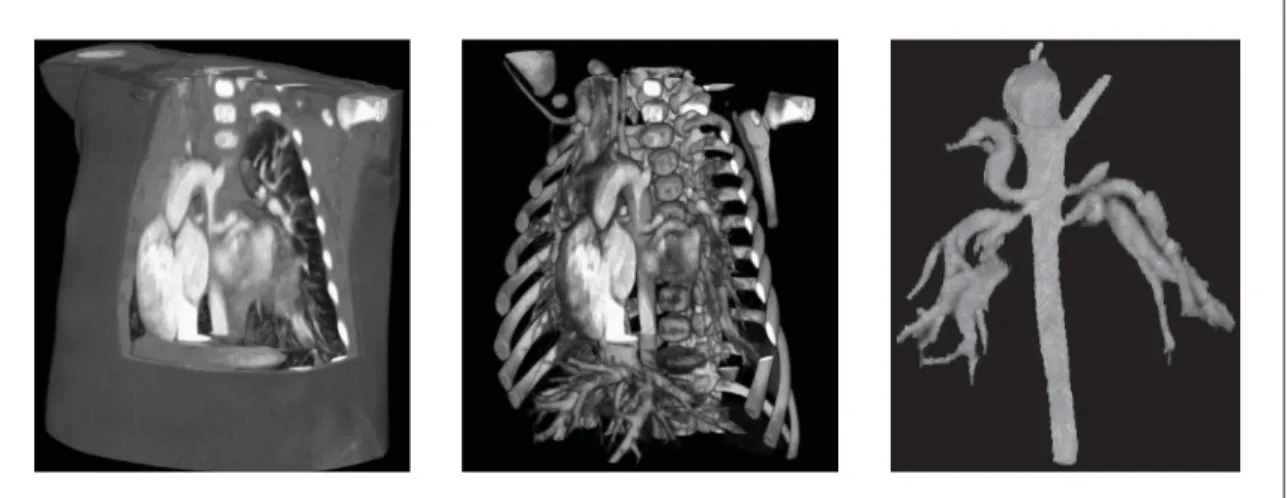
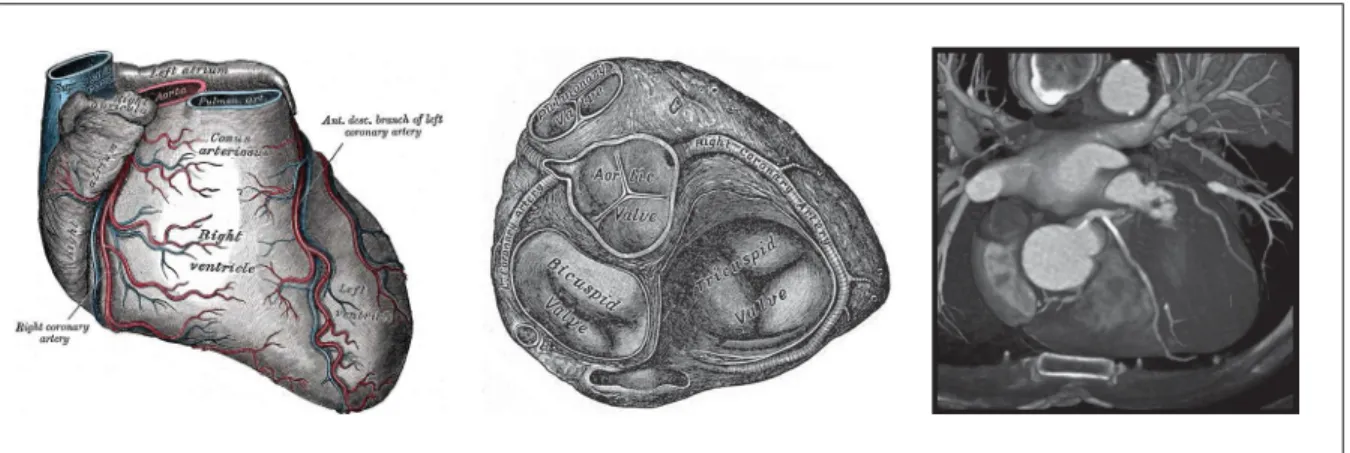
(39) 9. MAPCAs, although part of normal embryonic development, are often harmful after birth, and are associated with severe cyanotic congenital heart defects, such as the tetralogy of Fallot or pulmonary atresia with ventricular septal defect. In tetralogy of Fallot, the pulmonary artery (see Figure 0.2) can be severely atrophied, or even be absent, which prevents oxygen-poor blood from being re-oxygenated by passing through the lung, as is normally the case (see Figure 0.3). Instead, minimal circulation is ensured by one or more MAPCAs directly linking the aorta to the lungs. As the normal function of the aorta is to deliver oxygen-rich blood to the circulatory system, the oxygenation process is inefficient. The treatment of such a condition generally requires one or more delicate surgical interventions. During the unifocalization procedure, the MAPCAs are consolidated in a way that reconstruct a functional pulmonary vascular bed. In addition, any potential secondary irrigation paths are shut in order to restore a normal blood flow. The shape and disposition of the MAPCAs are complex and vary widely from one individual to another. Some vessels can also be very small. Therefore, good surgical planning is crucial to the success of the operation.. Figure 0.2. Pulmonary vessels, heart, and lungs. Frontal (left) and dorsal (right) views. Illustrations taken from Gray (1918).. Although analysis of blood flow is usually performed using 2D fluoroscopy with targeted contrast agent injection using catheters (see Figure 0.4), understanding the complex geometry of MAPCAs requires a 3D CT angiography (CTA) in the vast majority of cases. Generally CTA, and not magnetic resonance angiography, is favored in these cases, because its higher spatial resolution makes it possible to capture smaller vessels. In addition, because of the CTA’s much shorter acquisition time, it might not be necessary to sedate the patient, and so avoid the risk of harm to fragile pediatric patients..
(40) 10. Figure 0.3. Normal blood flow through the heart. The aorta is highlighted in red and the pulmonary artery in blue. Illustration adapted from Yaddah (2006).. Figure 0.4 X-ray angiography of MAPCAs. Contrast agent injection in the aorta clearly demonstrate the passage of the blood through collateral arteries. Lateral (left) and frontal (right) views. The 3D information gathered by the CTA scan makes it possible to resolve most geometric ambiguities with good precision and helps to determine the dimensions of the structures, enabling the physician to prescribe the most appropriate treatment. However, since the 3D volume is dense, the structures of interest cannot be visualized directly. Hounsfield units (HU) to intensity and HU to opacity mappings are generally used to generate a selective visualization that.
(41) 11. better highlights the structures. Still, it may not be possible to distinguish the structures that are of interest from other structures with similar tissue characteristics using this basic technique. In addition, in some situations an incomplete representation or a poor visualization might result from the uneven propagation of the contrast agent, partial volume effect, or motion artifacts, for example. A high quality patient specific model can be created from the 3D scan which captures the geometry of all the structures of interest and removes any distracting background (see Figure 0.5). Such a model can facilitate the practitioner’s understanding of the patient geometry, which is key to the success of the procedure.. Figure 0.5 CTA scan of a young child with MAPCAs. Volume rendering (left), volume rendering with transparent soft tissues (middle), and 3D presentation of the segmented aorta and attached MAPCAs (right). MAPCA procedures are usually highly invasive. Surgical guidance is achieved using monoor biplane fluoroscopy with periodic contrast agent injection. The fluoroscopic images are acquired on-demand, rather than continuously, to minimize patient exposure to X-rays. These 2D images are difficult to interpret and can be geometrically ambiguous. As a result, the surgeon regularly needs to refer to the 3D model during the intervention, but establishing correspondence between the 3D model and the 2D images can be challenging. Keeping the 3D model aligned with the interventional image would help the surgical navigation process, thereby decreasing the risk and possibly reducing patient exposure to X-rays and contrast agent. However, the creation of an accurate patient specific 3D model is difficult and time consuming, and aligning it with the interventional images is a challenging correspondence problem. These issues were important factors in our decision to undertake this research. Other vascular conditions bring different but related challenges. Specifically, we also address the problem of surgical guidance during the treatment of chronic total occlusions (CTO) of the.
(42) 12. Figure 0.6. The coronary arteries. As presented by Gray (1918) (left and middle), and a top view of the volume rendering of a CTA scan.. coronary arteries. CTO is the result of a severe accumulation of plaque in the coronary arteries (see Figure 0.6), and are characterized by very low perfusion level over a period longer than three months (Gade and Wong, 2006). This type of lesion is encountered in 15% to 30% of the patients referred for coronary angiography and the presence of CTO is the most powerful predictor of referral for coronary bypass surgery (Grantham et al., 2009). CTO has been referred to as the final frontier in interventional cardiology (Stone et al., 2005). The treatment of CTO generally involves minimally invasive (laparoscopic) percutaneous coronary intervention (PCI). Compared to MAPCAs interventions, although the clinical context is very different, there are many similarities to be found at the image processing level. X-ray fluoroscopy with direct contrast injection is the modality of choice for the guidance of percutaneous coronary interventions. This modality has two major drawbacks: the limited depth perception inherent in 2D images, and the fact that the contrast agent is quickly washed away by the circulating blood. Furthermore, some parts of the coronary arteries are almost totally blocked in CTO. As a results, the contrast agent cannot reach the distal segments of the vessel, making them almost invisible on interventional imagery, as illustrated in Figure 0.7. This situation makes the surgical procedure particularly hazardous, because the practitioner has to guess the position and shape of the arteries, and move the catheter along with great care, so as not to perforate the vessel. In contrast to X-ray fluoroscopy with direct contrast agent injection, CTA with intravenous contrast injection has different imaging characteristics, and it is often possible to segment the coronary arteries on the 3D scan. Providing precise geometric information can help the physician to make a more accurate diagnosis and prepare a better surgical plan. The extracted model can also serve as a reference during the intervention. However, aligning the artery model with.
Figure

+7

Documents relatifs
(espace urbain) - Amorce d’une campagne comme cadre de vie (affirmation de la fonction résidentielle, diversification de l’économie rurale) - Développement local - Début
Incurables, la maladie, les douleurs omniprésentes, dans leur constance, semblent tenir en quelque sorte, lieu d’existence : « C’est très dur de devoir demander de l’aide pour
We first give a sur- vey on recent developments on the distribution of symbols in polynomial subsequences of the Thue–Morse sequence t = (t(n)) n≥0 by highlighting..
Tali Justine Harris Jan Lobelle Martin O'Hara Gillian Rejskind Hermione Shantz Wayne Hall John Lipkin and Norman Henchey 'M artha Tetreault. The McGiII Journal of
We have shown the benefits of computing joint registrations compared to one-to-one registrations. This brings robustness in the case of heterogeneous medical datasets which may
The deformation fields resulting from the registration between the masks manually segmented used for the Lagrangian approach were used in order to perform a reference frame shift
To highlight the advantage of using both visual feature types, we compare the estimation of the poses of the near-infrared and the polarization cameras using the proposed
Discrete optimization of Markov Random Fields (MRFs) has been widely used to solve the problem of non-rigid image registration in recent years [6, 7].. However, to the best of
