Pauline Suffice 1
Université du Québec en Abitibi Témiscamingue 2
445, boulevard de l'Université 3
Rouyn-Noranda (Québec) J9X 5E4 4 (819) 860-3346 5 pauline.suffice@uqat.ca 6 7
RH: Suffice et al. · Fisher and American Marten Quebec 8
9
Habitat, Climate, and Fisher and Marten Distributions 10
11
PAULINE SUFFICE,1 Université du Québec en Abitibi-Témiscamingue, 445 boulevard 12
de l'Université, Rouyn-Noranda, Québec J9X 5E4, Canada
13
MARIANNE CHEVEAU, Ministère des Forêts, de la Faune et des Parcs, Gouvernement 14
du Québec, Direction générale de la gestion de la faune et des habitats, 880,
15
chemin Sainte-Foy, 2e étage, Québec, Québec G1S 4X4, Canada
16
LOUIS IMBEAU, Université du Québec en Abitibi-Témiscamingue, 445 boulevard de 17
l'Université, Rouyn-Noranda, Québec J9X 5E4, Canada
18
MARC J. MAZEROLLE, Centre d’étude de la forêt, Département des sciences du bois et 19
de la forêt, Pavillon Abitibi-Price, 2405 rue de la Terrasse, Université Laval,
20
Québec, Québec G1V 0A6, Canada
21
HUGO ASSELIN, Université du Québec en Abitibi-Témiscamingue, 445 boulevard de 22
l'Université, Rouyn-Noranda, Québec J9X 5E4, Canada
23
PIERRE DRAPEAU, Université du Québec à Montréal, Département des sciences 24
biologiques, 141, Avenue du Président-Kennedy, Montréal, Québec H2X 1Y4,
25 Canada 26 27 1 Email : pauline.suffice@uqat.ca
ABSTRACT Since the mid-twentieth century, fisher populations (Pekania pennanti) 28
increased in several eastern jurisdictions of North America, particularly in the northern 29
part of the species’ range. Changes in fisher distribution have led to increased overlap 30
with the southern portion of the range of American marten (Martes americana), whose 31
populations may be locally declining. This overlap occurs particularly in habitats 32
undergoing natural and anthropogenic modification. The objective of our study was to 33
determine the respective effects of habitat changes and climatic conditions on fisher and 34
marten populations in Quebec, Canada, based on trapper knowledge. We analyzed annual 35
fisher and marten harvest (number of pelts sold/100 km2) between the 1984–1985 and 36
2014–2015 trapping seasons using linear mixed models. Fisher harvest increased with the 37
increased abundance of mixed forests >12 m tall, resulting from decades of forest 38
harvesting. Fisher harvest decreased with increasing spring rains, which can affect 39
survival when rearing young. Marten harvest decreased with increasing winter rains, 40
which lower thermoregulation capacity and hamper movements by creating an ice crust 41
on the snowpack, reducing access to subnivean areas. Decline in marten harvest during 42
the 30-year study period coincided with an increase in fisher harvest, suggesting possible 43
interspecific competition. Results highlight that managers should strive to maintain 44
mixedwood stands taller than 12 m to maintain high quality habitat for fishers. Our study 45
confirms the importance of working with trappers to assess furbearing population trends 46
in response to habitat changes and climatic conditions. 47
48
KEY WORDS American marten, fisher, forest harvesting, furbearer management, 49
mixedwood forest, mustelids, pelt sales, rain. 50
51
Unregulated harvest and habitat loss led to declines in populations of several forest 52
carnivores in North America (Tapper and Reynolds 1996, Krohn 2012). Fisher (Pekania 53
pennanti) and American marten (Martes americana) are 2 North American mustelids
54
whose populations decreased because of overexploitation for fur and loss of habitat due 55
to timber harvesting (Powell et al. 2003, Williams et al. 2007). After a decline during the 56
mid-nineteenth century, fisher populations have rebounded since the mid-twentieth 57
century in the eastern portion of the species’ range, particularly in the northeastern United 58
States, and in the Canadian provinces of Ontario and Quebec (Bowman et al. 2006, 59
Lancaster et al. 2008, Krohn 2012, Lewis et al. 2012, LaPoint et al. 2015). Fisher 60
recovery is due to translocation efforts, natural recolonization (Carr et al. 2007a, Stewart 61
et al. 2017), habitat modification, and beneficial effects from climate change (Lancaster 62
et al. 2008). In some cases, fisher re-establishment could result in declines in marten 63
populations due to interspecific competition (Krohn et al. 1997, Fisher et al. 2013, 64
Manlick et al. 2017). Because of its larger size, fisher is a dominant competitor of marten 65
(Krohn et al. 1997). Interference competition from fishers could have forced martens to 66
leave shared territories (Tannerfeldt et al. 2002). Marten populations, however, appear to 67
be recovering in several parts of eastern North America shared with fisher (Aylward et al. 68
2018) but not in Quebec. Fisher harvest in Quebec is generally increasing, whereas that 69
of martens is decreasing (Poulin et al. 2006, Suffice et al. 2017, Lavoie et al. 2019). 70
According to Poulin et al. (2006), increased fisher harvesting in Quebec is more strongly 71
associated with population increases than with increased trapping pressure. 72
Anthropogenic disturbance and climatic conditions can upset established 73
equilibria and induce changes in habitat use by species (Graham and Grimm 1990, Lodge 74
1993). North American forests have been affected by human activities over recent 75
decades (e.g., agricultural intensification, urbanization, forest logging; Reif 2013, Bridger 76
et al. 2017). Forest logging differs from natural disturbances in terms of frequency, 77
intensity, and spatial extent. It has resulted in younger, more fragmented forests with 78
different tree species composition (Schulte et al. 2007, Boucher et al. 2014, Grondin et al. 79
2018). This in turn increased the number of wildlife species requiring early successional 80
habitat but reduced the number of species requiring mature contiguous forest (Drapeau et 81
al. 2000, Plante et al. 2018). Such modifications in the structure and composition of forest 82
landscapes have a direct effect on habitat availability for mustelids (Buskirk 1992, Payer 83
and Harrison 2005, Spencer et al. 2015). 84
At the population level, fishers are associated with dense forests and high, closed 85
canopies used as resting sites (Buskirk 1992, Powell and Zielinski 1994, Potvin et al. 86
2000, Powell et al. 2003). Large-diameter trees often provide cavities used as refuges by 87
fishers, whereas conifers intercept snow, reducing accumulation on the ground and 88
facilitating fisher movement (Powell et al. 2003). The absence of important predators in 89
northern portions of the fisher’s range could explain the use of more open land cover 90
types than elsewhere in its distribution (Wengert et al. 2014), particularly along forest 91
edges adjacent to agricultural fields and in younger forests (Suffice et al. 2017). Fishers 92
also find important food sources in such cover types: snowshoe hare (Lepus americanus) 93
and cervid carcasses (Potvin et al. 2005). In contrast, martens are more dependent upon 94
protective cover from predation and inclement weather (Powell et al. 2003). 95
Consequently, martens occupy mature forests with dense cover and complex structure 96
close to ground level, where they hunt for small mammals (Buskirk and Ruggiero 1994, 97
Bissonette et al. 1997, Chapin et al. 1998, Potvin et al. 2000, Fuller et al. 2005). Recovery 98
of marten populations in the northeastern United States coincides with the re-99
establishment of older, larger forest patches (Aylward et al. 2018). The association 100
between marten and old, dense coniferous stands, however, is not exclusive (Cheveau et 101
al. 2013). For example, snowshoe hares, which are more important prey for marten in the 102
eastern than in the western portion of its range, are associated with early successional 103
hardwood stands (Potvin et al. 2000). 104
Altered snow conditions in recent years have also directly affected the northern 105
distribution of mesocarnivores (including fisher and marten) with differing effects 106
depending upon species (Pozzanghera et al. 2016). The energy expenditure associated 107
with animal movement through snow varies according to snow depth and the lift it 108
provides, together with the speed of the individual’s movements (Crête and Larivière 109
2003). Snow conditions particularly affect fisher dispersal (Raine 1983, Krohn et al. 110
2005, Carr et al. 2007b, Garroway et al. 2011, Bertrand et al. 2017) because they are 111
larger and heavier than martens and exert greater foot loading (18.2–32.0 g/cm2 vs. 9.1– 112
12.2 g/cm2). Compared to martens, movements of fishers tend to be more strongly 113
constrained by deep, uncompacted snow (Kilpatrick and Rego 1994, Krohn et al. 2005). 114
Presence of an ice crust resulting from freeze-thaw events increases snow lift, which can 115
facilitate fisher movements (Suffice et al. 2017). Conversely, the ice crust limits 116
subnivean access (Berteaux et al. 2017), which is the principal medium through which 117
martens move (Raine 1987, Sherburne and Bissonette 1994, Krohn et al. 2005). Climate 118
change could simultaneously be a challenge to marten populations at the southern edge of 119
the species’ distribution (Lavoie et al. 2019), and benefit fisher at the northern edge of its 120
distribution (Manlick et al. 2017). Understanding the influences on wildlife distribution is 121
important to decipher the role of human activities and establish best practices for timber 122
and wildlife management considering climate change. 123
In a previous study documenting the knowledge of Quebec trappers about fisher 124
and marten habitat use (Suffice et al. 2017), lack of exclusivity of both species to 125
coniferous forests was highlighted, although marten was more closely associated with 126
coniferous forests than fisher. Fisher apparently also uses open environments, including 127
agricultural fields and younger forests. Moreover, climate change increases the frequency 128
of freeze-thaw events that cause the formation of an ice crust on snow surface, favoring 129
fisher movements and accessibility to new territories. According to trappers, fisher is less 130
affected by forest management than marten, and the species also seems to benefit to a 131
greater extent from the effects of climate change. The increase in winter rainfall 132
frequency and forest cover changes have been identified by trappers as the major factors 133
that may explain changes in fisher and marten abundance (Suffice et al. 2017). Our 134
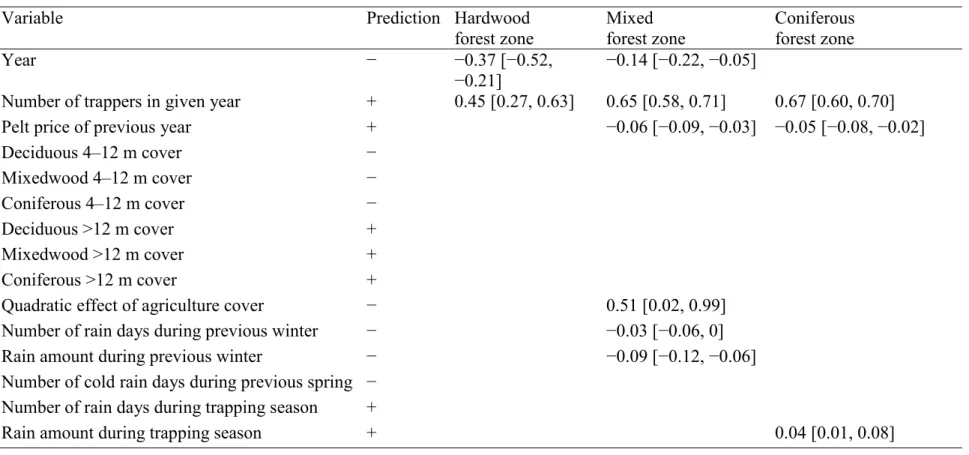
objective was to quantify the respective effects of habitat change and climatic conditions 135
on the numbers of fishers and martens trapped in Quebec between the 1984–1985 and 136
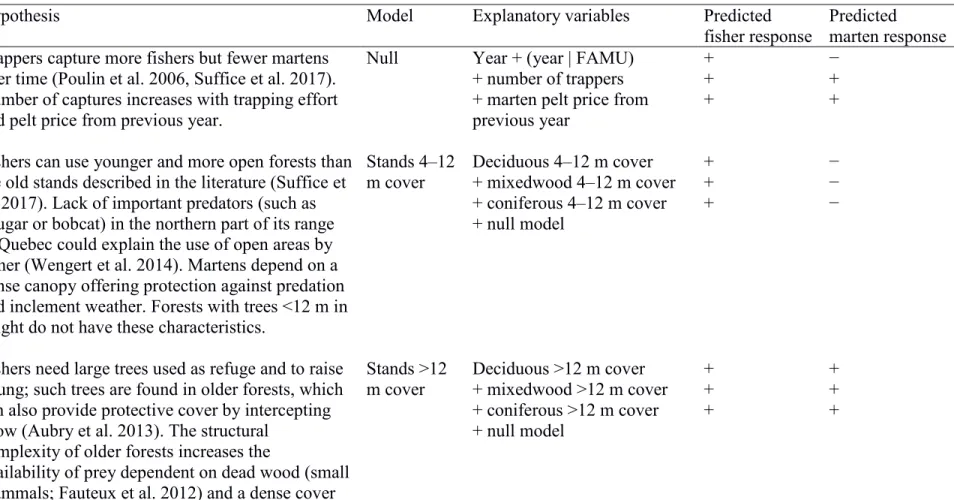
2014–2015 trapping seasons. We tested hypotheses developed using a combination of 137
local knowledge from trappers and a literature review (Table 1). We predicted that fisher 138
and marten would be more abundant in forests with complex internal structure, regardless 139
of the canopy dominance. We predicted that fisher would use more open stands and 140
agricultural fields than marten. We predicted that rainfall on snow would promote fisher 141
movement and survival but reduce marten survival. 142
STUDY AREA 143
The province of Quebec is divided into 96 fur-bearing animal management units 144
(FAMUs; Fig. 1). Our analysis included 71 FAMUs, ranging in size from 169 km2 to 145
23,820 km2, representing 346,750 km2 from 1984 to 2015. We excluded territories above 146
51o N, which have not been extensively exploited for fur, and Anticosti Island, where 147
fishers and martens are absent. We also had to remove FAMUs corresponding to beaver 148
(Castor canadensis) reserves where furbearer exploitation is exclusive to Indigenous 149
people and where data on the number of annual trappers are not recorded. 150
Tree species included maple (Acer spp.), birch (Betula spp.), poplar (Populus 151
spp.), balsam fir (Abies balsamea), pine (Pinus spp.), and spruce (Picea spp.). We 152
divided FAMUs into 3 zones that differed in logging intensity. First, the southernmost 153
zone included areas in the sugar maple (Acer saccharum)‒bitternut hickory (Carya 154
cordiformis) and sugar maple‒basswood (Tilia americana) bioclimatic domains
155
(hardwood forests, 11 FAMUs). These forests were mostly on private land and had been 156
relatively untouched by timber exploitation compared to those in the other zones. Second, 157
the intermediate zone included areas in the sugar maple‒yellow birch (Betula 158
alleghaniensis) and balsam fir‒yellow birch domains (mostly mixed forests, 35 FAMUs),
159
which have been mainly managed through partial cuts. Third, the northernmost zone 160
included areas in the balsam fir‒paper birch (Betula papyrifera) and black spruce (Picea 161
mariana)‒feather moss domains (mostly coniferous forests, 25 FAMUs), mainly
162
managed with clearcuts. 163
Land use in the study area consisted mainly of forest harvesting and agriculture, 164
and to a lesser degree, urban development. The study area was flat (mostly within 500 m 165
above sea level) except for a few mountainous areas with the highest peak reaching 1,181 166
m above sea level. The study area had a cold and wet continental climate. On average, 167
temperature remained near or below the freezing point from November to March, but 168
typically exceeded 10° C from June to September (climate normals 1981–2010, 169
Gouvernement du Québec 2019). Annual precipitation averaged 1,000 mm, of which 170
about 75% fell as rain. Average monthly precipitation was >55 mm. The annual snowfall 171
averaged 275 cm. Snowfall started as early as October, but snow did not significantly 172
accumulate on the ground until November. Snowfall usually ended in April, occasionally 173
in May. 174
In Québec, fisher and marten can hunt American red squirrel (Tamiasciurus 175
hudsonicus), northern flying squirrel (Glaucomys sabrinus), striped chipmunk (Tamias
176
striatus), snowshoe hare, and gallinaceous birds, including ruffed grouse (Bonasa
177
umbellus) and spruce grouse (Falcipennis canadensis), especially in winter. Other dietary
178
components include carcasses of white-tailed deer (Odocoileus virginianus), North 179
American moose (Alces americanus), and North American beaver. Fisher can hunt 180
larger-sized preys such as muskrat (Ondatra zibethicus), woodchuck (Marmota monax), 181
striped skunk (Mephitis mephitis), and North American porcupine (Erethizon dorsatum). 182
Fisher and marten can also eat wild fruit such as red raspberries (Rubus idaeus) and nuts 183
such as beaked hazelnut (Corylus cornuta). The main predators of marten and fisher are 184
raptors, mostly owls (e.g., great horned owl [Bubo virginianus]), eagles (bald eagle 185
[Haliaeetus leucocephalus], golden eagle [Aquila chrysaetos]), falcons, hawks, and 186
terrestrial large predators, mostly grey wolf (Canis lupus), coyote (Canis latrans), red fox 187
(Vulpes vulpes), and Canada lynx (Lynx canadensis). Bobcat (Lynx rufus) and cougar 188
(Puma concolor) are rare or absent in Québec. 189
METHODS 190
Pelt Sales Data 191
The Quebec Ministry of Forests, Wildlife and Parks (MFFP; Ministère des Forêts, de la 192
Faune et des Parcs) recorded the number of pelts sold in each of the FAMUs since the 193
1984–1985 trapping season (Oct–Mar). Trappers capture martens and fishers using the 194
same devices (i.e., body gripping traps set on a live tree or on a pole; Gouvernement du
195
Québec, and Fédération des trappeurs gestionnaires du Québec 2019). The length of the
196
trapping season remained constant over the study (i.e., Oct–Mar). To account for 197
variation in area among FAMUs, we calculated pelt yield (number of pelts sold/100 198
km2)/FAMU/year. Part of the harvest is not traded as raw pelts and can be tanned and 199
processed for crafts. Despite some limitations, we consider that pelt sales data are a 200
reasonable index of harvestthat can be used to assess temporal changes in populations of 201
low-density species such as mustelids (Gese 2001, Kawaguchi et al. 2015). 202
All pelt sales in Quebec are supposed to be recorded in a provincial register, 203
including trapping season, FAMU, and trapper certificate number. Interviews with 204
trappers, however, revealed that only part of the harvest is recorded (Suffice et al. 2017). 205
As a result, we treated the number of pelts sold adjusted for trapping effort as an index of 206
population size. We used 2 variables to account for potential variations in trapping effort: 207
the number of trappers that sold ≥1 marten or 1 fisher pelt in a given FAMU in a given 208
year, and the average auction price of a marten pelt in the previous year. 209
Habitat and Climate Data 210
Between 1984 and 2015, the forests of Quebec were subjected to 3 governmental decadal 211
inventories during 1979–1990 (Ministère de l’Énergie et des Ressources du Québec 212
1984), 1990–2002 (Létourneau et al. 2009), and 2002–2018 (Lemieux et al. 2015). The 213
governmental forest mapping is produced at the stand scale by interpretation of aerial 214
photographs. These inventories make it possible to follow major trends in forest structure 215
and composition. We used maps from the SIFORT (Système d’Information Forestière par 216
Tesselle) database (Pelletier et al. 2007), composed of 14-ha polygons that are each 217
assigned the stand characteristics of the eco-forest map polygon found at its center. It 218
takes approximately 10 years to inventory the entire forest territory of Quebec. Thus, all 219
FAMUs are not inventoried the same year. We matched pelt sales data from each 220
trapping season (1984–2015) in each FAMU with the trends in forest structure and 221
composition that were nearest in time and that covered the largest area of each FAMU. 222
For each FAMU, we calculated the area that was covered by forest and by 223
agriculture as a percentage of area. We grouped forest stands into 6 major forest cover 224
types by combining 2 criteria considered important for mustelids: structure as described 225
from height classes (4–12 m, >12 m) and tree species composition (deciduous, mixed, 226
coniferous; Potvin et al. 2000, Purcell et al. 2012, Cheveau et al. 2013). We considered 227
stands that were 4–12m in height to be young forests. Stands taller than 12 m generally 228
consist of mature and old-growth forests with large-diameter trees, together with 229
moribund and dead trees (snags; downed dead wood), which provide diversity in 230
structures used by fisher and marten. Yet presence of trees taller than 12 m does not 231
necessarily mean that a stand should be considered mature.Relative contributions of 232
young, mature and old forests in the >12 m height class depend on bioclimatic domain 233
and on the dynamics of natural and anthropogenic disturbances. In the hardwood forest 234
zone, very few intact old-growth forests remain (Angers et al. 2005), given that these 235
areas have experienced anthropogenic disturbances such as conversion of forests to 236
agricultural use (Jobin et al. 2003, Domon and Bouchard 2007) or urban development 237
(Domon et al. 2000). Stands taller than 12 m are more likely to consist of relatively 238
young forests that have only recently reached 12 m, or mature forests that have been 239
disturbed by low-intensity logging or sugar maple syrup production in the past. The 240
mixed forest zone marks the transition between temperate and boreal forests, where 241
stands are mainly harvested by partial cuts. In the coniferous forest zone, prior to the 242
recent deployment of commercial forestry, landscapes were dominated by forests >100 243
years old (Bergeron et al. 2006). Consequently, stands that are taller than 12 m in this 244
zone are mainly mature and old growth. 245
We mapped changes in forest composition and the area of land under agriculture 246
in each FAMU by computing the difference in area of a given cover type between the 247
forest inventories of the 1980s and 2010s. We designated forest stands 4–12 m tall as 248
being either dominated by deciduous (deciduous 4–12 m), mixedwood (mixedwood 4–12 249
m), or coniferous (coniferous 4–12 m) species. We gave similar designations to stands 250
>12 m tall (deciduous >12 m, mixedwood >12 m, coniferous >12 m). 251
We summarized rainfall abundance to evaluate the potential for ice crust 252
formation on the snow surface. We obtained daily meteorological data with BioSIM 253
11.4.6.0 (Régnière and St-Amant 2007, Régnière et al. 2017). The software interpolates 254
regional temperature and precipitation data for a given location from nearby weather 255
stations, adjusted for differences in elevation, latitude, and longitude using regional 256
gradients. We extracted the data from BioSIM corresponding to the distance-weighted 257
average of the 3 weather stations that were closest to the centroid of each FAMU. We 258
then compiled the data to obtain the sum of rainfall (mm) and the number of days with 259
rainfall for the trapping season (15 Nov–1 Mar); the winter preceding the trapping season 260
(15 Nov–30 Apr), to test for the delayed effect (1-yr lag) of rain on adult survival and 261
reproduction; and the period of cold spring rainfall during the first few weeks of life of 262
young mustelids (15 Mar–30 May, before the trapping season; Macdonald and Newman 263
2002). We calculated cold spring rain based on the number of days when rainfall was 264
greater than the third quartile of the distribution for daily rainfall data (>1.7 mm), and 265
when the minimum temperature was less than the third quartile of the distribution for 266
daily minimum temperature data (<2.2 °C). We used the same spring period for both 267
species, considering that female fishers and martens give birth in late March or April 268
(Powell et al. 2003). For descriptive purposes, we modeled temporal variation in climatic 269
variables by linear regressions with year as an explanatory variable at the level of each 270
FAMU. We then mapped the estimate of the regression slope of each FAMU to illustrate 271
variations of the climatic variables across years. 272
Statistical Analyses 273
We applied a logarithmic transformation to homogenize the variance of fisher and marten 274
yield data (number of pelts sold/100 km2). We analyzed changes in yield/FAMU/year 275
using linear mixed models in the nlme package of R 3.4.2 (Pinheiro et al. 2018). We 276
included a random intercept and random year slope for each FAMU in the models. We 277
included the 2 variables in each model to reflect variations in trapping effort: the number 278
of trappers that traded ≥1 marten or fisher pelt in a given year and the average auction 279
price of a marten pelt in the previous year. All models included a continuous first-order 280
autocorrelation structure (CAR1; Pinheiro and Bates 2000) between consecutive 281
observations from a given FAMU to account for the time series structure of the data. We 282
formulated 7 candidate models based on hypotheses derived from interviews with local 283
trappers and from a literature review (Table 1). These hypotheses involved the effects of 284
rain on mustelid mobility and young survival, the importance of forest age and dominant 285
cover type, and the effect of open areas. We added 9 models combining different 286
uncorrelated variables (|r| < 0.7) in the analyses: stands 4–12 m and rain conditions (3 287
models), stands taller than 12 m and rain conditions (3 models), and agricultural fields 288
and rain conditions (3 models), resulting in 16 candidate models. We standardized all 289
numeric variables prior to analysis. 290
We conducted independent analyses for the 3 geographical zones under study. We 291
estimated parameters by maximum likelihood. We used model selection based on the 292
Akaike’s Information Criterion for small samples (AICc) to identify the top models
293
(ΔAICc < 4) associated with our biological hypotheses (Table 1). We quantified the effect
294
of variables appearing in the top models with multi-model inference using the shrinkage 295
estimator (AICcmodavg package; Burnham and Anderson 2002, Mazerolle 2017). We 296
model-averaged coefficients and predictions across all models. 297
RESULTS 298
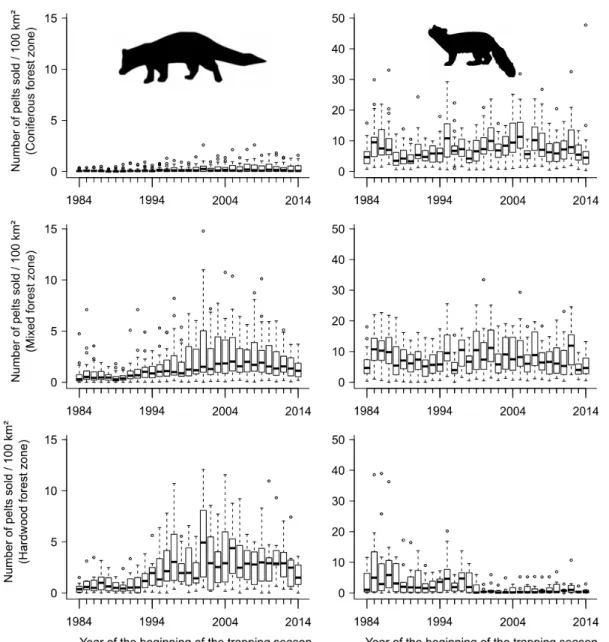
During 1984–2015, annual fisher yield averaged 2.31 ± 2.38 (SD) individuals/100 km2 in 299
the hardwood forest zone, 1.64 ± 1.78 individuals/100 km2 in the mixed forest zone, and 300
0.21 ± 0.35 individuals/100 km2 in the coniferous forest zone (Fig. 2). During the same 301
period, mean annual marten yield was 2.86 ± 5.24 individuals/100 km in the hardwood 302
forest zone, 7.97 ±5.50 individuals/100 km2 in the mixed forest zone, and 7.57 ± 5.37 303
individuals/100 km2 in the coniferous forest zone. 304
Habitat and Rain Changes 305
Habitat proportions by FAMU were characteristic of each of the 3 zones (Fig. S1, 306
available online in Supporting Information). The cover of agricultural fields changed very 307
little within FAMUs ( average percent change between the first and the third forest 308
governmental decadal inventories for FAMU area [range of percentage change] = -309
0.72 % [-5.41%– 1.27%]; Fig. S2, available online in Supporting Information). 310
Similarly, there were few variations within FAMUs in terms of deciduous stand cover for 311
each height class: 4–12 m =-0.98% (-9.42%– 5.34%) and >12 m =-0.95% (-10.13%– 312
5.57%; Fig. S3, available online in Supporting Information). In contrast, the area of 313
mixedwood stands generally increased for both height classes: 3.08% for 4–12 m (-314
10.41% – 36.19%) and 3.18% for >12 m (-10.58% – 11.84%). The area of coniferous 315
stands >12 m mainly decreased (-1.44% [-14.19%– 13.92%]), whereas those in the 4–12-316
m height class remained relatively stable (0.66% [-9.57%– 10.75%]), although there 317
were increases in the northernmost FAMUs. Changes in forest composition and area 318
under agriculture varied across FAMUs, especially in the coniferous forest zone where 319
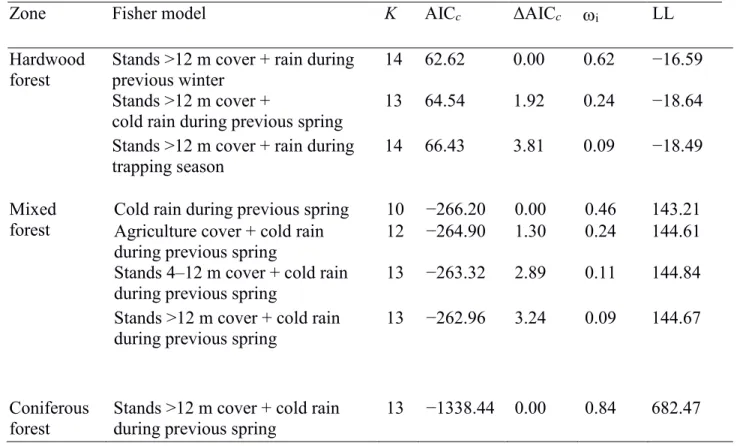
mean forest age decreased. The proportion of mature forest was higher in the hardwood 320
forest zone. Stand area in the 4–12-m height class declined (Fig. S3), whereas the area of 321
stands >12 m increased (Fig. S4, available online in Supporting Information). 322
Number of days with rain and amount of rain that fell during the 3 periods showed 323
inter-annual variations of different amplitudes among zones (Figs. S5, S6, available 324
online in Supporting Information). Variation of rain conditions between 1984 and 2015 325
also varied among FAMUs (Figs. S7, S8, available online in Supporting Information). 326
Over the study period, the number of days with rain during winter increased in the 327
northern and western parts of the study area, whereas it decreased in the southeast. 328
Rainfall increased in most areas, suggesting an increase in days with heavy rains. The 329
number of days with cold rain (>1.7 mm; min. temp <2.2° C) increased only in a few 330
areas. 331
Fisher Yield 332
Models that included rainfall during the previous winter or cold rain during the previous 333
spring had the most support (0.46 < Akaike weight [ωi] < 0.62) for all 3 zones (Appendix 334
A). Models that combined the availability of stands >12m, with rain during the previous 335
winter (ωi = 0.62), cold rain during the previous spring (ωi = 0.24), or rain during the 336
trapping season (ωi = 0.09) were the most parsimonious for the hardwood forest zone. 337
For the mixed forest zone, the model with only cold rain during the previous spring had 338
twice the weight of the model including cold rain during the previous spring and the 339
cover of agricultural fields (ωi = 0.46 vs. ωi = 0.24), and 4 times the weight of models 340
including the availability of stands 4–12m (ωi = 0.11) or >12m (ωi = 0.09). The model 341
that combined the availability of stands >12m, with cold rain during the previous spring 342
had 84% of the weight for the coniferous forest zone (ωi = 0.84). All other models had 343
much less support (ΔAICc > 4).
344
Annual fisher yield increased over time in all 3 zones but more so in the mixed 345
forest zone (Table 2; Fig. 3). Annual fisher yield in all 3 zones increased with the number 346
of trappers having sold ≥1 marten or fisher pelt, but the effect was stronger in the 347
hardwood forest zone. Annual fisher yield in all 3 zones decreased with the average 348
selling price of a marten pelt at the auction from the previous year, but the effect was 349
weak. Annual fisher yield in the hardwood and coniferous forest zones increased with the 350
area covered by mixedwood stands >12 m (Fig. 4), but there was no similar relationship 351
in the mixed forest zone. Fisher yield in the hardwood and coniferous forest zones 352
decreased despite increases in the area covered by deciduous stands >12 m. Within mixed 353
and coniferous zones, fisher yield decreased with increases in the number of cold days 354
with rain during the spring preceding the trapping season, but these relationships were 355
weak (Table 2). 356
Marten Yield 357
In the hardwood forest zone, the null model had the greatest weight to explain variation 358
in marten yield (Appendix B; ωi = 0.25). Models that included cold rain during the spring 359
preceding the trapping season (ωi = 0.19), the availability of stands 4–12m (ωi = 0.16), or 360
both (ωi = 0.10)shared the majority of the rest of the weight. Models that included the 361
availability of stands >12m (ωi = 0.05), the amount of agricultural fields (ωi = 0.04), or 362
rain during the previous winter (ωi = 0.04) had weak support. In the mixed forest zone, 363
the model consisting of the amount of agricultural fields and rain during the previous 364
winter had the entire support (ωi = 1). In the coniferous forest zone, the top-ranked model 365
included the availability of stands 4–12 m and rain during the trapping season (Appendix 366
B). This model had 3 times the weight of the second-ranked model (0.57 vs. 0.13), which 367
consisted of the rain during the trapping season. A third model consisting of the amount 368
of agricultural fields and rain during the trapping season had 12% of the support. Marten 369
yield decreased over time in the hardwood forest and mixed forest zones (Table 3), yet no 370
such relationship was in the coniferous forest zone. Annual marten yield in all 3 zones 371
increased with the number of trappers having sold ≥1 marten or fisher pelt, but the effect 372
was stronger in the mixed and coniferous forest zones (Table 3). 373
Annual marten yield in the mixed and coniferous zones decreased with the 374
average selling price of a marten pelt at the auction from the preceding year (Table 3). 375
The price of a marten pelt had a greater effect on annual marten yield than on annual 376
fisher yield, but the effect was weak in both cases. No habitat variable (forest cover or 377
agricultural cover) explained changes in marten yield in the hardwood forest and 378
coniferous forest zones. In the mixed forest zone, marten yields decreased with increasing 379
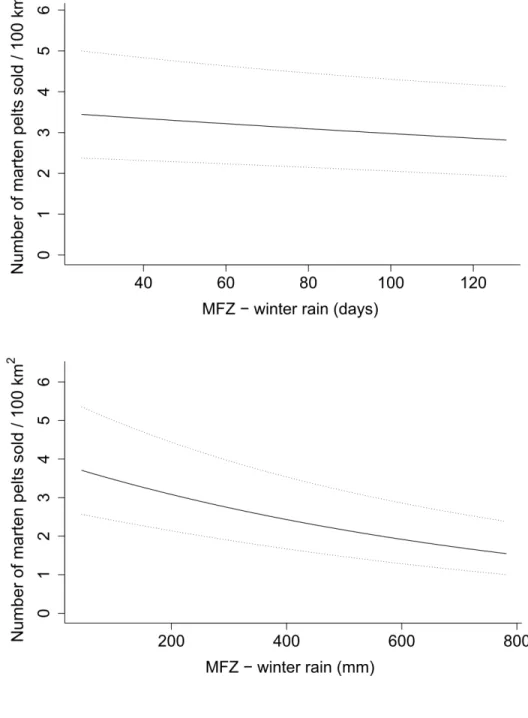
cover of agricultural fields (Fig. 5). Marten yield decreased with the number of days with
380
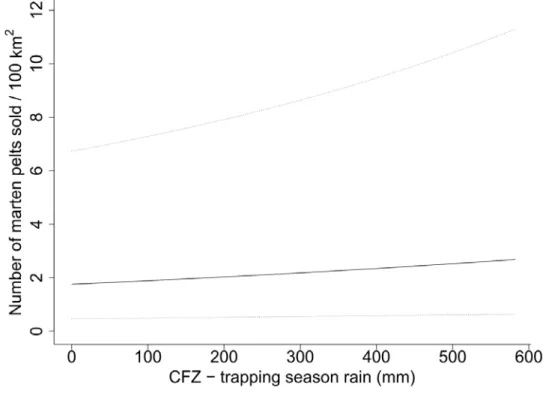
rain and the amount of rainfall in the winter preceding the trapping season in the mixed 381
forest zone (Fig. 6). In the coniferous forest zone, marten yield increased with the amount 382
of rainfall during the trapping season (Fig. 7). 383
DISCUSSION 384
Habitat Changes 385
Fisher.—Fisher yield increased in all 3 zones, but more strongly in the hardwood
386
forest and mixed forest zones. Although still low, fisher yield increased in the coniferous 387
forest zone, where the species is at the northern edge of its range and densities are 388
inherently low. The abundance of mixedwood stands >12 m increased fisher yields in 389
both hardwood and coniferous forest zones. Deciduous stands >12 m were not a good 390
indicator of fisher populations at the landscape scale. According to other studies, the 391
coniferous component of stands appears to be particularly important for fishers in Quebec 392
(Proulx 2006, Sauder and Rachlow 2014, Fuller et al. 2016). Kelly (1977) determined 393
that fishers avoid forest stands that are composed of ≥74% deciduous trees. Deciduous-394
dominated stands probably do not provide fishers with optimal conditions for winter 395
movement. Because of their crown form, boreal softwood species provide cover that 396
protects fishers by intercepting precipitation, including snow. In winter, fishers 397
preferentially use dense stands with a large conifer component (mixed or dominant), 398
given lower accumulations of snow on the ground, thereby facilitating movements (Raine 399
1983, Hopkinson et al. 2004). Within a forest matrix dominated by deciduous tree 400
species, the coniferous component becomes particularly attractive for fisher movement. 401
In the mixed forest zone, no habitat variable could explain increases in fisher yields, yet 402
the habitat appears to remain adequate for the needs of fisher populations. 403
In the coniferous forest zone, the increase in fisher yield was associated with 404
mixedwood stands >12 m, which have increased in proportion over the past 30 years. On 405
the one hand, a mixed species composition provides the best compromise for fisher in 406
terms of structures that can intercept snow while providing a variety of prey (Powell et al. 407
2003). On the other hand, in the coniferous forest zone, the amount of deciduous stands 408
>12 m reduces fisher yields. These forest stands have little or no structure to intercept 409
snow. Logging intensity in the coniferous forest zone favored early successional species, 410
such as trembling aspen (Populus tremuloides), at the expense of conifers that dominated 411
the canopy in pre-industrial times (Boucher et al. 2014, Grondin et al. 2018). 412
Modifications of the cover type and their associations with fisher captures support 413
the hypotheses based on trapper knowledge (Table 1). Indeed, trappers have reported that 414
fishers in Quebec use forests where the deciduous component has increased (Suffice et al. 415
2017). Fishers especially use forests with complex structures, both vertically (several 416
layers of vegetation) and horizontally (downed woody debris; Powell and Zielinski 417
1994). The deciduous component provides fishers with a diversity of structure and an 418
abundance of prey species (Poulin et al. 2006). Studies in eastern Maine and Connecticut, 419
USA, reported that fishers live in mixedwood and deciduous stands (Arthur et al. 1989, 420
Kilpatrick and Rego 1994). Trappers in our study area shared their concerns about the 421
availability of large hollow trees in which the fisher could find refuge and raise their 422
young (Suffice et al. 2017). Indeed, fishers typically use resting sites in large living trees 423
with cavities or broken tops, or in large dead trees (Gess et al. 2013, Green 2017). The 424
size of the trees that can be used as resting sites varies according to bioclimatic zone and 425
tree species available (Weir and Almuedo 2010, Aubry et al. 2013). In the eastern portion 426
of its range, fishers mainly use deciduous trees with an average diameter at breast height 427
>50 cm (Erb et al. 2013, Gess et al. 2013). In northern Quebec, trees >30 cm in diameter 428
are rare (Vaillancourt et al. 2008), yet fisher populations have increased in the coniferous 429
forest zone (spruce-moss bioclimatic domain). As in other regions, fishers in Quebec may 430
use ground-level dens more than large-diameter trees (Kilpatrick and Rego 1994, Gess et 431
al. 2013, Green 2017). 432
In interviews conducted by Suffice et al. (2017), trappers noted that they were 433
capturing greater numbers of fishers at farmland edges and that the animals could use 434
relatively open landscapes. Our analyses could not confirm these observations by trappers 435
made at a finer spatial scale. The quantity of agricultural fields in Quebec varied little 436
between 1984 and 2015. Furthermore, the amount of land under agriculture likely does 437
not reflect the quantity of edge between agricultural fields and forest stands used by 438
fishers (Bridger et al. 2017). 439
Marten.—No habitat variable explained the decrease in marten yields in the
440
hardwood forest and mixed forest zones, where stands have increased both in area and 441
height. We found no change in marten yield over time in the coniferous forest zone. In 442
addition, changes in forest cover across Quebec did not influence marten populations, yet 443
martens have been reported to occupy mature forest stands with dense cover and complex 444
structure (Buskirk and Ruggiero 1994, Bissonette et al. 1997, Chapin et al. 1998, Potvin 445
et al. 2000, Fuller et al. 2005). Indeed, Cheveau et al. (2013) reported that in a 446
predominantly coniferous (spruce) landscape, mixedwood stands were selected at home 447
range and landscape scales. Trappers mentioned that they often capture marten in 448
deciduous stands (Suffice et al. 2017). In conifer-dominated landscapes, martens seek out 449
a diversity of habitat attributes to find food and protection. The quantity of coniferous 450
stands, however, does not explain marten yields in Quebec, maybe because simply 451
defining stands according to their height class does not reflect their structural complexity 452
(McCann et al. 2014). Further, by analyzing interactions at such a broad spatial scale, 453
habitat loss observed by trappers at the trapline scale and its effect on local marten 454
populations were likely underestimated. 455
Changes in Rain Conditions 456
The variables describing rain conditions contributed to the most supported models in all 3 457
zones, but only the amount of cold rain during the previous spring influenced fisher yield 458
in the mixed and coniferous forest zones. Although fisher yield decreased with increasing 459
amount of cold rain during the previous spring, fisher yield increased in both zones. As 460
expected, in the mixed forest zone, marten yields decreased with increasing amounts of 461
rainfall and number of days with rainfall in the winter preceding the trapping season. The 462
amount of rainfall during the trapping season increased marten yields only in the 463
coniferous forest zone. Rain increases snow density and promotes ice crust formation on 464
the snow surface that could limit access to subnivean areas used for cover and to access 465
food (Callaghan and Johansson 2015, Williams et al. 2015, Domine et al. 2018). Cold 466
rain could also exert direct effects on marten thermoregulation (Taylor and Buskirk 467
1994).Martens have few fat reserves, which makes them potentially vulnerable to the 468
cold when their fur is wet (Buskirk and Harlow 1989). Increased rainfall could incur 469
greater natural winter mortality in adult martens. By limiting marten access to subnivean 470
space, rain-induced snow-crusting can cause marten to move more in search of food 471
resources. Increasing rainfall during the trapping season facilitates traveling by snowshoe 472
or snowmobile, and potentially increases the efficiency of trappers. Moreover, rain can 473
increase marten vulnerability to trapping. High marten yields during a rainy trapping 474
season can lead to a lower harvest in the following year. Phenomena that are observed at 475
the local scale by Quebec trappers are difficult to capture at the provincial scale. In 476
addition, our study used data over 30 years, which represents a relatively short time scale 477
compared to longer-term climate change. The use of average weather conditions over 478
large areas (FAMUs) and annual time steps was also unlikely to portray spatial and 479
temporal variation that would better represent freeze-thaw events affecting animal 480
survival. 481
Weather conditions favoring increased snow load-bearing capacity could also 482
have indirect effects on marten and fisher populations by influencing interspecific 483
competition. Karniski (2014) observed responses along these lines in the Adirondack 484
Mountains, northeastern United States. More compact snow favors movement of coyote 485
and red fox, which are 2 potential competitors or predators of martens and fishers 486
(Pozzanghera et al. 2016, Suffice et al. 2017). Thus, snow compaction could have an 487
indirect negative effect on marten and fisher by increasing competition with other 488
mesocarnivores, which would also mitigate the positive effect of snow compaction on 489
fisher movement. 490
Cumulative Effects and Relative Importance of Habitat and Climate Change 491
In this study, changes in forest cover exerted stronger effects on fisher than did rainfall 492
conditions. Too much emphasis is sometimes placed on climate change in biodiversity 493
scenarios, when other variables that arise from human activities may have similar or even 494
greater effects at shorter time scales (Titeux et al. 2016). Modifications of wildlife 495
habitats through land use conversion and exploitation of natural resources are considered 496
to be among the most important and immediate threats to biodiversity (Newbold et al. 497
2015). Climate change and human activities exert cumulative effects on plant and animal 498
species compositions, the changes of which can affect the distribution of fisher and 499
marten (Carroll 2007, Lawler et al. 2012, Lavoie et al. 2019). The greatest change in the 500
forest landscapes of North America is the migration or even reduction of conifer-501
dominated stands, which are replaced by mixedwood or deciduous stands (Lawler et al. 502
2012, Purcell et al. 2012, Zielinski et al. 2012). An increased risk of windthrow is also 503
expected to occur in eastern Canada, mainly through an increased period during which 504
the ground is unfrozen (Saad et al. 2017). These changes could favor the creation of 505
micro-habitats for small mammals and create new structures that could be exploited in 506
the subnivean environment. 507
In addition to logging, climate change that affects forest fire regimes is expected 508
to result in the loss of late-successional vegetation, which may increase the probability of 509
extirpation of associated species, such as fisher and marten (Bergeron et al. 2010, Lawler 510
et al. 2012, Purcell et al. 2012). Changes in winter conditions should facilitate the 511
movement of fishers and other mesocarnivores, and may change the partitioning of 512
niches based upon snow characteristics (Whiteman and Buskirk 2013, Manlick et al. 513
2017). Indeed, many medium-sized predators have already expanded their ranges, which 514
can affect food webs and trophic controls (Prugh et al. 2009, Pokallus and Pauli 2015). 515
Species conservation and habitat management in response to climate change pose the 516
challenge of balancing the need to maintain current habitat and anticipate future changes 517
in habitat and species distributions. Climate change scenarios predict conditions that 518
favor fishers, but data that have been obtained by Zielinski et al. (2017) suggest that 519
martens may be able to shift their niche to include warmer, less snowy areas. 520
Conservation of interacting species at the boundaries of their ranges requires managers to 521
be aware of interspecies tolerance, how each would uniquely respond to future climates, 522
and how potential climate refuges could be integrated into existing habitat (Morelli et al. 523
2016, Zielinski et al. 2017). 524
Inter-Specific Relations: The Missing Link? 525
Abundance of prey, competitors, and predators have been identified by trappers as major 526
factors that may explain changes in fisher and marten abundance (Suffice et al. 2017). 527
Behavioral changes caused by interspecific competition and by intraguild predation or 528
interspecific killing can have repercussions on the distribution of individuals, even 529
species (King and Moors 1979, Tannerfeldt et al. 2002, Eriksson et al. 2019). 530
Unfortunately, prey, competitor, and predator abundance variables were unavailable at 531
the scale of our study. Variation in marten catches could be more closely related to 532
fluctuations in food supply (Cheveau et al. 2004, Jensen et al. 2012, Fauteux et al. 2015) 533
than to habitat quality or climatic variation, although this remains to be demonstrated. 534
Environmental changes in recent decades have contributed to changes in the distribution 535
of fishers but also of other marten competitors. An assessment of the co-occurrence of 536
mesocarnivores, as was conducted by Gompper et al. (2016), would make it possible to 537
better consider the role of biotic factors in population dynamics. 538
Manlick et al. (2017) suggested that landscape homogenization leads to niche 539
compression and that marten populations would be limited through increased competition 540
with fishers. Dietary overlap between marten and fisher likely intensifies interspecific 541
competition through interference, as previously demonstrated in Wisconsin, USA 542
(Manlick et al. 2017). Dietary overlap is also a major predictor of intraguild predation 543
(Donadio and Buskirk 2006), as observed by McCann et al. (2010) in Wisconsin, where 544
fishers were the most common cause of winter mortality in marten. An inverse 545
relationship between marten and fisher occurrence has already been observed in several 546
sympatric populations, where coexistence has been attributed to mechanisms that reduce 547
competition for shared resources, such as spatiotemporal segregation, differential habitat 548
selection, and contrasting use of snow cover (Krohn et al. 1997, Fisher et al. 2013). In our 549
analyses, marten yields declined in the hardwood and mixed forest zones, where fisher 550
yields had increased the most. In the coniferous forest zone, where increases in fisher 551
yield were low, marten yield has yet to decrease. These results suggest that habitat use by 552
fisher and marten in Quebec may be influenced especially by interspecific relationships, 553
but this remains speculative. Thus, the co-occurrence characteristics of the 2 species need 554
to be studied at a finer spatial scale. 555
MANAGEMENT IMPLICATIONS 556
Pelt sales data can contribute to documentation of trends in furbearing populations over 557
the long-term and over large spatial scales (e.g., provincial or state forest zones). Closer 558
partnerships between government and wildlife users could also improve the efficiency of 559
population monitoring for species that are difficult to sample. In our case, involving 560
trappers in such a process contributed to the construction of testable hypotheses on 561
species ecology that can inform species management. To improve the quality of the 562
information provided by trappers in future research, we suggest they should be invited by 563
wildlife state and provincial agencies to share information on trapping effort and capture 564
location. In addition, trappers could supply carcasses to researchers to help monitor long-565
term fisher and marten physical condition and reproductive success according to 566
changing winter climate conditions. 567
The negative effect of winter rain on fisher and marten populations highlights the 568
need for protective cover to cope with climate change, particularly in an industrial forest
569
landscape. Although coniferous trees intercept rainfall and snowfall, old hardwood trees
570
can provide natural cavities for thermoregulation. Thus, managers should strive to
571
promote and maintain mixedwood stands taller than 12 m to maintain protective cover 572
and high-quality habitat for fishers. 573
ACKNOWLEDGMENTS 574
We thank M. Desrochers for geomatics analyses, J. Alluard for statistical analysis, R. St-575
Amant for his advice regarding the use of BioSIM, and W. F. J. Parsons for English 576
translation. We are indebted to the trappers for having formulated hypotheses based on 577
their experience and knowledge. Lastly, we thank P. Fournier for sharing his expertise on 578
trapping and field work. This project was supported by a grant from the Fonds de 579
Recherche du Québec ‒ Nature et Technologies. 580
LITERATURE CITED 581
Angers, V. A., C. Messier, M. Beaudet, and A. Leduc. 2005. Comparing composition and 582
structure in old-growth and harvested (selection and diameter-limit cuts) northern 583
hardwood stands in Quebec. Forest Ecology and Management 217:275–293. 584
Arthur, S. M., W. B. Krohn, and J. R. Gilbert. 1989. Home range characteristics of adult 585
fishers. Journal of Wildlife Management 53:674–679. 586
Aubry, K. B., C. M. Raley, S. W. Buskirk, W. J. Zielinski, M. K. Schwartz, R. T. 587
Golightly, K. L. Purcell, R. D. Weir, and J. S. Yaeger. 2013. Meta-analyses of 588
habitat selection by fishers at resting sites in the Pacific coastal region. Journal of 589
Wildlife Management 77:965–974. 590
Aylward, C. M., J. D. Murdoch, T. M. Donovan, C. W. Kilpatrick, C. Bernier, and J. 591
Katz. 2018. Estimating distribution and connectivity of recolonizing American 592
marten in the northeastern United States using expert elicitation techniques. Animal 593
Conservation 21:483–495. 594
Bergeron, Y., D. Cyr, C. R. Drever, M. Flannigan, S. Gauthier, D. Kneeshaw, È. Lauzon, 595
A. Leduc, H. L. Goff, D. Lesieur, and K. Logan. 2006. Past, current, and future fire 596
frequencies in Quebec's commercial forests: implications for the cumulative effects 597
of harvesting and fire on age-class structure and natural disturbance-based 598
management. Canadian Journal of Forest Research 36:2737–2744. 599
Bergeron, Y., D. Cyr, M. P. Girardin, and C. Carcaillet. 2010. Will climate change drive 600
21st century burn rates in Canadian boreal forest outside of its natural variability: 601
collating global climate model experiments with sedimentary charcoal 602
data. International Journal of Wildland Fire 19:1127–1139. 603
Berteaux, D., G. Gauthier, F. Domine, R. A. Ims, S. F. Lamoureux, E. Lévesque, and N. 604
Yoccoz. 2017. Effects of changing permafrost and snow conditions on tundra 605
wildlife: critical places and times. Arctic Science 3:65–90. 606
Bertrand, P., J. Bowman, R. J. Dyer, M. Manseau, and P. J. Wilson. 2017. Sex-specific 607
graphs: relating group-specific topology to demographic and landscape data. 608
Molecular Ecology 26:3898–3912. 609
Bissonette, J. A., D. J. Harrison, C. D. Hargis, and T. G. Chapin. 1997. The influence of 610
spatial scale and scale-sensitive properties on habitat selection by American marten. 611
Pages 368–385 in J. A. Bissonette, editor. Wildlife and landscape ecology: effects of 612
pattern and scale. Springer, New York, New York, USA. 613
Boucher, D., S. Gauthier, J. Noël, D. F. Greene, and Y. Bergeron. 2014. Salvage logging 614
affects early post-fire tree composition in Canadian boreal forest. Forest Ecology and 615
Management 325:118–127. 616
Bowman, J. C., D. Donovan, and R. C. Rosatte. 2006. Numerical response of fishers to 617
synchronous prey dynamics. Journal of Mammalogy 87:480–484. 618
Bridger, M. C., C. J. Johnson, and M. P. Gillingham. 2017. Working with experts to 619
quantify changes in the abundance of furbearers following rapid and large-scale 620
forest harvesting. Forest Ecology and Management 402:194–203. 621
Burnham, K. P., and D. R. Anderson. 2002. Model selection and multimodel inference: a 622
practical information-theoretic approach. Second edition. Springer, New York, New 623
York, USA. 624
Buskirk, S. W. 1992. Conserving circumpolar forests for martens and fishers. 625
Conservation Biology 6:318–320. 626
Buskirk, S. W., and H. J. Harlow. 1989. Body-fat dynamics of the American marten 627
(Martes americana) in winter. Journal of Mammalogy 70:191–193. 628
Buskirk, S. W., and L. F. Ruggiero. 1994. American marten. Pages 38–73 in L. F. 629
Ruggiero, K. B. Aubry, S. W. Buskirk, L. J. Lyon, and W. J. Zielinski, technical 630
editors. The scientific basis for conserving forest carnivores: American marten, 631
fisher, lynx, and wolverine in the western United States. General Technical Report 632
RM-254. USDA, Forest Service, Rocky Mountain Research Station, Fort Collins, 633
Colorado, USA. 634
Callaghan, T. V., and M. Johansson. 2015. Snow, ice, and the biosphere. Pages 139–165 635
in J. F. Shroder, W. Haeberli, and C. Whiteman, editors. Snow and ice-related
636
hazards, risks and disasters. Academic Press, Boston, Massachusetts, USA. 637
Carr, D., J. Bowman, C. J. Kyle, S. M. Tully, E. L. Koen, J.-F. Robitaille, and P. J. 638
Wilson. 2007a. Rapid homogenization of multiple sources: genetic structure of a 639
recolonizing population of fishers. Journal of Wildlife Management 71:1853–1861. 640
Carr, D., J. Bowman, and P. J. Wilson. 2007b. Density-dependent dispersal suggests a 641
genetic measure of habitat suitability. Oikos 116:629–635. 642
Carroll, C. 2007. Interacting effects of climate change, landscape conversion, and harvest 643
on carnivore populations at the range margin: marten and lynx in the Northern 644
Appalachians. Conservation Biology 21:1092–1104. 645
Chapin, T. G., D. J. Harrison, and D. D. Katnik. 1998. Influence of landscape pattern on 646
habitat use by American marten in an industrial forest. Conservation Biology 647
12:1327–1337. 648
Cheveau, M., P. Drapeau, L. Imbeau, and Y. Bergeron. 2004. Owl winter irruptions as an 649
indicator of small mammal population cycles in the boreal forest of eastern North 650
America. Oikos 107:190–198. 651
Cheveau, M., L. Imbeau, D. Drapeau, and L. Bélanger. 2013. Marten space use and 652
habitat selection in managed coniferous boreal forests of eastern Canada. Journal of 653
Wildlife Management 77:749–760. 654
Crête, M., and S. Larivière. 2003. Estimating the costs of locomotion in snow for 655
coyotes. Canadian Journal of Zoology 81:1808–1814. 656
Domine, F., G. Gauthier, V. Vionnet, D. Fauteux, M. Dumont, and M. Barrere. 2018. 657
Snow physical properties may be a significant determinant of lemming population 658
dynamics in the high Arctic. Arctic Science 4:813–826. 659
Domon, G., G. Beaudet, and M. Joly. 2000. Évolution du territoire laurentidien: 660
caractérisation et gestion des paysages. Isabelle Quintin éditeur, Montréal, Québec, 661
Canada. 662
Domon, G., and A. Bouchard. 2007. The landscape history of Godmanchester (Quebec, 663
Canada): two centuries of shifting relationships between anthropic and biophysical 664
factors. Landscape Ecology 22:1201–1214. 665
Donadio, E., and S. W. Buskirk. 2006. Diet, morphology, and interspecific killing in 666
carnivora. American Naturalist 167:524–536. 667
Drapeau, P., A. Leduc, J.-F. Giroux, J. L. Savard, Y. Bergeron, and W. L. Vickery. 2000. 668
Landscape-scale disturbances and changes in bird communities of the boreal mix-669
wood forests. Ecological Monographs 70:423–444. 670
Erb, J., P. Coy, and B. Sampson. 2013. Reproductive ecology of fishers and American 671
martens in Minnesota. Pages 100–109 in L. Cornicelli, M. Carstensen, M. D. Grund, 672
M. A. Larson, and J. S. Lawrence, editors. Summaries of wildlife research findings. 673
Minnesota Department of Natural Resources, St. Paul, USA. 674
Eriksson, C. E., K. M. Moriarty, M. A. Linnell, and T. Levi. 2019. Biotic factors 675
influencing the unexpected distribution of a Humboldt marten (Martes caurina 676
humboldtensis) population in a young coastal forest. PLoS ONE 14(5):e0214653.
677
Fauteux, D., M. Cheveau, L. Imbeau, and P. Drapeau. 2015. Cyclic dynamics of a boreal 678
southern red-backed vole population in northwestern Quebec. Journal of 679
Mammalogy 96:573–578. 680
Fisher, J. T., B. Anholt, S. Bradbury, M. Wheatley, and J. P. Volpe. 2013. Spatial 681
segregation of sympatric marten and fishers: the influence of landscapes and species-682
scapes. Ecography 36:240–248. 683
Fuller, A. K., and D. J. Harrison. 2005. Influence of partial timber harvesting on 684
American martens in north-central Maine. Journal of Wildlife Management 69:710– 685
722. 686
Fuller, A. K., and D. J. Harrison. 2013. Modeling the influence of forest structure on 687
microsite habitat use by snowshoe hares. International Journal of Forestry Research: 688
1–7. 689
Fuller, A. K., D. W. Linden, and J. A. Royle. 2016. Management decision making for 690
fisher populations informed by occupancy modeling. Journal of Wildlife 691
Management 80:794–802. 692
Garroway, C. J., J. Bowman, and P. J. Wilson. 2011. Using a genetic network to 693
parameterize a landscape resistance surface for fishers, Martes pennanti. Molecular 694
Ecology 20:3978–3988. 695
Gese, E. M. 2001. Monitoring of terrestrial carnivore populations. Pages 372–396 in J. L. 696
Gittleman, S. M. Funk, D. W. Macdonald, and R. K. Wayne, editors. Carnivore 697
conservation. Cambridge University Press, Cambridge, United Kingdom. 698
Gess, S. W., E. H. Ellington, M. R. Dzialak, J. E. Duchamp, M. Lovallo, and J. L. Larkin. 699
2013. Rest-site selection by fishers (Martes pennanti) in the eastern deciduous forest. 700
Wildlife Society Bulletin 37:805–814. 701
Gompper, M. E., D. B. Lesmeister, J. C. Ray, J. R. Malcolm, and R. Kays. 2016. 702
Differential habitat use or intraguild interactions: what structures a carnivore 703
community? PLoS ONE 11(1):e0146055. 704
Gouvernement du Québec. 2019. Normales climatiques 1981–2010; Climat du Québec. 705
<http://www.environnement.gouv.qc.ca/climat/normales/climat-qc.htm>.Accessed 5 706
Mar 2019. 707
Gouvernement du Québec, and Fédération des trappeurs gestionnaires du Québec. 2019. 708
Trapping and management of furbearing animals: safety and wildlife conservation 709
educational program. Programme d’éducation en sécurité et en conservation de la 710
faune (PESCOF). Fédération des trappeurs Gestionnaires du Québec, Québec, 711
Québec, Canada. 712
Graham, R. W., and E. C. Grimm. 1990. Effects of global climate change on the patterns 713
of terrestrial biological communities. Trends in Ecology and Evolution 5:289–292. 714
Green, R. E. 2017. Reproductive ecology of the fisher (Pekania pennanti) in the Southern 715
Sierra Nevada: an assessment of reproductive parameters and forest habitat used by 716
denning females. Dissertation, University of California, Davis, USA. 717
Grondin, P., S. Gauthier, V. Poirier, P. Tardif, Y. Boucher, and Y. Bergeron. 2018. Have 718
some landscapes in the eastern Canadian boreal forest moved beyond their natural 719
range of variability? Forest Ecosystems 5(1):1–17. 720
Hopkinson, C., M. Sitar, L. Chasmer, and P. Treitz. 2004. Mapping snowpack depth 721
beneath forest canopies using airborne lidar. Photogrammetric Engineering & 722
Remote Sensing 70:323–330. 723
Jensen, P. G., C. L. Demers, S. A. McNulty, W. J. Jakubas, and M. M. Humphries. 2012. 724
Marten and fisher responses to fluctuations in prey populations and mast crops in the 725
northern hardwood forest. Journal of Wildlife Management 76:489–502. 726
Jobin, B., J. Beaulieu, M. Grenier, L. Bélanger, C. Maisonneuve, D. Bordage, and B. 727
Filion. 2003. Landscape changes and ecological studies in agricultural regions, 728
Québec, Canada. Landscape Ecology 18:575–590. 729
Karniski, N. 2014. The effects of snow on American martens (Martes americana) and 730
fishers (Martes pennanti) in the Adirondack Mountains of New York. Dissertation, 731
State University of New York, Syracuse, USA. 732
Kawaguchi, T., A. Desrochers, and H. Bastien. 2015. Snow tracking and trapping harvest 733
as reliable sources for inferring abundance: a 9-year comparison. Northeastern 734
Naturalist 22:798–811. 735
Kelly, G. M. 1977. Fisher (Martes pennanti) biology in the White Mountain National 736
Forest and adjacent areas. Dissertation, University of Massachusetts, Amherst, USA. 737
Kilpatrick, H. J., and P. W. Rego. 1994. Influence of season, sex, and site availability on 738
fisher (Martes pennanti) rest-site selection in the central hardwood forest. Canadian 739
Journal of Zoology 72:1416–1419. 740
King, C. M., and P. J. Moors. 1979. On co-existence, foraging strategy and the 741
biogeography of weasels and stoats (Mustela nivalis and M. erminea) in Britain. 742
Oecologia 39:129–150. 743
Krohn, W. B. 2012. Distribution changes of American martens and fishers in eastern 744
North America, 1699–2001. Pages 58–73 in K. B. Aubry, W. J. Zielinski, M. G. 745
Raphael, G. Proulx, and S. W. Buskirk, editors. Biology and conservation of 746
martens, sables, and fishers: a new synthesis. Cornell University Press, Ithaca, New 747
York, USA. 748
Krohn, W., C. Hoving, D. Harrison, D. Phillips, and H. Frost. 2005. Martes foot-loading 749
and snowfall patterns in eastern North America: implications to broad-scale 750
distributions and interactions of mesocarnivores. Pages 115–131 in D. J. Harrison, A. 751
K. Fuller, and G. Proulx, editors. Martens and fishers (Martes) in human-altered 752
environments. Springer, Boston, Massachusetts, USA. 753
Krohn, W. B., W. J. Zielinski, and R. B. Boone. 1997. Relations among fishers, snow, 754
and martens in California: results from small-scale spatial comparisons. Pages 211– 755
232 in G. Proulx, H. N. Bryant, and P. M. Woodard, editors. Martes: taxonomy, 756
ecology, techniques and management. Second International Martes Symposium, 12– 757
16 August 1995, Provincial Museum of Alberta, Edmonton, Alberta, Canada. 758
Lancaster, P. A., J. Bowman, and B. A. Pond. 2008. Fishers, farms, and forests in eastern 759
North America. Environmental Management 42:93–101. 760
LaPoint, S. D., J. L. Belant, and R. W. Kays. 2015. Mesopredator release facilitates range 761
expansion in fisher. Animal Conservation 18:50–61. 762
Lavoie, M., A. Renard, and S. Larivière. 2019. Timber harvest jeopardize marten 763
persistence in the heart of its range. Forest Ecology and Management 442:46–52. 764
Lawler, J. J., H. D. Safford, and E. H. Girvetz. 2012. Martens and fishers in a changing 765
climate. Pages 371–397 in K. B. Aubry, W. J. Zielinski, M. G. Raphael, G. Proulx, 766
and S. W. Buskirk, editors. Biology and conservation of martens, sables, and fishers: 767
a new synthesis. Cornell University Press, Ithaca, New York, USA. 768
Lemieux, L., P. Leboeuf, and J. P. Berger. 2015. Norme de photo-interprétation: 769
quatrième inventaire écoforestier du Québec méridional. Gouvernement du Québec, 770
Ministère des Forêts, de la Faune et des Parcs, Direction des inventaires forestiers, 771
Secteur des Forêts, Québec, Québec, Canada. 772
Létourneau, J.-P., A. Bard, and J. Lambert. 2009. Normes de cartographie écoforestière: 773
troisième inventaire écoforestier. Gouvernement du Québec, Ministère des 774
Ressources naturelles et de la Faune, Direction des inventaires forestiers, Québec, 775
Québec, Canada. 776
Lewis, J. C., R. A. Powell, and W. J. Zielinski. 2012. Carnivore translocations and 777
conservation: insights from population models and field data for fishers (Martes 778
pennanti). PLoS ONE 7(3):e32726.
779
Lodge, D. M. 1993. Species invasions and deletions: community effects and responses to 780
climate and habitat change. Pages 376–387 in P. M. Kareiva, J. G. Kingsolver, and 781
R. B. Huey, editors. Biotic interactions and global change. Sinauer Associates, 782
Sunderland, Massachusetts, USA. 783
Macdonald, D. W., and C. Newman. 2002. Population dynamics of badgers (Meles 784
meles) in Oxfordshire, U.K.: numbers, density and cohort life histories, and a
785
possible role of climate change in population growth. Journal of Zoology 256:121– 786
138. 787
Manlick, P. J., J. E. Woodford, B. Zuckerberg, and J. N. Pauli. 2017. Niche compression 788
intensifies competition between reintroduced American martens (Martes americana) 789
and fishers (Pekania pennanti). Journal of Mammalogy 98:690–702. 790
Mazerolle, M. J. 2017. AICcmodavg: model selection and multimodel inference based on 791
(Q)AIC(c). R package version 2.1-1. <https://cran.r-792
project.org/package=AICcmodavg>. Accessed 21 Jul 2019. 793
McCann, N. P., P. A. Zollner, and J. H. Gilbert. 2010. Survival of adult martens in 794
northern Wisconsin. Journal of Wildlife Management 74:1502–1507. 795
McCann, N. P., P. A. Zollner, and J. H. Gilbert. 2014. Bias in the use of broadscale 796
vegetation data in the analysis of habitat selection. Journal of Mammalogy 95:369– 797
381. 798
Ministère de l’énergie et des ressources du Québec. 1984. Normes d’inventaire forestier. 799
Gouvernement du Québec, Ministère de l’énergie et des ressources du Québec, 800
Direction générale des publications gouvernementales, Québec, Québec, Canada. 801
Morelli, T. L., C. Daly, S. Z. Dobrowski, D. M. Dulen, J. L. Ebersole, S. T. Jackson, J. D. 802
Lundquist, C. I. Millar, S. P. Maher, W. B. Monahan, et al. 2016. Managing climate 803
change refugia for climate adaptation. PLoS ONE 11(8):e0159909. 804
Newbold, T., L. N. Hudson, S. L. L. Hill, S. Contu, I. Lysenko, R. A. Senior, L. Borger, 805
D. J. Bennett, A. Choimes, B. Collen, et al. 2015. Global effects of land use on local 806
terrestrial biodiversity. Nature 520:45–50. 807
Payer, D., and D. Harrison. 2005. Relationships between forest structure and habitat use 808
by American martens in Maine, USA. Pages 173–186 in D. J. Harrison, A. K. Fuller, 809
and G. Proulx, editors. Martens and fishers (Martes) in human-altered environments. 810
Springer, Boston, Massachusetts, USA. 811
Pelletier, G., Y. Dumont, and M. Bédard. 2007. SIFORT: système d'Information 812
FORestière par Tesselle. Manuel de l'usager. Gouvernement du Québec, Ministère 813
des Ressources Naturelles et de la Faune du Québec, Québec, Québec, Canada. 814
Pinheiro, J. C., and D. M. Bates. 2000. Mixed-effects models in S and S-PLUS. Springer 815
Verlag, New York, New York, USA. 816
Pinheiro, J. C., D. M. Bates, S. DebRoy, D. R. Sarkar, and R Core team. 2018. nlme:
817
linear and nonlinear mixed effects models. R package version 3.1-137.
818
<https://CRAN. R-project. org/package= nlme>. Accessed 27 Apr 2018.