UNIVERSITÉ DU QUÉBEC À RIMOUSKI
PHOTOPRODUCTIONDE MONOXYDE DE
CARBONE
DANS LES ÉCOSYSTÈMES
MARINS:
PARTICULES
CONTRE
SOLUTÉS
Thèse présentée
dans le cadre du programme de doctorat en Océanographie en vue de l'obtention du grade de philosophiae doctor
PAR Guisheng Song
UNIVERSITÉ DU QUÉBEC À RIMOUSKI Service de la bibliothèque
Avertissement
La diffusion de ce mémoire ou de cette thèse se fait dans le respect des droits de son auteur, qui a signé le formulaire « Autorisation de reproduire et de diffuser un rapport, un mémoire ou une thèse ». En signant ce formulaire, l’auteur concède à l’Université du Québec à Rimouski une licence non exclusive d’utilisation et de publication de la totalité ou d’une partie importante de son travail de recherche pour des fins pédagogiques et non commerciales. Plus précisément, l’auteur autorise l’Université du Québec à Rimouski à reproduire, diffuser, prêter, distribuer ou vendre des copies de son travail de recherche à des fins non commerciales sur quelque support que ce soit, y compris l’Internet. Cette licence et cette autorisation n’entraînent pas une renonciation de la part de l’auteur à ses droits moraux ni à ses droits de propriété intellectuelle. Sauf entente contraire, l’auteur conserve la liberté de diffuser et de commercialiser ou non ce travail dont il possède un exemplaire.
UNIVERSITÉ DU QUÉBEC À RIMOUSKI
CARBON
MONOXIDE
(CO)
PHOTOPRODUCTION
IN
MARINE ECOSYSTEMS:
PARTICLES VERSUS SOLUTES
A dissertation
submitted in partial fulfillment of the requirements for the Doctor of Phylosophy Degree in Oceanography
BY Guisheng Song
Composition du jury:
Jean-Pierre Gagné, président du jury, Université du Québec à Rimouski Huixiang Xie, directeur de recherche, Université du Québec à Rimouski Simon Bélanger, codirecteur de recherche, Université du Québec à Rimouski David J. Kieber, examinateur externe, State University of New York College of
Environmental Science and Forestry
Michael G. Scarratt, examinateur externe, Maurice Lamontagne Institute, Fisheries and Oceans Canada
REMERCIEMENTS
Je tiens à remercier mon directeur de thèse, le Dr Huixiang Xie, pour son soutien et ses conseils. Au cours de mes études supérieures dans les 4 dernières années, il m'a beaucoup appris sur la science et sur la vie, et m'a aidé à grandir et devenir un scientifique en océanographie. Ses encouragements et conseils sont précieux pour ma future carrière.
Je remercie également tous les membres de mon comité pour leur soutien, leurs conseils tout au long de ce projet: Simon Bélanger (co-directeur) a fait un travail exemplaire dans la détermination des spectres d'absorption de particules (également Thomas J aegler) et la modélisation de l' irradiance solaire et le taux de photoproduction de CO à partir de la CDOM et des particules sur la base des données de couleur de l'océan, Michel Gosselin et Michael Scarratt m'ont aidé dans l'incubation d'algues de glace. En outre, ils m'ont beaucoup aidé dans le traitement des données, la composition et la présentation du rapport et mes publications.
J'apprécie grandement le Dr David J. Kieber (SUNY -ESF) de m'avoir reçu en tant qu'étudiant-invité dans son laboratoire et pour son aide lors des croisières dans l'estuaire du Delaware (avec Sara Button, John Richardson et James Werner). Je suis reconnaissant à Connie Lovejoy (Université Laval) et Andrew R. Juhl (Columbia University) d'avoir fourni des cultures d'algues de glace. Je tiens à remercier les populations concernées dans mon travail, sans qui je n'aurais pu terminer ce projet avec succès. Je tiens à remercier Souad Annane, Pascal Rioux, Karine Lemarchand, Eva Alou-Font et Jean-Pierre Gagné d'avoir fourni des instruments et leur assistance lors de l'incubation de la culture, Mélanie Simard pour la chlorophylle et l'analyse du COD, les scientifiques, les collègues, CJ Mundy et Jens K. Ehn d'avoir fourni des données pour mes publications, Edouard Leymarie d'avoir lancé la simulation Mont-Carlo, et les capitaines et membres d'équipage de l' NGCC Amundsen et RV Sharp pour leur coopération au cours des études sur le terrain. Enfin, je suis
x
reconnaissant pour tout le monde (Cyril Aubry, Xiaomeng Wang, Abderrahmane Taalba et Liming Qi) dans notre groupe et tout le monde dans mon bureau de me tenir compagnie ici. Ce travail a été financé par des subventions en sciences naturelles et en génie du Canada (CRSNG) et de l'Année canadienne polaire internationale (API) du bureau du programme fédéral. J'ai a été soutenu par une bourse de doctorat de Recherche pour étudiants étrangers du Fonds québécois de la recherche sur la nature et les technologies (FQRNT) et une bourse d'études supérieures ISMER.
ACKNOWLEDGMENTS
1 would like to thank my supervisor, Dr. Huixiang Xie, for his support and guidance. During my graduate studies in the past four years, he taught me a lot in science and life, and helped me to grow up and become a scientist in Oceanography. His encouragement and guidance is invaluable for my future career.
1 also thank all the members of my committee for their support, advice throughout this project: Simon Bélanger (co-supervisor) did a lot work in detennining the absorbance spectra of particles (with his student, Thomas Jaegler) and modeling solar irradiance and CO photoproduction rate from both CDOM and particles based on the ocean color data; Michel Gosselin and Michael Scarratt helped me in the ice algae incubation. Also they helped me a lot in processing the data, composing and presenting the report and my publications.
1 greatly appreciate Dr. David J. Kieber (SUNY-ESF) for inviting me as a guest student in his lab and his help during the cmises in the Delaware Estuary (along with Sara Button, Jolm Richardson and James Wemer). 1 am grateful to Connie Lovejoy (University Laval) and Andrew R. Juhl (Columbia University) for providing ice algal cultures. 1 would like to thank the peoples involved in my work, and 1 will not finish the project successfully without their assistance: 1 wou Id thank Souad Annane, Pascal Rioux, Karine Lemarchand, Eva Alou-Font, Jean-Pierre Gagné, Émilien Pelletier, Gustavo A. Ferreyra and Thomas Pollet for providing instmments, lab space and their assistance, Mélanie Simard for chlorophyll a and DOC analysis, Claude Belzile for biomass analysis, Mathieu Babin for extracting the compounds, James Caveen for technical assistance in modeling, C. J. Mundy for providing data for my publications, Edouard Leymarie for mnning the Mont-Carlo simulation, and the captains and crew of the CCGS Amundsen and R. V Sharp for their cooperation during the field studies. At last, 1 am grateful to everyone in our group (Cyril
XII
Aubry, Xiaomeng Wang, Abderrahmane Taalba and Liming Qi) and everyone in my office for making me comfortable to stay here.
This work was supported by grants from the Natural Sciences and Engineering Research Council of Canada (NSERC) and Canadian International Polar Year (IPY) federal pro gram office. l received a bourse de doctorat de recherche pour étudiants étrangers from the Fonds Québécois de la recherché sur la nature et les technologies (FQRNT) and an ISMER graduate fellowship.
RÉSUMÉ
Le monoxide de carbone (CO) joue un rôle important dans le cycle du carbone organique marin et dans la chimie atmosphérique. L'océan est reconnu depuis longtemps comme la principale source de CO dans l'atmosphère. Dans la couche supérieure de l'océan, le CO est produit principalement à partir de la photodégradation de la matière organique dissoute chromophorique (CDOM). Cependant, des données récentes suggèrent que la photolyse de la matière organique particulaire (POM) peut également produire une quantité importante de CO dans la colonne d'eau. Pour comprendre la contribution de la POM à la photoproduction de CO et, par conséquent, évaluer l'importance de la photodégradation de la POM dans le cycle du carbone marin, ce travail a permis, pour la première fois, de quantifier le rendement apparent quantique de la photoproduction de CO (AQY CO) à partir de la POM et du CDOM dans des écosystèmes aquatiques de climat froid (c.-à-d., le sud-est de la mer de Beaufort) et tempéré (c.-à-d, la baie du Delaware). La variation spatio-temporelle du CO dans la glace de mer de première année, un autre écosystème important de l'Arctique, a également été évaluée. En outre, les spectres AQY CO de la POM et du CDOM provenant de cultures d'algues de glace ont été déterminés. La contribution de la POM et du CDOM à la photoproduction de CO à la base de la glace de mer a également été estimée.
La concentration de CO a fluctué de façon irrégulière dans la couche superficielle de la glace de mer. À la base de la glace, elle a toutefois suivi la concentration des algues, avec de faibles valeurs au début de la période d'accumulation des algues, un fort enrichissement pendant l'efflorescence et la période post-efflorescence, et un appauvrissement de nouveau pendant la fonte de la banquise. Les profils verticaux montrent une diminution de la concentration en CO de la surface vers la base de la glace
XIV
au début du printemps et ces profils sont variables pendant la saison de fonte. En présence de fortes biomasses alga1es à la base de la glace à la mi-printemps, le CO a été fortement enrichi à la base de la glace (82,9 ± 84 nmol LI) par rapport à la surface (16,8 ± 7 nmol LOi). De plus, la banquise côtière contenait des teneurs en CO supérieures à celles de la glace dérivante. La concentration moyenne de CO dans la glace de mer pendant la campagne d'échantillonnage a été de 13,9 ± 10 }tmol mo2 et la production nette de CO pendant le bloom d'algues de glace a été évaluée à 13,2 }tmol mo2• La glace de mer est reconnue comme une source importante de CO atmosphérique et elle pourrait contribuer à un flux annuel vers l'atmosphère de 7.4 x 10⁷ moles de CO dans la zone d'étude.
Généralement, les AQY s CO des particules et du CDOM diminuent avec l'augmentation de la longueur d'onde, mais la forme du spectre dans le visible, en ce qui concerne les particules était supérieure et plus platte. Cette caractéristique a donné lieu à une production de CO par la lumière visible disproportionnellement élevée pour les particules. Ainsi, le ratio entre la photoproduction de CO par les particules et celle par le CDOM augmente avec la profondeur dans la zone euphotique et dans la glace de mer. Plus précisément, les spectres AQY CO des particules provenant de cultures d'algues de glace en phases de croissance exponentielles et sénescentes ont été plus élevés que ceux du CDOM des cultures, en particulier aux longues longueurs d'onde. Contrairement au CDOM, il y avait une photoproduction de CO substantielle à partir des particules aux longueurs d'ondes> 600 nm. Étant donné que le flux de photons du rayonnement solaire atteignant la couche inférieure de la glace de mer est largement dominé par la lumière visible, notamment sous un couvert de neige, on s'attend à ce que la POM joue un rôle plus important que celui de la matière organique dissoute (DOM) dans l'accumulation de CO durant le bloom d'algues de glace. Toutefois, nous estimons que la contribution relative de la DOM à l'accumulation du CO dans la glace augmente avec la progression de la fonte de la neige et de la glace.
Dans le sud-est de la mer de Beaufort, l'AQY CO des particules a augmenté de l'estuaire et du plateau vers le bassin, tandis que celui du CDOM a suivi une tendance inverse. L'eau provenant du maximum profond de chlorophylle (DCM) a révélé des
xv
dominée par le rayonnement ultraviolet (UV, 290-400 nm) alors que la lumière UV et visible a joué un rôle à peu près égal dans la production de CO à partir des particules.
Dans l'estuaire du Delaware, les valeurs du AQY CO ont été déterminées sur des échantillons d'eau de mer filtrée sur membranes de 0,2, 10 et 20 flm de porosité, afin d'évaluer l'effet de la taille de la matière organique sur l'efficacité de photoproduction de CO. En raison des propriétés distinctes de la matière organique le long de l'estuaire, la forme des spectres du CO AQY du CDOM et des particules a moins varié que celle obtenue lors d'études précédentes. Par conséquent, la lumière visible plutôt que l'UV a été le principal responsable de la photoproduction de CO à partir, à la fois, des particules et du CDOM dans la colonne d'eau. Les particules et le CDOM au milieu de la zone de tubidité maximum ont été plus photoréactifs que leurs homologues provenant de la terre ferme, en raison de la floculation, de l'adsorption eUou de la désorption aux endroits où il y avait suffisamment de mélange de l'eau douce avec l'eau salée. Aucune différence significative dans la photoréactivité des particules en termes de production de CO n'a été trouvée entre les deux fractions de taille des particules le long de l'estuaire.
Selon notre modèle, la contribution des particules à la photoproduction totale de CO serait supérieure à 84% à la base de la glace de mer, de 12-32% en eau libre dans le secteur sud-est de la mer de Beaufort et de 29-77% dans l'estuaire du Delaware. En outre, la contribution des particules de petite taille
«
1 0 ft m) à la photoproduction totale de CO basée sur l'ensemble des particules a été plus grande dans l'estuaire du Delaware, car cette fraction de taille est la composante dominante des particules chromophoriques. Cette étude présente de nouvelles preuves que la photochimie des particules joue un rôle important dans le cycle du carbone océanique et des gaz traces, en particulier dans les eaux estuariennes et côtières et dans la glace de mer, des milieux où la photochimie des particules pourrait dépasser celle du eDOM.Mot clés: monoxyde de carbone, photoproduction, le rendement apparent quantique, CDOM, les particules, la glace de mer, la mer de Beaufort, l'estuaire du Delaware
ABSTRACT
Carbon monoxide (CO) plays an important role in marine organic carbon cycle and in atmospheric chemistry. The ocean has long been recognized as an important source of atmospheric CO. In the upper ocean, CO is produced primariIy from photodegradation of chromophoric dissolved organic matter (CDOM). However, recent evidence suggests that photolysis of particulate organic matter (POM) can also produce a significant amount of CO in the water column. To understand the contribution of POM to CO photoproduction and hence assess the importance of POM photodegradation to marine carbon cycling, this work for the first time quantified the spectrally resoived apparent quantum yields (AQYs) of CO photo production from POM, as weil as from CDOM in cold (southeastern (SE) Beaufort Sea) and warm aquatic ecosystems (Delaware Bay). The spatiotemporal variation of CO concentration ([COD in first-year sea ice in the SE Beaufort Sea was also examined. CO AQY spectra of POM and CDOM harvested from ice algal cultures were determined to model the contributions of POM and CDOM to CO photoproduction in bottom sea ice.
[CO] fluctuated irregularly in surface ice but followed the biomass of ice algae in bottom ice, i.e. low at the start of ice algal accumulation, highly enriched during the peak-bloom and early post-bloom, and depleted again during sea ice melt. Vertical profile of CO typically decreased downward in early spring and was variable in the melting season. In the presence of high bottom ice algal biomass in mid-spring, CO was highly enriched in the bottom (82.9 ± 84 nmol L-I) relative to the surface (CO: 16.8 ± 7 nmol L-I). Furthermore, landfast ice contained higher levels of CO th an drifting ice. Cruise-mean CO inventory in sea ice was 13.9 ± 10 /-lmoi m-2, and the net production of CO during the ice al gal bloom was assessed to be 13.2 flmol m-2• Sea ice is recognized as an important
XVIll
source of atmospheric CO and might contribute 7.4 x 10⁷ moles of CO a-1 to the atmosphere in the study area.
Generally, CO AQY s of both partic1es and CDOM decreased with wavelength but the spectral shape of the particulate AQY was t1atter in the visible regime. This feature resulted in a disproportionally higher visible light-driven CO production by partic1es, thereby increasing the ratio of partic1e- to CDOM-based CO photoproduction with depth in the euphotic zone and in sea ice. Specifically, CO AQY spectra of partic1es collected from ice algal cultures at the exponential and senescent phases were higher than the corresponding CDOM samples, particularly at long wavelengths. Unlike CDOM, at À> 600 nm, there was prolific CO photoproduction from partic1es collected from ice algal cultures. Given that the photon t1ux of solar radiation reaching the bottom sea ice is overwhelmingly dominated by the visible regime, particularly under snow coyer, POM is expected to play a far more important role than DOM in contributing to the CO accumulation during the ice algal bloom. The relative contribution from DOM, however, is estimated to increase with the progression of snow and ice melting.
In the SE Beauf Olt Sea, CO AQY of partic1es augmented from the estuary and shelf to the basin while that of CDOM trended inversely. Water from the deep chlorophyll maximum (DCM) layer revealed higher CO AQYs than did surface water for both partic1es and CDOM. CO AQY of partic1es exceeded that of CDOM on the shelf and in the basin but the sequence inversed in the estuary. In terms of depth-integrated production in the euphotic zone, CO formation from CDOM was dominated by the ultraviolet (UV, 290-400 nm) radiation whereas UV and visible light played roughly equal roles in CO production from partic1es.
In the Delaware Estuary, CO AQY s in 0.2-, 10- and 20-,um filtered water samples were determined, to evaluate the size effect of organic matter on CO photoproduction efficiency. Owing to the distinct properties of organic matter along the estuary, the spectral shape of CO AQY of CDOM and partic1es were t1atter than those in previous studies, and hence visible light, rather than UV, were the main contributor to CO photoproduction from both
XIX
particles and CDOM in the water column. Both pmticles and CDOM in the mid-TMZ were more photoreactive th an their counterparts from land, due mainly to flocculation, adsorption and/or desorption during intense mixing of fresh water with saline seawater. No significant difference in particle photoreactivity in tenns of CO production was found between the two size fractions of particles along the estuary.
Modeled CO photoproduction indicated that particles could contribute more than 84% in bottom sea ice, 12-32% in open water in the SE Beaufort Sea and 29%-77% in the Delaware Estuary to total CO photoproduction. Furthermore, small-sized particles
«
10 ,um) accounted for more of particle-based CO photo production in the Delaware Estuary, since this size fraction is the dominant component of chromophoric particles. This study provides novel evidence that particle photochemistry is an important term in marine carbon and trace gas cycling, especially in estuarine and coastal waters and sea ice, where particle photochemistry may exceed that of CDOM.Keywords: carbon monoxide, photoproduction, apparent quantum yield, CDOM, particles, sea ice, Beaufort Sea, Delaware Estuary
TABLE DES MATIÈRES
REMERCIEMENTS ... IX ACKNOWLEDGMENTS ... XI RÉSUMÉ ... XIII ABSTRACT ... : ... XVII TABLE DES MATIÈRES ... XXI LISTE DES T ABLEA UX ... XXV LISTE DES FIGURES ... XXVII LISTE DES ABRÉVIATIONS ... XXXI LISTE DES SyMBOLES ... XXXIII
CHAPITRE 1 INTRODUCTION ... 1
1.1 PHOTOCHIMIE DE LA MATIÈRE ORGANIQUE MARINE ... 1
1.2 CYCLE BIOGÉOCHIMIQUE DU CO DANS L'OCÉAN ... 3
1.3 MOTIVATIONS ... 4
1.4 OBJECTIFS ... 6
CHAPITRE 2 VARIATIONS SPA TIOTEMPORELLE DU CARBONE ORGANIQUE DISSOUS ET MONOXYDE DE CARBONE DANS LA GLACE DE MER DE PREMIERE ANNEE DANS L'OUEST DE L'ARCTIQUE CANIDIEN .... 15
RÉSUMÉ ... 16
ABSTRACT ... 16
2.1 INTRODUCTION ... 17
2.2 METHODS ... 19
XXII
2.2.2 CHLOROPHYLL A ... 20
2.2.3 DOC AND CO ... 23
2.3 RESUL TS ... 24
2.3.1 GENERAL METEOROLOGICAL AND HYDROLOGICAL PROPERTIES ... 24
2.3.2 CHLOROPHYLL A, DOC, AND CO IN SURFACE AND BOTTOM SEA ICE ... 28
2.3.3 VERTICAL DISTRIBUTIONS OF CHL A, DOC, AND CO ... 33
2.3.4 VERTICAL DISTRIBUTIONS OF CHL A, DOC, AND CO ... 36
2.4 DISCUSSION ... 38
2.4.1 COMPARISON WITH PREVIOUS STUDlES ... 38
2.4.2 FACTORS CONTROLLING [DOC] AND [CO] IN SEA lCE ... 39
2.4.3 NET PRODUCTION OF DOC AND CO ... " ... " ... 42
2.4.4 CONTRIBUTION OF SEA ICE TO ATMOSPHERIC CO ... 44
2.5 SUMMARY AND CONCLUSIONS ... 46
ACKNOWLEDGMENTS ... 47
CHAPITRE 3 PHOTOPRODUCTION DE MONOXYDE DE CARBONE A PARTIR DE MATIERES ORGANIQUES PARTICULAIRE ET DISSOUTE DANS LES CULTURES D'ALGUES DE GLACE ... 49
RÉSUMÉ ... 50
ABSTRACT ... 50
3.1 INTRODUCTION ... 51
3.2 METHODS ... 53
3.2.1 ICE ALGAL CULTURE INCUBATIONS ... 53
3.2.2 SAMPLE COLLECTION ... 56
3.2.3 IRRADIATION ... 58
3.2.4 SAMPLE ANALYSES ... 59
3.2.5 RETRIEVAL OF CO AQY ... 61
3.3 RESULTS ... 63
3.3.1 GENERAL CHEMICAL, BIOLOGICAL AND OPTICAL PROPERTIES ... 63 3.3.2 CONTROLS AND LINEARITY OF CO PHOTOPRODUCTION FROM PARTICLES. 68
XXIII
3.3.3 CO AQY SPECTRA •.•.••.•••.•.•••.••..••...•••.•••..•••.••.•..••.•••.••..•..•••.••..••••.•.•••••.•••••.•.•• 70 3.3.4 cp AND PHOTOREACTTVITY ... 71 3.4 DISCUSSION ....•••••.•.•••••.•••.••..•.••.•••.••••.•.•.•••..•••...••.••.•••.•.•.•.••.•.•.•....•••.••..•...•.•••.••. 77 3.4.1 COMPARE if>A WITH PREVIS OU STUDIES ... 77 3.4.2 ACTION SPECTRA OF CO PHOTOPRODUCTION IN BOTTOM SEA ICE •••••••••••.•• 79 3.5 SUMMARY ••..••..••.•.•••.••••..•..••.•.•••••..•••.•.••••••••..•.•...•.••..•....•.•.•...••.•.••.•••.•.•.•.•••.•••.••• 84 ACKNOWLEDGMENTS .••.••••.•••.••..•.•••.••.••••.•.••••••.••...•••••••..•..•.•••.•••.•.••.•..•••••.•••.•••••••... 85 CHAPITRE 4 L'EFFICACITE SPECTRALE DE LA PHOTOPRODUCTION DE MONOXYDE DE CARBONE (CO) DANS L'ARCTIQUE CANADIEN DE
L'OUEST: PARTICULES CONTRE SOLUTES .••.•.•.••.•••.•.•••.••••••.••••••.••.•••••••••.•••.•••.... 87
RÉSUMÉ .••••...••••...••.•...••••.•..•.••.••....•••.••.•••.••.•••••..••..••.•.•••.••..••.•..••.••••.••.•.•..•..•.•••.•••.•.• 88 ABSTRACT •..•••.•.••.••.••.•.••••.••..••.•••.•.•••••...•.•..•..•...•••.••••..•..•.•.••••.•.••.••...••...•••...•.. 89 4.1 INTRODUCTION ••.•.••••.•••.••.•••.•.•••••••••••.•••.•.••.•••.•.•••••••.•...••••.•••.•••.•••••.•••.••••••••••.•••• 91 4.2 METHODS .•...•..•••.•.•••..••..••.•••.•••••.••.•••••.•••••••••••...•••.•••••••••••••••.••••.•.••••••.•.•.•••.••••••.. 93 4.2.1 STUDY AREA •..•.•••..•...••.•••...••••••••••.•.••••••••••.••.•••....••..••••••••.••••.•..•••••.•••••••.•••.•.•• 93 4.2.2 SAMPLING •...•.•••.•••••.••.•••..•.•••••.•••••.•..•.•.•••••.•.•.•••.•••..••.••.•..•••••.•..•••••.•••.•.•••••.•.•• 97 4.2.3 IRRADIATION .•.•.•.••..••.•••..•.•••••••••••.•••.••.•••••.•••••.••••....••••...•....•.•..•...•..••.•••••••.•• 1 00 4.2.4 ANALySES ... 101 4.2.5 RETRIEVAL OF CO AQY •.••••••••••••.•..••••••.•••.•••.•••••..•••••••..••.••••...•••.•.•.••..•••.•.• 103 4.3 RESULTS AND DISCUSSION ... 106 4.3.1 GENERAL PHYSICAL, BIOLOGICAL, AND CHEMICAL SETTINGS •••••••••.•••••••.• 106 4.3.2 CO AQY SPECTRA ... 109 4.3.3 PHOTOREACTIVITY OF CDOM AND PARTICLES •...••••••••••••••••.•••••••.•••••.••••••• 116 4.3.4 ACTION SPECTRA OF CO PHOTOPRODUCTION ... 118 4.3.5 MODELING CO PHOTOPRODUCTION ... 123 4.4 SUMMARY •••••••••••••••••••.••.•.•.•••••••.••.•••••••..••••.••....••.•••.•••••••••••..•.••.•..•••••.••••.••••••••• 129 ACKNOWLEDGMENTS ....•..•.•..•.•••..••••....••.••.••.••••.•••.•.•.•....•...•.•.•.•••••.•.•.•••.•..•...•••••..• 129
xxiv
CHAPITRE 5 PHOTOPRODUCTION DE MONOXYDE DE CARBONE (CO) A PARTIR DE DIFFERENTES CLASSES DE TAILLE DE MATIERE ORGANIQUE DANS L'ESTUAIRE DU DELAWARE SOUS DES CONDITIONS
HYDRO-BIOLOGIQUES CONTRASTEES ... 131 RÉSUMÉ ... :. 132 ABSTRACT ... 133 5.1 INTRODUCTION ... 134 5.2 METHODS ... 135 5.2.1 STUDY SITE ... 135 5.2.2 SAMPLING ... 137 5.2.3 iRRADIATION ... 142 5.2.4 DETERMINATION OF ABSORPTION SPECTRA OF CDOM AND PARTICLES ... 143 5.2.5 RETRIEVAL OF CO AQY SPECTRA ... 145 5.3 RESULTS ... 147 5.3.1 GENERAL HYDROLOGICAL, BIOLOGICAL AND METEOROLOGICAL
CONDITIONS ... 147 5.3.2 ABSORPTION COEFFICIENT OF CDOM ... 148 5.3.3 ABSORPTION COEFFICIENT OF PARTICLES ... 152 5.3.4 ABSORPTION COEFFICIENT OF PARTICLES ... 154 5.3.5 cp AND PHOTOREACTIVITY ... 161 5.3.6 ACTION SPECTRA OF CO PHOTOPRODUCTION ... 164 5.3.7 MODELING CO PHOTOPRODUCTION ... 167 5.4 SUMMARY ...•... 172 ACKNOWLEDGMENTS ...•... 173 CHAPITRE 7 SOMMAIRE ET CONCLUSIONS ... 175 A1"~i'~EX 1 ... 181 ANNEX2 ... 189 RÉFÉRENCES BIBLIOGRAPHIQUES ...•... 193
LISTE DES T ABLEA UX
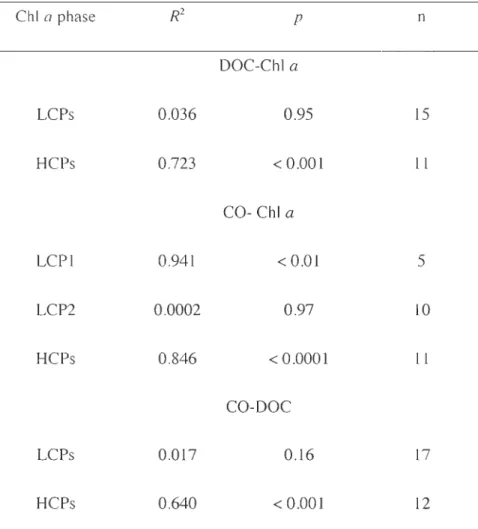
Table 2-1 Sampling dates, locations and corresponding sea ice conditions ... 22 Table 2-2 Results of linear least-squares regression analysis between DOC, CO and ChI a
in the bottom lü-cm sea ice layer. ... .32 Table 2-3 Comparison of depth-integrated (i.e., column burden) and depth-weighted
concentrations of Chi a, DOC, and CO between drifting and landfast sea ice
and among different ChI a phases ... .37
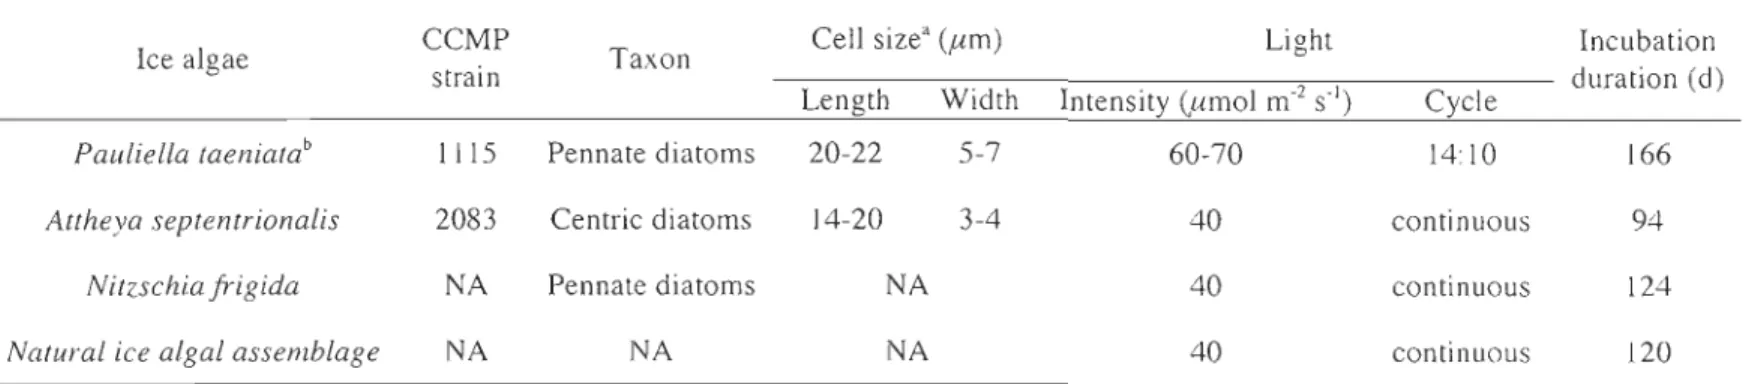
Table 3-1 Information of selected ice algae and the incubation conditions ... .55
Table 3-2 Biological and optical properties of the particle samples ... 65
Table 3-3 Chemical and optical properties of the O.2-,um filtered samples ... 66
Table 3-4 Fitted parameters of Eq. (3-4) for CDOM and Eq. (3-5) for particle samples,
along with cp 330 and (fj . ..... 73 Table 4-1 Sampling information along with salinity and water temperature ... 99
Table 4-2 Means and ranges of salinity, temperature, [Chi a], acdom.412' a p,412'
and aphy,412:ap,412 ...............•... 108
Table 4-3 Fitted parameters for filtered (CDOM) and unfiltered (CDOM plus particles) samples, along with CJ>3JO and (fj for CDOM, CDOM plus particles, and particles .... 1l0
xxvi
Table 4-4. Arithmetic means (± s.d.) of Po, Peol' 'iPcol' and ap.412:aedom.412 in August 2009 based on individual stations within each sub-region ... 127 Table 4-5. Pedoln.col' pp.col Cumol m-2 d-\ and P".col:Pedol1l,eol based on ocean color data from
remote sensing ... , ... , ... .128 Table 5-1 Station coordinates, sampling dates along with salinity, temperature, total water
depth, ChI a and attenuation coefficient (kd) . . . .. . . .139
Table 5-2 Fitted parameters for function (/JJ,.
=
ml xexp (m2 x(À - 290)) for0.2-,10-and 20-,um filtered water samples and the values of QJ330 and QJ ... .152 Table 5-3 Modeled CO photoprodüction rates at the surface (Po) and in the water column
(Pco) at each station in August and November ... , ... .170 Table 5-4 Comparison of the contributions of pat-tic1es to total CO photoproduction
LISTE DES FIGURES
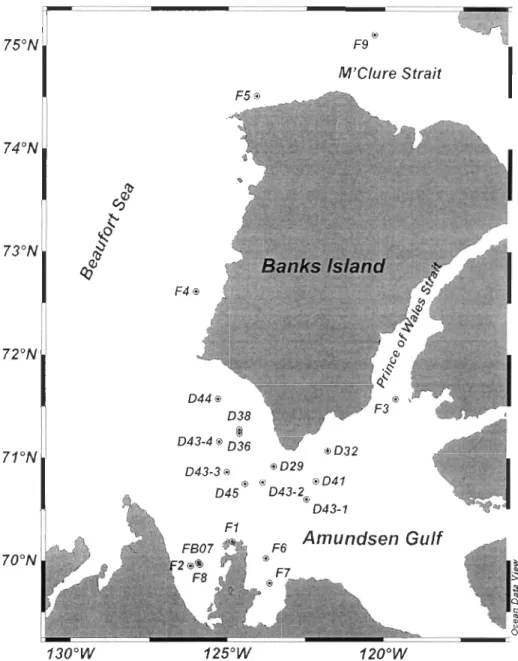
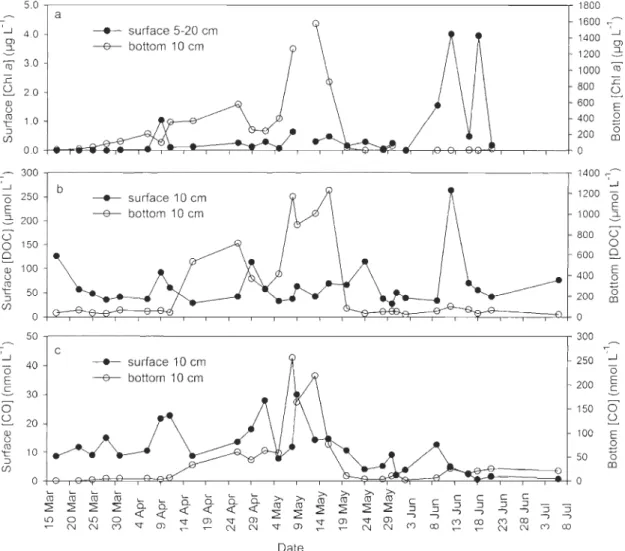
Fig. 1-1 The identified sources and sinks of CO in the ocean ... 8 Fig. 2-1 Map of sea ice sampling stations ... .21 Fig. 2-2 Spatiotemporal variations of (a) daiIy averaged shortwave, and photosynthetic
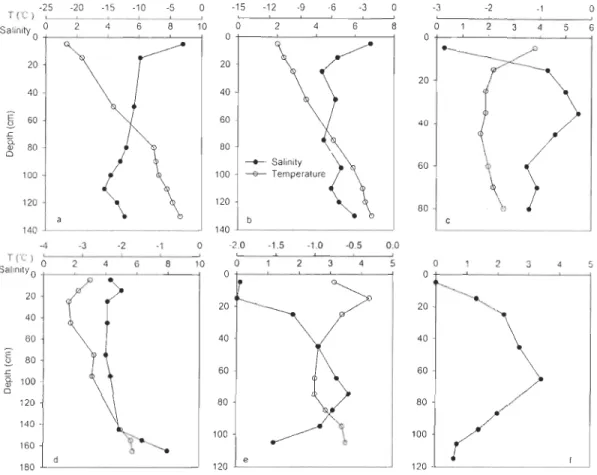
active radiation (PAR), (b) daily averaged air temperature, (c) sea ice temperature, and (d) bulk sea ice salinity from 17 March to 6 July 2008 ... 26 Fig. 2-3 Depth profiles of sea ice salinity and temperature ... 27 Fig. 2-4 Spatiotemporal variations of (a) chlorophyll a (ChI a), (b) dissoived
organic carbon (DOC), (c) carbon monoxide (CO) concentrations in surface
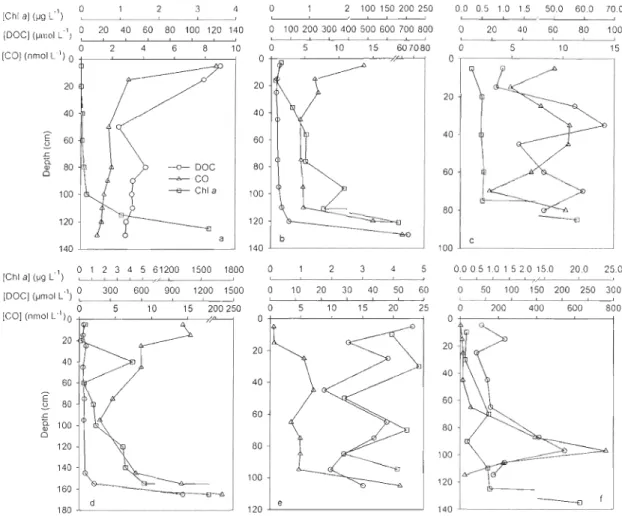
and bottom sea ice Iayers from 17 March to 6 July 2008 ... 31 Fig. 2-5 Depth profiles of sea ice chlorophyll a (ChI a), dissoived organic carbon (DOC),
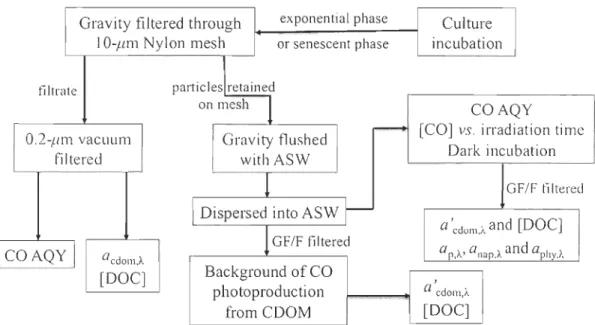
carbon monoxide (CO) concentrations ... 35 Fig. 3-1 Flow-chart of the main procedures of sample collection and processing ... 57 Fig. 3-2 Examples of absorption spectra of particles and CDOM ... 67 Fig. 3-3 Examples of [CO] aiong with irradiation time under full spectrum (A) and with
dark incubation time (B) ... 69 Fig. 3-4 Example of CO photoproduction from CDOM and particles as a function of the
nominal 50% cutoff wavelength ... 74 Fig. 3-5 Spectra of <pcdolll ). and <Pp). as a function of wavelength ... 75
XXVIII
Fig. 3-6 Lower and upper limits of <P edom) of each culture ... 76 Fig. 3-7 Comparison of <p), obtained in this study with previous studies ... 78 Fig. 3-8 Transmittance of landfast sea ice measured at the depth of lü cm from the
ice-water interface in Franklin Bay (southeastern Beaufort Sea) (A), the calculated solar irradiance (mol m-2 h-l
) at this depth (B) and the action spectra of CO
photoproduction (mol CO m-2 h-I) from CD aM and partic1es for P. taeniata at the lü-cm interface from the bottom (surface action spectra) (C) and in the bottom 10 cm layer (depth-integrated action spectra) (D) ... 82 Fig. 3-9 Relative contributions of particles and CDOM to total CO photoproduction
in the bottom 10 cm first-year sea ice under different snow cover conditions ... 83 Fig. 4-1 Sampling map ... 96 Fig. 4-2 Typical <1>edolll)' <1>1')' and <Pd spectra from the Mackenzie River estuary
(Sta. 697), Mackenzie Shelf (Sta. 280), and Canada Basin (Sta. 345 and 430) ... 112
Fig. 4-3 Comparison of mean <P of particles and CD aM and the ratio of the two among the three sub-regions ... 113
Fig. 4-4 Relationships between (J5cdom and acdolll,412 (A) and between ([>1' and al',412 (B) ... 115
Fig. 4-5. Modeled surface spectral solar irradiance (A), acdom and al' (B), surface CO
action spectra (C and D) and depth-integrated CO action spectra (E and F) ... .121 Fig. 4-6. Modeled vertical profiles of normalized solar irradiance (A), CO
photoproduction rate (mol CO m-3 h-l) from CD aM (B) and partic1es (C), the contribution of visible to full-spectrum CO photoproduction (D), and the ratio of full-spectrum particle-based to CDOM-based CO photoproduction (E) at
XXIX
Fig. 5-1 Map of sampling stations for the two cruises ... .141 Fig. 5-2 Measured acdolll.412 and ideal two end-member conservative mixing lines of
August cruise (A) and November cruise (B) ... 150 Fig. 5-3 Actual 5275295 and ideal two end-member conservative mixing lines of
August cruise (A) and November cruise (B) ... .151 Fig. 5-4 The distributions of ap.412 of different sizes «20 ,um, <lO,um and 10-20 ,um)
along with salinity for August cruise (A) and November cruise (B) ... .153 Fig. 5-5 CPedom.À'
cp
<10), andcp
<20./-spectra for August cruise (A) and November cruise (B)and seasonal comparison of
cp
edam). (C),cp
<10.1.. andcp
<20J (D) ... 159Fig. 5-6 Comparison CPcdol1l) (A) and
cp
<20). (B) spectra in this study withCPcdolll.À and CPt) spectra published in other studies ... 160 Fig. 5-7 (fi edom, cP <IO'/-and cP <20'/-at each station for August cruise (A) and November
cruise (B) ... 163 Fig. 5-8 Surface CO action spectra for August (A) and November (B), and
LISTE DES ABRÉVIATIONS
AQY apparent quantum yield
ASW artificial seawater
CB Canada Basin
ChIa chlorophyll a
CO carbon monoxide
CO2 carbon dioxide
DCM deep chlorophyll maximum
DMS dimethylsulfide
DOC dissolved organic carbon DOM dissolved organic matter HCP high chlorophyll phase LCP low chlorophyll phase MRE Mackenzie River estuary
MS Mackenzie Shelf
N20 nitrous oxide
NIAA natural ice algal assemblage
SGT-E salinity gradient transect-east channel SGT-W salinity gradient transect-west channel
XXXII
OCIO chlorine dioxide OCS carbonyl sulfide
OM organic matter
PAR photosynthetically active radiation POC particulate organic carbon
POM particulate organic matter SPM suspended particulate matter TMZ turbidity maxima zone
UVIUVR ultraviolet radiation (290- 400 nm) UVA ultraviolet-A (320- 400 nm) UVB ultraviolet-B (290- 320 nm)
LISTE DES SYMBOLES
Symbol Meaning
a absorption coefficient
aedam absorption coefficient of CDOM
a'et/am absorption coefficient of CDOM contained in ASW ai absorption coefficient of pure ice
anap absorption coefficient of non-algal particles
anap,/O absorption coefficient of non-algal particles with the size of < 10 /Am
anap ,/0-20 absorption coefficient of non-algal particles with the size between 10-20 /Am
anap<20 absorption coefficient of non-algal particles with the
size of < 20 /Am
ap absorption coefficient of particles
ap<IO absorption coefficient of particles with the size of < 10 /Am
ap,10-20 absorption coefficient of particles with the size between
10-20/Am
ap<20 absorption coefficient of particles with the size of < 20 ,
um
absorption coefficient of phytoplanktonic pigments
XXXIV
aphy</O absorption coefficient of phytoplanktonic pigments m-I with the size of < 10 ,um
aphy,/O-20 absorption coefficient of ph ytoplanktonic pigments m-I with the size between 1O-20,um
aphy<20 absorption coefficient of phytoplanktonic pigments m-I with the size of < 20 ,um
al absorption coefficient of the sum of acdo," , ap"and aw m-I
aw absorption coefficient of pure water m-I
A clearance area of filters for retaining partiel es m2
bbm particle backscattering coefficient m-I
f3
path length amplification factor unitlessBr brine volume fraction unitless
c volumne attenuation coefficient m-I
[Chi aLb column burden of chlorophyll a mgm-2 [Chi a]dw depth-weighted concentration of chlorophyll a ,ug L-I
[CO]cb column burden of CO ,umol m-2
[CO]dw depth-weighted concentration of CO nmolL-1
[DOCJcb column burden of CO gCm-2
[DOCJdw depth-weighted concentration of DOC mgCL-1
kd diffuse attenuation coefficient m-I
À wavelength nm
L light path length of irradiation cells m
OD"llIllk optical density of blank GFIF filter ODcdum optical density of CDOM
ODf optieal density of partic1es
Po modeled CO photoproduetion rate at the surface
Pedom,O modeled CO photoproduetion rate at the surface from CDOM
P <10,0 modeled CO photoproduetion rate at the surface for 10 /Am filtered samples
P <20,0 modeled CO photoproduetion rate at the surface for 20
/Am filtered samples
Pp,o CO photoproduetion rate at the surface from particles
Pz modeled CO photoproduetion rate at depth z
Peol depth-integrated CO photoproduetion rate ln the
euphotie zone
Pedom,eol depth-integrated CO photoproduetion rate ln the
euphotie zone from CDOM
P <IO,eul depth-integrated CO photoproduetion rate ln the
euphotie zone for 10 /Am filtered samples
P <20,eol depth-integrated CO photoproduetion rate tn the euphotie zone for 20 /Am filtered samples
Pp,COI depth-integrated CO photoproduetion rate ln the
euphotie zone from particles
'iP
eol area-integrated CO photoproduetion ln the euphotie zone"P area-inter:rated CO photoproduetion ln the euphotie
L.J cdolll'co/ ~ zone from CDOM xxxv unitless unitless unitless
XXXVI (j) edom <P <la (j) <20 cfJcdom
cp
<10 cf1 p (j)t Q Qa Qo Qo-QdO-area-integrated CO photo production ln the euphotic
zone from particles
CO apparent quantum yield (AQY) AQY from CDOM
AQY for 10 f.1m filtered samples AQY for 20 f.1m filtered samples AQY from particles
AQY from CDOM plus particles
solar irradiance spectrum-weighted mean (j) (290-600
nm)
solar irradiance spectrum-weighted mean (j) (290-600
nm) for CDOM
solar irradiance spectrum-weighted me an <P (290-600 nm) for 10 f.1m filtered samples
solar irradiance spectrum-weighted mean (j) (290-600 nm) for 20 f.1m filtered samples
solar irradiance spectrum-weighted mean <P (290-600 nm) for particles
solar irradiance spectrum-weighted mean (j) (290-600
nm) for CDOM plus particles
photon flux just below the upper surface of the vials photons absorbed by CDOM, or CDOM plus particles modeled surface solar photon fluxes
scalar photon flux just beneath the sea surface downwelling photon flux just beneath the sea surface
mol CO (mol photonst l mol CO (mol photonstl mol CO (mol photonstl mol CO (mol photonstl mol CO (mol photonstl mol CO (mol photonstl
mol CO (mol photonstl
mol CO (mol photonstl
mol CO (mol photonstl
mol CO (mol photonstl
mol CO (mol photonstl mol CO (mol photonstl
mol photons m-2 S-I nm-I mol photons m-2 S-I nm-I mol photons m-2 h-I nm-I mol photons m-2 d-I nm-I mol photons m-2 d-I nm-I
XXXVll
Q~ photon flux at depth
z
(m) mol photons m-2 d-' nm-I
5 cross-section of the irradiation cells m-2
5275295 the spectral slope of CDOM in the wavelength interval nm -I
of 275-295 nm
V filtered volume of seawater through GF/F filters m3
AI) surface CO action spectrum mol CO m-3 h
-' nm-I
A cdom,u surface CO action spectrum of CDOM mol CO m-2 h-' nm-I
A surface CO action spectrum of particles mol CO m-2 h
-' nm-I
{I,U
.IL CO action spectrum at depth z mol CO m-2 h -' nm-I
A COI depth-integrated CO action spectrum mol CO m-2 h-' nm-I A cdom,col depth-integrated CO action spectrum of CDOM mol CO m-2 h-' nm-I A p,COI depth-integrated CO action spectrum of particles mol CO m-2 h-' nm-I
CHAPITRE 1 INTRODUCTION
1.1 PHOTOCHIMIE DE LA MATIÈRE ORGANIQUE MARINE
Globalement, chaque année, les rivières transportent envIron 0,4 x 10¹⁵ g C de la matière organique (OM) (c'est-à-dire la matière organique dissoute (DOM) plus la matière organique particulaire (POM)) à l'océan (Hedges et al., 1997). Cependant, moins de la moitié des apports fluviaux de la OM (principalement POM) est enfouie dans les sédiments marins et seule une petite fraction de la MO dans l'océan ouvert est d'origine terrestre. Par ailleurs, seulement ~ 0,4% de la production primaire mondiale annuelle (PP) peut être en
fin de compte retenu dans les eaux profondes (Hedges, 2002). La majorité de la MO est reminéralisée en dioxyde de carbone (C02) durant le transport (OM terrestre) et après avoir
été produite (OM marine). Des études récentes apportent de plus en plus de preuves que la phototransformation (Mopper et Kieber, 2002; Zafiriou, 2002) et la consommation microbienne (Moran et al, 2000; Viihatalo et Wetzel, 2004; Benner et Kaiser, 2010) sont principalement responsables de la perte en OM dans les écosystèmes aquatiques.
Au cours des dernières décennies, beaucoup d'attention a été accordée à la photochimie de la fraction chromophorique de la DOM (CDOM) (Mopper et Kieber, 2002; Zafiriou, 2002; Zepp, 2003), puisque le CDOM est un important absorbeur du rayonnement ultraviolet (UV) et visible dans les eaux naturelles (Blough et al., 1993; Nelson et al., 1998; Siegel et al., 2002). Écologiquement parlant, l'absorption de la lumière par la CDOM, d'une part, protège les organismes marins contre les rayons UV nocifs (Schindler et al., 1996; Williamson et al., 1999) alors que, d'autre part, elle limite la production primaire en captant une partie du rayonnement actif pour photosynthèse (PAR, 400-700 nm) (Le Fouest et al.,
2
photoblanchiment) après photo-oxydation dans la couche supérieure des océans augmente
la pénétration du rayonnement UV et la disponibilité en PAR dans la colonne d'eau, ce qui
affecte l'écologie marine (Zepp, 2003). Biogéochimiquement, la photochimie du CDOM
peut directement reminéraliser la DOM en CO2 et en monoxyde de carbone (CO) (Miller et Zepp, 1995), et elle peut transformer le carbone organique dissous (DOC) réfractaire en substrats biolabiles (Kieber et al., 1989; Miller et al., 2002) ou vice versa (Kieber et al.,
1997; Benner et Biddanda, 1998). Ce processus peut également affecter le cycle de l'azote
marin en transformant l'azote organique dissous (DON) réfractaire en azote inorganique
biodisponible (par exemple ammonium, nitrite) (Bushaw et al., 1996; Vahatalo et Zepp, 2005; Xie et al., 2012) et par une demande accrue des bactéries pour les nutriments
inorganiques (Smith et Benner, 2005). En outre, la photochimie du CDOM modifie la toxicité et la biodisponibilité de certains métaux, tels que le fer et le cuivre, et par
conséquent leur sort et leur transport (Miller et aL, 1995; Voelker et Sedlak, 1995; Voelker et al., 2000). Certains biomarqueurs importants, tels que la lignine et les acides aminés,
peuvent être dégradés photochimiquement (Opsahl et Benner, 1998; Benner et Kaiser, 2010). Pendant la photodégradation du CDOM, des composés oxygénés très réactifs environnementalement et biologiquement (par exemple, HO, , 0; , et H202) sont formés
(Zafiriou et aL, 1984; Blough et Zepp, 1995), et influent sur divers processus biologiques et chimiques dans l'eau de surface éclairée par le soleil. De plus, les processus photochimiques impliquant le CDOM produisent (par exemple, monoxyde de carbone (CO) et sulfure de carbonyle (COS)) ou décomposent (par exemple sulfure de diméthyle (DMS))
certains gaz en traces actifs dans l'atmosphère qui affectent la composition chimique de l'atmosphère et le bilan radiatif de la terre (Thompson, 1992; Brimblecombe, 2003).
En contraste avec les énormes efforts et le progrès réalisés dans la photochimie du
CDOM, beaucoup moins d'attention a été accordée à la photodégradation de la POM. La similitude entre les spectres d'absorption de la POM et du CDOM (Kirk, 1980) suggère
toutefois que la POM pourrait subir des processus photochimiques analogues à ceux qui affectent la DOM. Par ailleurs, la photochimie de la POM pourrait être plus efficace grâce à
3
l'enrichissement de substrats organiques et/ou de métaux photoréactifs (par exemple Fe, Cu et Mn) dans des micro-environnements localisés sur ou à l'intérieur des particules (Zafiriou, 2002), comme le suggèrent par des études sur la photodégradation de chlorophylles et de lipides insaturés de phytoplancton (par exemple SooHoo et Kiefer, 1982; Nelson, 1993; Rontani, 2001). Les premières études ont montré que l'irradiation de détritus de certaines plantes vasculaires produit du CO (Tarr et al., 1995) et de CO2 (Anesio et al., 1999a) et libère du DOC (Anesio et al., 1999b). Plus récemment, quelques études ont rapporté d'importantes pertes de carbone organique particulaire (POC) et des productions de DOC, CO2, DON, et de CDOM issues de l'irradiation contrôlée des remises en suspension des
sédiments fluviaux et côtiers (Kieber et al., 2006 ; Riggsbee et al., 2008; Pisani et al., 2011; Shank et al, 2011; Estapà et al., 2012a). Des résultats similaires ont été rapportés pour les détritus de la flagellés verts Tetraselmis sp, avec la découverte additionnelle d'une production photochimique d'ammonium (c.-à-d une «photoammonification» ) (Mayer et al, 2009; Estapa et Mayer, 2010). Ces découvertes récentes ont stimulé le débat sur
l'importance de savoir si la photodégradation de la DOM peut effectivement affecter la matière organique et les cycles des éléments dans les écosystèmes des rivière et des océans (Kieber et al, 2006; Xie et Zafiriou, 2009; Pisani et al., 2011; Estapa et al., 2012a) Par ailleurs, il est important de comparer quantitativement la photochimie de la POM avec celle de la DOM, puisque les études précédentes évaluant les flux des principaux photoproduits (par exemple DIC, CO, NH/) ont généralement ignoré la contribution de la POM (Bélanger et al., 2006; Xie et Zafiriou, 2009; Xie et al., 2012).
1.2 CYCLE BIOGÉOCHIMIQUE DU CO DANS L'OCÉAN
Le CO est le principal puits de radicaux d'hydroxyde troposphériques (OH') et il réduit ainsi la capacité oxydante de l'atmosphère et agit comme un gaz à effet de serre indirect dans l'atmosphère (Thompson, 1992). L'océan a longtemps été reconnu comme une source de CO atmosphérique (Conrad et Seiler, 1980). Dans l'océan supérieur, le CO est produit
4
principalement par photolyse du CDOM (Conrad et Seiler, 1980; Zafiriou et al., 2003; Stubbins et al., 2006a; Xie et al, 2009a). En outre, le CO peut également être produit par la dégradation thermique de la DOM (également appelée production foncée) (Xie et al., 2005; Zhang et al., 2008; Zhang et Xie, 2012) Certains organismes marins peuvent aussi produire
du CO par prSlcessus biologiques (King et al., 2001; Gros et al., 2009), même si cela reste
toutefois à confirmer. Dans la couche supérieure des océans, la consommation microbienne
et l'échange air-mer sont les principaux puits de CO, et une petite partie du CO peut être transférée dans l'océan profond par le mélange vertical (Kettle, 2005). Les sources et les
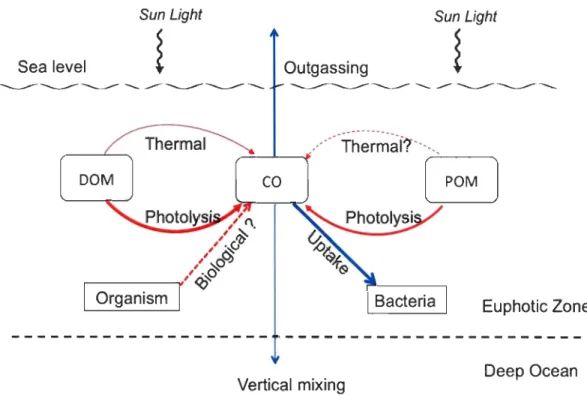
puits de CO actuellement connus dans l'océan sont présentés dans la figure. 1-1. Le cycle biogéochimique du CO des océans est important parce que 1) le CO est sans doute le sou
s-produit issue de la photodégradation du CDOM qui est mesurable avec le plus d'exactitude
et le photoproduit inorganique le plus abondant après le CO2 , 2) le CO peut être utilisé comme un proxy d'autres photoproduits qui sont plus difficiles à mesurer, comme le CO2
(Miller et Zepp, 1995; Mopper et Kieber, 2000) et la DOM biolabile (Miller et al., 2002), 3) le CO est une source d'énergie et carbone pour certains microbes marins (King et Weber, 2007; Moran et Miller, 2007), 4) le CO est une espèce utile pour évaluer la cinétique de
consommation microbienne des solutés dilués dans les eaux marines (Xie et al., 2009b), et
5) le CO est un excellent traceur pour modéliser les interactions dans la dynamique de mélange, l'optique, la photochimie, la biologie et les échanges gazeux air-mer dans la partie
supérieure de l'océan (Doney et al., 1995; Kettle, 2005).
1.3 MOTIV A TIONS
La photoproduction de CO à partir du CDOM a été largement étudiée dans différents écosystèmes aquatiques au cours des dernières décennies, y compris les lacs (BoUl-bonnière et al., 1997), les estuaires (Law et al., 2002; Zhang et al., 2006; Stubbins et al., 2011), les eaux côtières (Day et Faloona, 2009; Xie et al., 2009a), et l'océan ouvert (Zafiriou et al., 2003; Stubbins et al., 2006a). Des données récentes suggèrent que la photolyse de la POM,
5
comme le CDOM, peut également produire une quantité importante de CO (Xie et Zafiriou,
2009; Stubbins et al, 2011). Toutefois, Xie et Zafiriou (2009) n'ont rapporté que les
résultats préliminaires (c.-à-d la contribution globale des particules à la photoproduction
totale de CO) pour un nombre limité d'échantillons, tandis que Stubbins et al. (2011) ont
estimé la photoproduction potentielle de CO à partir des particules dans l'estuaire de la
Tyne en supposan que l'efficacité spectrale (c.-à-d le rendement quantique apparent, AQyl)
de la photoproduction de CO à partir de particules était la même que celle du CDOM. Par
conséquent, les résultats obtenus par ces études sont insuffisants pour les extrapoler à de
plus grandes échelles spatiales et temporelles.
Pour mieux comprendre la contribution des particules dans la photoproduction de CO et
donc l'implication de la photochimie des particules du cycle du carbone marin, d'autres
études sont nécessaires pour élucider 1) les spectres AQY de CO des particules sur de
grandes échelles spatiales et temporelles; 2 ) l'effet des propriétés des particules, comme
l'historique de lumière, l'origine (tenestre contre marine), la variabilité (les cellules vivantes
versus les détritus) et la taille des particules, sur les spectres AQY de CO; 3) les facteurs
environnementaux influençant la photoproduction de CO à partir des particules, tels que la
salinité, le pH et la température de l'eau.
Par ailleurs, une enquête préliminaire sur le tenain a révélé que le CO est enrichi dans
la couche inférieure de la banquise arctique de première année au cours de la prolifération
d'algues de glace et suggère que la photo-oxydation du CDOM pounait être un contributeur
majeur à l'accumulation de CO observée dans la glace de l'Arctique (Xie et Gosselin,
2005). Cependant, des mesures de tenain sur des échelles de temps et d'espace plus larges
sont nécessaires pour mieux comprendre la variabilité saisonnière et spatiale de la
distribution du CO dans la glace de mer et pour mieux contraindre son origine. En effet, je
fais l'hypothèse que les particules contribuent à J'enrichissement du CO à la base de la
1 CO AQY est défini comme le nombre de moles de CO produites par mole de photons absorbés par un ensemble donné de matériaux absorbant la lumière à lori.gueur d'onde À
6
glace de mer par les processus photochimiques et biologiques, en tenant compte des mêmes
procédés dans l'eau de mer (Xie et Zafiriou 2009; Gros et al, 2009.). En particulier, il faut
évaluer l'importance relative des particules pour la photoproduction totale de CO à la base
de la glace de mer, surtout pendant la prolifération d'algues de glace.
1.4 OBJECTIFS
Utilisant le CO comme proxy du processus de photodégradation du CDOM, l'objectif global de ce projet est de mieux comprendre l'importance relative des particules et la
photochimie de CDOM dans divers écosystèmes marins. L'objectif sera atteint par les objectifs spécifiques suivants:
1) Examiner la variation spatiotemporelle de CO dans les glaces de mer de première année dans le sud-est (SE) de la mer de Beaufort, et évaluer la production nette
de CO dans la glace de mer pendant l'efflorescence des l'algales de glace;
2) Déterminer les spectres AQY de CO à partir du CDOM et les particules récoltées
sur les cultures d'algues de glace dans les phases croissantes (exponentielles et
décroissantes) et modéliser l'importance relative des particules et du CDOM dans
la photoproduction de CO dans la glace de mer de fond au cours des
efflorescences d'algues de glace;
3) Déterminer les spectres AQY de CO à partir du CDOM et des particules dans
l'eau de mer en surface et au maximum profond de chlorophylle (DCM) dans le
SE de la mer de Beaufort;
4) Déterminer les spectres AQY de CO du CDOM et les particules fractionnées par
7
5) Modéliser la contribution relative des particules et du CDOM à la photoproduction totale de CO dans la colonne d'eau de mer du SE de la mer de Beaufort et dans l'estuaire du Delaware.
8 Sun Light Sea level
!
,'0"
~. ,'. (J'li ,' ~"
~o"
<iJ'0
'--O-r-g-a-ni-s-m--vr Outgassing Vertical mixing Sun Light!
Euphotic Zone Deep OceanFig. 1-1 Known sources and sinks of CO in the ocean. Red arrows denote sources, blue arrows den ote sinks, and the size of arrows represents the relative strength of the sources or sinks. "?" denotes the pathway needs to be further confirmed.
9
Introduction
1.1 Photochemistry of marine organic matter
Globally, the rivers transport approximately 0.4 x 10¹⁵ g C of organic matter (OM) (i.e. dissolved organic matter (DOM) plus particulate organic matter (POM» to the ocean per year (Hedges et al., 1997). However, Iess than half of the riverine input of OM (mainly POM) is buried in marine sediment and only a small fraction of OM in the open ocean is of tenestrial origin. Furthermore, 0.2 x 10¹⁵ g Ca·!, only ~ 0.4% of the yearly global plimary production (PP) can be uitimately sequestrated to the deep ocean (Hedges, 2002). The majority of OM is remineralized to carbon dioxide (C02) during transport (tenestrial OM) and after being produced (matine OM). Recent studies provide growing evidence that phototransformation (Mopper and Kieber, 2002; Zafiriou, 2002) and microbial consumption (Moran et al., 2000; Vahatalo and Wetzel, 2004; Benner and Kaiser, 2010) are mainly responsible for the loss of terrestriai and marine OMo
During the past decades, mu ch attention has been paid to chromophoric DOM (CDOM) photochemistry (Mopper and Kieber, 2002; Zafiriou, 2002; Zepp, 2003), since CDOM is an important Iight absorber at both the ultraviolet (UV) and visible wavelengths in natural waters (Blough et aL, 1993; Nelson et al., 1998; Siegel et al., 2002). Ecologically, the absorption of light by CDOM, on one hand, protects marine organisms against deleterious UV radiation (Schindler et al., 1996; Williamson et al, 1999) whiIe, on the other hand, it curbs primary production if the availability of photosynthetically active radiation (PAR,
400-700 nm) Iimits photosynthesis (Le Fouest et al., 2010; Mei et al., 2010). The decrease in CDOM absorbance (i.e. photobleaching) after photooxidation in the upper ocean increases the penetration of UV radiation and the availability of PAR in the water column, thereby affecting marine ecology (Zepp, 2003). Biogeochemically, CDOM photochemistry can directly remineralize DOM to CO2 and carbon monoxide (CO) (Miller and Zepp, 1995), and convert refractory dissolved organic carbon (DOC) to bio-labile substrates
10
(Kieber et al., 1989; Miller et al., 2002) or vice versa (Kieber et al., 1997; Benner and Biddanda, 1998). This process can also affect marine nitrogen cyc1ing by transforming refractory dissolved organic nitrogen (DON) to bio-available inorganic nitrogen (e.g. ammonium, nitrite) (Bushaw et al., 1996; Vahatalo and Zepp, 2005; Xie et al., 2012) and through enhanced bacterial demand for inorganic nutrients (Smith and Benner, 2005). Furthermore, CDOM photochemistry alters the toxicity and bioavailability of certain
nietals, such as Fe and Cu, and hence their fate and transport (Miller et al., 1995; Voelker and Sedlak, 1995; Voelker et al., 2000). Some important biomarkers, such as lignin and amino acids, can be degraded photochemically (Opsahl and Benner, 1998; Benner and Kaiser, 2010). During CDOM photodegradation, environmentally and biologically reactive oxygen species (e.g. HO·, 0; , and H202) are fOïmed (Zafiriou et al., 1984; Blough and
Zepp, 1995), which influence various biological and chemical processes in the sunlit
surface water. In addition, CDOM photoprocesses produce (e.g. carbon monoxide (CO) and carbon yi sulfide (OCS» or decompose (e.g. dimethyl sulfide (DMS» certain atmospherically active trace gases that affect the chemical composition of the atmosphere and the Earth's radiative balance (Thompson, 1992; Brimblecombe, 2003).
In contrast to the enormous efforts and progress made in CDOM photochemistry, much less attention has been paid to POM photodegradation. The similarity in the absorption spectrum between POM and CDOM (Kirk, 1980), however, suggests that POM may
undergo photochemical processes analogous to those of CDOM. Besides, POM
photochemistry could be more efficient due to enrichment of organic substrates and/or photoreactive metals (e.g. Fe, Cu, Mn) in 10calized microenvironments on or within partic1es (Zafiriou, 2002), as suggested by studies on photodegradation of chlorophylls and
unsaturated lipids of phytoplankton (e.g. SooHoo and Kiefer, 1982; Nelson, 1993; Rontani,
2001). Early studies have demonstrated that irradiation of detritus of certain vascular plants
produces CO (TaIT et al., 1995) and CO2 (Anesio et al., 1999a) and releases DOC (Anesio
et al., 1999b). More recently, a few groups have reported significant losses of particulate
Il
irradiation of resuspensions of river and coastal sediments (Kieber et al., 2006; Riggsbee et al., 2008; Pisani et al., 2011; Shank et al., 2011; Estapa et al., 2012a). Similar results have been reported for the detritus of green flagellate Tetraselmis sp., with an added finding of ammonium production (i.e. photoammonification) (Mayer et al., 2009; Estapa and Mayer, 2010). These recent findings have stimulated discussion on whether POM photodegradation can effectively affect organic matter and elemental cycles in river and oceanic ecosystems (Kieber et al., 2006; Xie and Zafiriou, 2009; Pisani et al., 2011; Estapa et al., 2012a). MOl"eOVer, it is important to quantitatively compare POM with DOM photochemistry, since previous studies assessing fluxes of major photoproducts (e.g. DIC, CO, NH/) usually ignored the POM contribution (Bélanger et al., 2006; Xie et Zafiriou, 2009; Xie et al., 2012).
102 Biogeochemical cycling of CO in the ocean
CO is the main sink of tropospheric hydroxide radicals (OHO
) and hence reduces the oxidizing capacity of the atmosphere and acts as an indirect greenhouse gas in the atmosphere (Thompson, 1992). The ocean has long been recognized as a source of atmospheric CO (Conrad and Seiler, 1980). In the upper ocean, CO is produced primarily via photolysis of CDOM (Conrad and Seiler, 1980; Zafiriou et al., 2003; Stubbins et al., 2006a; Xie et al., 2009a). In addition, CO can also be produced by thermal degradation of DOM (also called dark production) (Xie et al., 2005; Zhang et al., 2008; Zhang and Xie, 2012). Certain marine organisms may also produce CO by biological processes (King et al., 2001; Gros et al., 2009), however, this pathway needs to be further confirmed. In the upper ocean, microbial uptake and air-sea exchange are the main sinks of CO, and a smalt portion of CO can be transferred into the deep ocean by vertical mixing (Kettle, 2005). The currently known sources and sinks of CO in the ocean are shown in Fig. 1-1. The biogeochemical cycle of oceanic CO is important because 1) CO is arguably the most reliably measured and the second most abundant inorganic carbon photoproduct of CDOM (only after CO2), 2) CO can be used as a proxy of other major but more-difficult-t
o-12
measure CDOM photoproducts, such as CO2 (Miller and Zepp, 1995; Mopper and Kieber, 2000) and bio-labile DOC (Miller et al., 2002), 3) CO is a potential energy and carbon source of certain marine microbes (King and Weber, 2007; Moran and Miller, 2007), 4) CO is a useful species for probing microbial uptake kinetics of dilute solutes in marine waters (Xie et al., 2009b), and 5) CO is an excellent tracer for modeling the interactions among mixing dynamics, optics, photochemistry, biology, and air-sea gas exchange in the upper-ocean (Doney et al., 1995; Kettle, 2005).
1.3 Motivations
Previous studies mainly focused on CO photoproduction from CDOM ln vanous aquatic ecosystems in the past decades, including lakes (Bourbonniere et al., 1997), estuaries (Law et al., 2002; Zhang et al., 2006; Stubbins et al., 2011), coastal waters (Day and Faloona, 2009; Xie et al., 2009a), and the open ocean (Zafiriou et al., 2003; Stubbins et al., 2006a). Recent evidence suggests that photolysis of POM, like CDOM, can also produce significant amount of CO (Xie and Zafiriou, 2009; Stubbins et al., 2011).
However, Xie and Zafiriou (2009) only reported preliminary results (i.e. the overall contribution of particles to total CO photoproduction) with limited samples, while Stubbins et al. (2011) estimated the CO photoproduction from particles in the Tyne Estuary based on the assumption that the spectrally resolved efficiency (i.e. apparent quantum yield, AQY)
of CO photoproduction from particles was the same as that of CDOM. Hence, the results obtained by these studies are inadequate to extrapolate to larger spatial and temporal scales. To better understand the contribution of particles to CO photoproduction and hence the implication of particle photochemistry to marine carbon cycling, more studies are needed to elucidate 1) the CO AQy2 spectra of particles on larger spatial and time scales; 2) the effect
2 CO AQY is defined as the number of moles of CO produced per mole of photons absorbed by a
13
of particle properties, such as light history, origin (terres trial vs . marine), viabil ity (living cells vs. detritus) and particle size, on CO AQY spectra; and 3) the environmental factors
influencing CO photoproduction from particles, such as water salinity, pH and temperature. Moreover, a preliminary field survey revealed that CO is enriched in the bottom layer
of Arctic first-year sea ice during ice algal blooms and suggested that CDOM photooxidation cou Id be a major contributor to the CO accumulation observed (Xie and Gosselin, 2005). Field measurements on larger time and space scales are required to better understand the seasonal and spatial variability of the sea-ice [CO] distribution, to better
constrain its source strength. In addition, particles may also be involved in the enrichment of CO in bottom sea ice by photochemical and biological processes, considering the same processes in seawater (Xie and Zafiriou, 2009; Gros et al., 2009). In particularly, the relative importance of particles to total CO photoproduction in bottom sea ice, especially during ice algal blooms, needs to be assessed.
1.4 Objectives
Using CO as a targeted photoproduct, the overall goal of this project is to better understand the relative importance of particle and CDOM photochemistry in diverse marine
ecosystems. The goal will be accomplished by the following specific objectives:
1) Investigate the spatiotemporal variation of CO in first-year sea Lce In the
southeastern (SE) Beaufort Sea and assess the net production of CO in sea ice during ice al gal blooms;
2) Determine CO AQY spectra of both CDOM and particles harvested from ice algal cultures at exponential and senescent phases and model the relative
importance of particles and CDOM in CO photoproduction in bottom sea ice during ice algal blooms;
3) Determine CO AQY spectra of both CDOM and particles in surface and deep
14
4) Determine CO AQY spectra of CDOM and size-fractionated particles Ln the Delaware Estuary;
5) Model the relative contribution of particles and CDOM to total CO
photoproduction in the water column of the SE Beaufort Sea and Delaware estuary.
CHAPITRE 2
VARIATIONS SPATIOTEMPORELLE DU CARBONE ORGANIQUE DISSOUS
ET MONOXYDE DE CARBONE DANS LA GLACE DE MER DE PREMIÈRE
ANNÉE DANS L'OUEST DE L'ARCTIQUE CANIDIEN
SPATIOTEMPORAL VARIATIONS OF DIS SOL VED ORGANIC CARBON AND CARBON MONOXIDE IN FIRST-YEAR SEA ICE IN THE WESTERN
CANADIAN ARCTIC
Article Publié dans Journal of Geophysical Research
Song, G., H. Xie, C. Aubry, Y. Zhang, M. Gosselin, C. J. Mundy, B. Philippe, and T. N.
Papakyriakou, 2011. Spatiotemporal variations of dissolved organic carbon and carbon
monoxide in first-year sea ice in the western Canadian Arctic, J. Geophys. Res., 116,