MIF PROGRAM
R
ESEARCH
P
APER
Academic Year 2016 - 2017
Ambiguity aversion and the Home-bias
puzzle
Literature review and empirical study:
Dependency of portfolio allocations in foreign
equities on ambiguity preferences
Florian MASSÉ
Under the supervision of
Prof. PEIJNENBURG
I investigate the effect of ambiguity preferences on foreign equity allocations of individual investors, thanks to a representative US survey dataset from Dimmock et al. (2015). A statistical analysis confirms predictions from behavioural research on the home-bias puzzle: even among foreign equity owners, ambiguity aversion prompts investors to allocate a lower proportion of their equity holdings to the international market relative to the domestic U.S. market. The correlation is statistically significant at the 1% confidence level; on average, ambiguity-averse respondents only allocate 28% of their portfolios to foreign stocks, while this proportion increases to 38% for ambiguity-seeking respondents.
This Research Paper was made possible by HEC Paris, and was written as part of the “Grande Ecole” Programme, in the Finance Major.
I first want to give a special thanks to Dr. Kim Peijnenburg, Associate Professor at HEC Paris, who was my supervisor during this research.
I also want to thank the Majeure Finance team for their help and support throughout this year: Mrs. Bernadette Georges, Mrs. Roselyne Minet, Dr. Alexei Ovtchinnikov, Mr. Ferdinand Petra, Mr. Olivier Bossard.
ABSTRACT II
ACKNOWLEDGEMENTS III
SUMMARY IV
I- INTRODUCTION 1
-II- EXPLORATORY BIBLIOGRAPHY – THEORY 2
-2.1. INTRODUCTION ON BEHAVIOURAL FINANCE -2-
2.2. AMBIGUITY AVERSION -2-
2.2.1. DEFINITION – WHY DOES AMBIGUITY AVERSION COMPLEMENT RISK AVERSION? -2-
2.2.2. AMBIGUITY AVERSION SPECIFICALLY HOLDS IN A COMPARATIVE CONTEXT -4-
2.2.3. IMPACTS OF AMBIGUITY AVERSION ON INDIVIDUALS’ PORTFOLIO CHOICES -5-
2.3. HOME-BIAS -6-
2.3.1. THE START OF RESEARCH ON THE HOME-BIAS PUZZLE -6-
2.2.2 RATIONAL FACTORS TO THE TEST -9-
2.2.3 HOME-BIAS EXPLAINED BY BEHAVIOURAL FINANCE -12-
III- HOW CAN AMBIGUITY AVERSION EXPLAIN HOME-BIAS? 15
-3.1. SYNTHESIS OF THE BIBLIOGRAPHY EXPLORATION -15-
3.2. STUDY OF TWO EMPIRICAL PAPERS -16-
3.2.1. IN FRANCE –ASSURANCE VIE -16-
3.2.2. IN THE UNITED STATES –AMERICAN LIFE PANEL -17-
IV- STATISTICAL STUDY 20
-4.1. CREATION OF A DATASET -20-
4.1.1. RE-USE OF DIMMOCK ET AL. DATASET -20-
4.1.2. SURVEY FROM THE AMERICAN LIFE PANEL -21-
4.1.3. DATA TREATMENT -22-
4.2. STATISTICAL ANALYSIS -22-
4.2.1. SUMMARY OF FOREIGN STOCK PROPORTION -23-
4.2.2. COMPARISON OF MEANS AGAINST AMBIGUITY PREFERENCES -23-
APPENDIX 28
-BIBLIOGRAPHY 31
-I- INTRODUCTION
The home-bias puzzle has been one of the most researched puzzles in finance since French and Poterba (1991) first brought it to light. It remains nevertheless mostly unsolved.
I myself have been invested in the stock market for 5 years. Even if my education at HEC Paris has helped me not to fall into the trap of most common psychological biases – e.g. disposition effect, overconfidence –, I realized that I was critically affected by home-bias as the entirety of my portfolio is invested in the French market. This first sparked my interest in this topic and I therefore decided to dedicate my research paper of the Majeure Finance to this matter.
In the wake of the globalisation of finance, a significant part of rational explanations to the home-bias puzzle has been disproved. It is now behavioural finance that provides most promising axes for research. The question is not “what are the obstacles to foreign investment?” anymore, but: “what are the preferences of individuals that encourage them to over-invest in their domestic markets?”
My thesis supervisor, Dr. Kim Peijnenburg, has been studying ambiguity aversion and its impacts on portfolio choices of individuals for a few years. Even if risk preferences are more widely studied, an investor faces both risk and ambiguity when making his choices: for most investment decisions, the probability distribution of future outcomes is vague or unknown, and the investor takes a decision with respect to his ambiguity preferences, consciously or not. In one of her most recent papers, Ambiguity aversion and household portfolio choice puzzles: Empirical evidence, Dimmock et al. (2015) empirically uncover a link between ambiguity preferences and several portfolio choice puzzles.
One of them is the home-bias puzzle: ambiguity aversion seems to negatively affect the probability for an individual to own foreign stocks. The aim of this research paper is therefore to investigate the following issue:
Is ambiguity aversion a significant factor for home-bias?
I study this question thanks to a thorough exploration of existing research on home-bias and ambiguity aversion, and further test it through a statistical study of empirical data focusing on foreign equity holders.
II- EXPLORATORY BIBLIOGRAPHY – THEORY
2.1. INTRODUCTION ON BEHAVIOURAL FINANCE
“My belief is that economics is somewhat more vulnerable than the physical sciences to models whose validity will never be clear, because the necessity for approximation is much stronger than in the physical sciences, especially given that the models describe people rather
than magnetic resonances or fundamental particles. People can just change their minds and behave completely differently. They even have neuroses and identity problems, complex
phenomena that the field of behavioral economics is finding relevant to understanding economic outcomes.”
Robert J. Shiller, Nobel Prize in Economic Sciences, 2013
Finance is a science like no other. Conventional theories, like Sharpe’s capital asset pricing theory or Miller & Modigliani’s arbitrage principles, rely on one assumption: investors behave rationally and choose the best alternative given its utility and its associated risk. But in the wake of the 1980s, several empirical studies raised inconsistencies in these theories. Thus, a new idea emerged: people often make irrational and unpredictable financial decisions because they are influenced by their emotions.
The field of behavioural finance therefore aims at incorporating psychological and cognitive theories in conventional economics to try and explain biases observed in individuals’ behaviour inconsistent with traditional finance.
2.2. AMBIGUITY AVERSION
“Better the devil you know than the devil you don't”
English proverb
2.2.1. Definition – why does ambiguity aversion complement risk aversion?
Risk aversion has long been studied in economics and finance as the main parameter of an individual’s utility function. The general population is risk-averse; this means that the average individual will prefer a bargain with a lower expected payoff if it is more certain than another
bargain. The straightest example is the preference between a risky alternative and its expected value.
But what does happen when the probability distribution of outcomes is vague or unknown? Here comes the difference between risk and ambiguity: while for risky events, the probabilities of different outcomes are known, they are unknown for ambiguous events. After all, this last case usually holds true: only games of chance, generally used for measuring risk aversion, have precise probabilities of outcomes. In everyday life, decisions makers are constantly exposed to ambiguous issues.
The Ellsberg paradox1 is traditionally used to illustrate the difference between risk aversion and
ambiguity aversion, and to evaluate the latter: (see figure 1)
Figure 1 – Illustration of the two-urns Ellsberg paradox (From Data Driven to Data Science Driven, D. Dietrich) “The urn on the left contains ten black marbles and ten white marbles. The urn on the right contains twenty marbles of an unknown ratio of black to white. Draw a black marble to win $100.
Which urn do you choose from?”
Even though both possibilities are risky – the inferred probability to win is 50% –, an ambiguity-averse person will choose the left urn. This holds whatever the winning colour: the results are therefore inconsistent with expected utility theory, since they involve that subjective probabilities of black and white are greater in the 10-10 urn than in the right urn, and therefore cannot sum to 1 for both urns.
Since the alternative is between a risky lottery and an ambiguous lottery, this experience correctly elicits ambiguity aversion independently from risk aversion.
2.2.2. Ambiguity aversion specifically holds in a comparative context
A bargain with a known probability distribution is evaluated by an individual against its risk: the individual will associate a risk-level to this bargain depending on his risk aversion.
The relation is more ‘ambiguous’ for ambiguity aversion: in Ambiguity aversion and comparative ignorance (1995), C. Fox and A. Tversky demonstrate that “stand-alone” ambiguity aversion does not exist, “ambiguity aversion is produced by a comparison with less ambiguous events or with more knowledgeable individuals.”2
They show that individuals do not evaluate the ambiguity of a choice ‘objectively’, but against the subjective skills they think they have for making this choice. They back this assumption on Heath and Tversky’s work (1991), who compare people’s tendency to bet on their own beliefs rather than on chance:
“Contrary to ambiguity aversion, they found that people prefer to bet on their vague beliefs in situations where they feel especially competent or knowledgeable, although they prefer to bet
on chance when they do not. In one study, […] subjects who were preselected for their knowledge of politics and lack of knowledge of football preferred betting on political events rather than on chance events that they considered equally probable. However, these subjects
preferred betting on chance events rather than on sports events that they considered equally probable.”2
As a result, Fox and Tversky are able to build a link between ambiguity aversion and confidence: it is when an individual compares his knowledge on separate events and realize there is a “contrast between [his] states of knowledge” that he starts feeling ambiguity aversion towards the event for which he also feels incompetent. This also holds when comparing competences with more knowledgeable individuals.
Their conclusion is the comparative ignorance hypothesis:
“Thus, ambiguity aversion represents a reluctance to act on inferior knowledge, and this inferiority is brought to mind only through a comparison with superior knowledge about
other domains or of other people.”2
The Ellsberg paradox we studied earlier is a perfect illustration of this hypothesis: it is the comparison with the left urn that makes the right urn ambiguous. Moreover, an individual
familiar with this experience and exposed to the right urn alone will spontaneously make the mental comparison with a known 50-50 urn.
2.2.3. Impacts of ambiguity aversion on individuals’ portfolio choices
We have already highlighted the difference between ambiguity aversion and risk aversion. The average investor is risk-averse and should act rationally by diversifying to eliminate idiosyncratic risk.
People usually think that ambiguity aversion reinforces risk aversion: after all, is uncertainty not a risk? Ambiguity aversion has thus been studied as a way of explaining the equity premium puzzle: in the past decades, statistical models indeed demonstrate that the equity premium should be far lower than observed when assuming realistic risk aversion levels. Chen and Epstein (2002) suggested that “part of the [equity] premium is due to the greater ambiguity associated with the return to equity, which reduces the required degree of risk aversion”3 to
solve the puzzle.
Nevertheless, more recent research shows that ambiguity aversion leads in fact individuals to take on more risks. For instance, Gollier (2008) demonstrates that “contrary to the intuition, ambiguity aversion may yield an increase in the demand for the risky and ambiguous asset” and that “it is not true in general that ambiguity aversion raises the equity premium in the economy”4. As such, ambiguity aversion can be regarded as a psychological bias.
These theoretical results are confirmed by observation of portfolio choices. Dimmick, Kouwenberg, Mitchell and Peijnenburg (2015) show empirical evidence that there is a positive correlation between ambiguity aversion and under-diversification as well as own-company stock ownership, and a negative correlation between ambiguity aversion and foreign stock ownership: “[this] provide[s] evidence that ambiguity aversion is not simply a proxy for risk aversion, because, for foreign and own-company stock ownership, the theoretical effect of risk aversion is exactly opposite to that of ambiguity aversion.”5. Massa and Simonov (2004) had
already written about Swedish investors whose investments are disproportionately drawn to the sector they work in. The saying “putting all their eggs in the same basket” has a concrete meaning here.
3 (Chen & Epstein, 2002) 4 (Gollier, 2008)
More broadly, it has been demonstrated that ambiguity-averse individuals tend to under-participate in the stock market. Here, research shows a strong link with the competence hypothesis:
“Although people are generally ambiguity-averse toward tasks for which they do not feel competent, they are much less ambiguity- averse toward tasks for which they believe they have expertise. […] Hence, we expect that higher stock market competence will moderate the
relation between a respondent’s ambiguity aversion toward Ellsberg urns and his ambiguity aversion toward stock investments. […] We find that the negative effect of ambiguity aversion
on stock market participation is stronger for people with lower stock market competence, consistent with the implications of the competence hypothesis.”
2.3. HOME-BIAS
2.3.1. The start of research on the home-bias puzzle
History has shown that the world does not always follow a homogenous economic trajectory: the example of Japan is appropriate. While in the 1980s, economists wondered when Japan would top the United States as the first economic power in the world, the asset price bubble of 1986-1991 finally collapsed and led the 1990s to be known as the “lost decade” for the country. Meanwhile, China was able to successfully leverage globalization to eventually overtake Japan’s second economic power position in 2013. Globalization, rather than smoothing out the world economy, has prompted large economic upheavals.
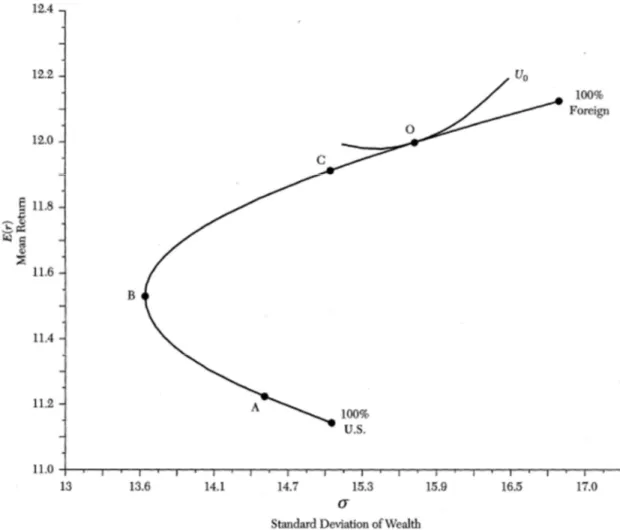
Correlation being indeed rather low between different economic markets, it is easily demonstrated that every investor can benefit from international diversification to bear lower risks. Karen K. Lewis, in her paper Trying to Explain Home Bias in Equities and Consumption (1999), made a simplified but illustrative version of the “efficient frontier” showing these benefits. Figure 2, taken from this paper, shows the risk-return trade-off between a US mutual fund invested in the S&P 500 and a foreign mutual fund invested in the EAFE (Europe, Australia, and Far East) index from Morgan Stanley. It is based on annualized monthly returns from January 1970 to December 1996. We can see that a 100%-US portfolio is obviously suboptimal, compared to every portfolio around the minimum-variance portfolio B, corresponding to 39% of foreign equity.
Figure 2 – Risk return trade-off portfolios of U.S. and foreign Mutual Funds6
The home-bias puzzle is therefore brought to light by French and Poterba in 1991: despite those evident advantages of cross-border investments (the average pairwise correlation between equity markets in the United States, the United Kingdom, France and Germany is 0.502 between 1975 and 1989), investors mainly own domestic equity. This inclination is unambiguous. In 1991, French and Poterba showed that the domestic ownership proportion is consistently over 75% for the five largest stock markets: 79% in Germany, 89% in France, 92% in the United Kingdom and in the United States, and an impressive 96%-share in Japan. Thus, they were able to estimate how much foreign equity investors hold in each country. The results are striking: while British investors hold 18% of international equity, U.S investors only hold 6% of their portfolio abroad and Japan investors 1.9%. On figure 2, this average portfolio held by U.S. investors is shown as point A and is dominated whatever the investor’s preferences.
Those proportions are even more astonishing as globalization was already largely underway. Institutional factors that could limit cross-border investment had already started being eliminated, with world governments promoting free market thanks to lenient monetary and fiscal policies, and to a number of trade agreements. Moreover, technology advancements and the globalization of information flows eased international trading: NASDAQ became the first electronic stock market in the world in 1971.
Holding the assumption that investors, regardless of their country of origin, rationally want to maximize their expected utility, French and Poterba computed the returns across countries expected by investors from the world’s five largest markets. They write:
“For U.S. investors, the annual expected return on U.S. stocks must be 250 basis points above the expected return on Japanese stocks. […] The differences in expectations for different investors judging the same market are also striking. Our estimates suggest that Japanese investors, for example, expect returns from Japanese stocks which are more than 300 basis
points greater than the returns U.S. investors expect.”7
Of course, a fraction of these differences can be explained through fiscal factors and transaction costs, but those factors cannot explain such striking differences: for example, a rational preference for liquid markets would not incline investors toward their own domestic market but towards the most liquid market.
Those observations led French and Poterba to hypothesize that this low diversification is linked to investors’ preferences rather than rational constraints. They are therefore first to introduce the possibility of a psychological bias:
“One important possibility is that return expectations vary systematically across groups of investors. […] They may impute extra “risk” to foreign investments because they know less about foreign markets, institutions, and firms. […] I. Gatti and A. Tversky (1990) present
evidence that households behave as though unfamiliar gambles are riskier than familiar gambles, even when they assign identical probability distributions to the two gambles.”7
This paper paved the way for a lot of research on the home-bias puzzle. Existing bibliography tends to confirm French and Poterba’s intuition: in the next part, I will discuss papers challenging so-called “rational” reasons to make home-biased investments; then, I will study how behavioural finance might be a better explanation to the home-bias puzzle.
2.2.2 Rational factors to the test
Most conventional economic theories are based on the premise that individuals, and by extension investors, behave rationally. This means that all their choices have one goal: reach an optimal level of utility, be it material or emotional.
It is therefore logical that research first focused on finding rational and reasonable explanations to the home-bias puzzle, not yet included in the standard portfolio theory: as already stated, investors indeed invest less in foreign assets than predicted by theory. Those explanations can be roughly put in three categories:
- An investor shows a home-bias because he wants in fact to hedge domestic risks with home equity;
- The utility increment of international diversification is nil because the costs of this diversification exceed the gains;
- When allocating their equity portfolio, investors consider an “estimation risk” for foreign returns, which results in a lower proportion of international equity.
In her paper Trying to Explain Home Bias in Equities and Consumption (1999), Karen K. Lewis made a thorough summary of the research on those factors and why they cannot explain the whole home-bias puzzle: I again use her work, to show that purportedly rational factors do in fact not hold and that it is necessary to seek further afield to understand the puzzle.
a- Hedging domestic risks
The main domestic hedges discussed in the literature are hedges against inflation, hedges against non-tradable wealth (human capital), and hedges with foreign returns implicit in equities of domestic firms that have overseas operations8.
Domestic inflation risk stems from deviations from purchasing power parity normally used in the International CAPM: empirical literature shows that in medium-term, investors do not perceive the same real returns and that purchasing power parity does not hold. Thus, investors chose to invest in domestic assets to hedge domestic inflation. Anyway, Cooper and Kaplanis (1994) show that inflation hedge motives do not explain home bias at all9, thanks to an empirical
study using foreign equity holdings across eight major countries.
8 (Lewis, 1999)
Some components of wealth are not traded in financial markets: human capital is a good instance. These components are therefore not considered in the CAPM, and since they are country-specific, they might explain part of the home bias. Baxter, Jermann and King (1998) show that this assumption does not hold for human capital: human capital returns have a very high correlation with the domestic stock market returns, and are almost independent from foreign stock returns10.
Finally, it is a common belief that holding stocks of international companies allow to gain international diversification even though they are part of the domestic index: those companies often have most of their operations overseas. Anyway, those stocks usually have betas relative to the domestic index close to one. Since we have seen that the correlation between markets is low (around 0.5), this means that those multinationals do not offer much diversification and that it is necessary to hold assets not belonging to the domestic index.
b- Diversification costs cancel utility increments
We see in figure 2 that gains from diversification seem to be easy to obtain and quite substantial: a shift from a 100%-US portfolio to portfolio C allows to keep the same variance and to gain 0,8% of expected return per year: transaction costs would have to be huge to offset those gains.
Empirical studies have anyway demonstrated that taxes and similar restrictions cause a segmentation of markets.
“Indeed, governmental capital controls have historically generated significant hurdles to international investment. […] More recently, however, the international trend has been toward more deregulation among both the capital markets of developed countries and the
developing countries’ so called emerging markets.”11
The decrease in such restrictions should therefore unify world’s markets and be accompanied by a powerful increase in foreign investments. Reports from the IMF show that this improvement exists, but that the home-bias is still very strong and unexplained by diversification costs.
Another cost of international diversification is to acquire information about foreign equity markets. Even though this factor can be valid for individual investors, it seems far-fetched for
10 (Baxter, Jermann, & King, 1998) 11 (Lewis, 1999)
institutional investors. In Information immobility and the home bias puzzle (2005), Van Nieuwerburgh and Veldkamp write:
“If producing home information required one analyst, and foreign information required one analyst and one translator, then the translator’s salary would have to be 6.3 times the
analyst’s [to justify the existing home-bias in the U.S.]”12
This is not plausible. Moreover, largest foreign companies can be traded directly in the US thanks to the use of ADRs (American Depositary Receipts): they then have to publish annual reports using GAAP accounting norms, and the additional cost of acquiring information is inexistent.
c- Estimating foreign returns is more complex
One dimension of acquiring information on foreign assets is also to estimate their returns. Per several papers, such as Bekaert and Urias (1996), and Gorman and Jorgensen (2002), home bias might not exist at all because the improvement in portfolio performance thanks to international diversification is not statistically significant1314.
But subsequent research using a Bayesian approach – a method of statistical inference allowing to deduct the probability of an event thanks to other already-estimated events, or to update the probability for a hypothesis as more evidence or information becomes available – indicates that difficulties encountered when measuring returns are not a factor for home-bias:
“Pastor (1998) examines the case of a US investor who must decide between US and foreign equity markets. Before looking at the data, the investor […] could be viewed as one whose prior beliefs are that he can do no better than the domestic market. Pastor then considers how
the portfolio allocation of this investor into foreign equities will change as his prior views on the variability of these returns increase. While the standard deviation of foreign risk-adjusted excess returns in the data exceeds 3 percent per annum, Pastor finds that the investor's prior view about the distribution must be no greater than 1 percent per annum to explain US home bias. Moreover, an investor with diffuse views about foreign returns would place 47 percent
of his portfolio in foreign equities, far exceeding the observed share of 8 percent."15
12 (Van Nieuwerburgh & Veldkamp, 2005) 13 (Bekaert & Urias, 1996)
14 (Gorman & Jorgensen, 2002) 15 (Lewis, 1999)
Therefore, even if an investor sees foreign returns as ambivalent, research demonstrates that he should hold more international assets than observed.
2.2.3 Home-bias explained by behavioural finance
It now seems clear that traditional finance cannot solve the home-bias puzzle, or at least cannot explain it completely. Behavioural finance can help us highlight factors stemming from investors’ psychology rather than their rational thinking.
a- A geographic proximity preference
In Home bias at home: Local equity preference in domestic portfolios (1999), Coval and Moskowitz investigate whether investors have a preference for geographically proximate investments and try to assess the importance of such a preference for portfolio choices. The special feature of this paper is that it focuses on the U.S. domestic market “to avoid confounding factors due to political and monetary boundaries”: even if we have previously seen that those factors should play little to no role on investors’ choices, this allows to only focus on a potential psychological preference of these investors.
As such, by studying the location of the headquarters of companies held by U.S. money managers, they find that “the average U.S. fund manager invests in companies that are between 160 to 184 kilometers, or 9 to 11 percent, closer to her than the average firm she could have held.”16 For an average fund manager, this means that while his benchmark portfolio’s centre
of gravity is 1815 kilometers away, he is only 1663 kilometers away from the average security he chooses to hold.
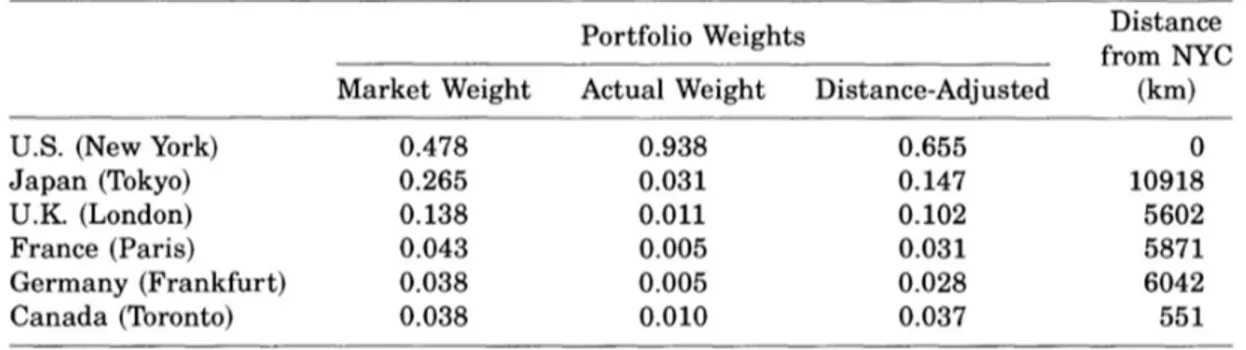
They then try to extrapolate those results to explain the international home-bias. Since there are 1815 kilometers separating the average security from the average fund manager in the U.S. domestic market, and since there is a minimum 9.32 percent local bias, Coval and Moskowitz decide to reduce international holdings proportionally to the distance between the U.S. and each country, as multiple of 1815 kilometers. Each country’s distance-adjusted portfolio share is then computed as:
= ∗ 1 − 0.0932
The remaining share (compared to the initial weights) is invested in the U.S. domestic market instead. The results can be seen in figure 3.
Figure 3 – Distance effect on U.S. equity portfolio weights17
We can observe that distance-adjusted weights are getting a bit closer to the actual weights of U.S. portfolios: this evolution represents approximately one-third of the home-bias.
It would nevertheless be interesting to understand where this geographic proximity preference comes from. Coming back to the domestic context, Coval and Moskowitz demonstrate that this preference is even more manifest when firms are small, levered, and not traded internationally:
“These results suggest an information-based explanation for local equity preference because small, highly levered firms, whose products are primarily consumed locally, are exactly those firms where one would expect local investors to have easy access to information and they are
firms in which such information would be most valuable.”17
Since investors feel more familiar with local firms, they feel they have an edge to build accurate estimates of future earnings; estimates whose value is even greater for small and levered firms. Those firms are indeed riskier, as earnings risk factors are larger.
We will discuss this “information-based explanation” more in-depth in the following part.
b- Information asymmetry or information immobility?
Since investors tend to know more about their home assets, a classical explanation for home-bias is information asymmetry. With globalization, this explanation tends to disappear, since it is possible and easy to obtain or to trade for information on foreign equity. Ahearne, Griever and Warnock (2000) show that many countries are heavily underweighted in U.S. investors’ portfolios because of “the poor quality and low credibility of [their] financial information”18.
17 (Coval & Moskowitz, 1999)
But major markets have succeeded in reducing or even eliminating the information asymmetry by publicly listing their largest companies in the U.S., using ADRs: sure, those countries are less underweighted than other markets, but a large home bias still exists and is then not explained by information asymmetries.
In Information immobility and the home bias puzzle (2005), Van Nieuwerburgh and Veldkamp accept this reality but chose to go even further in the assumption of an information-based explanation for the home bias puzzle: they defend the theory of information immobility. Of course, when taking traditional and rational factors, information immobility is as implausible as capital immobility. Van Nieuwerburgh and Veldkamp therefore rely on behavioural factors and information theory to prove that there exists a market segmentation of information because of information immobility:
“A small information advantage makes a local asset less risky to a local investor. Therefore, he expects to hold slightly more local assets than a foreign investor would. But, information
has increasing returns in the value of the asset it pertains to: […] the investor chooses to learn more and hold more of the asset, until all his capacity to learn is exhausted on his home
asset. […] The result is that information market segmentation persists not because investors can't learn what locals know, nor because it is too expensive, but because they don't choose
to; capitalizing on what they already know is a more profitable strategy. Information immobility is plausible because information is a good with increasing returns.”19
Once again, familiarity with home assets seem to play a large role: indeed, Van Nieuwerburgh and Veldkamp show that “magnifying information advantages generates effects that resemble a familiarity bias or a loyalty effect”19. Even though it seems at first rational to specialize in
order to obtain more profitable results, we in fact enter the realm of psychological biases. Kilka and Weber (2000) show that by using a familiarity heuristic when picking domestic equity over foreign equity, investors reveal a strong inclination for optimism and overconfidence. They overestimate their knowledge and believe that the outcomes of events are more favorable for them than for others.
Why is familiarity so important for investors to make their investment choices? Why does it incite them to exhibit such a strong home bias? In the next section, I will try to find answers to these questions in the light of ambiguity aversion.
III- HOW CAN AMBIGUITY AVERSION EXPLAIN HOME-BIAS?
3.1. SYNTHESIS OF THE BIBLIOGRAPHY EXPLORATION
In the bibliographic section about ambiguity aversion, we have exhibited the link with familiarity and the feeling of confidence. By comparing his knowledge and familiarity with two distinct choices, an individual creates ambiguity aversion towards the choice where he feels less competent for making the right decision.
Similarly, we have seen that behavioural research on home-bias has often showcased information-based explanations and demonstrated there is a strong correlation with a sense of familiarity towards local stocks. It is the “geographic proximity preference” of Coval and Moskowitz (1999), but also an inclination of investors for generating “information immobility” (Van Nieuwerburgh and Veldkamp, 2005): they choose to specialize in domestic equity because they feel they have a competence advantage thanks to their assumed familiarity with those assets. This leads them to optimism and overconfidence when investing in domestic stocks.
A link therefore seems to exist between the home-bias puzzle and ambiguity aversion. In fact, we can use the “comparative ignorance hypothesis” of Fox and Tversky (1995) to assume that foreign equity is not ambiguous as such: because an investor can always choose between investing in the domestic market and in the international market, those two choices are placed in a comparative environment and foreign equity becomes more ambiguous than domestic equity. The investor thus chooses the foreign equity because he feels more knowledgeable, more confident, more familiar. Moreover, an investor might also exhibit an inferiority complex against foreign investors, as they must inevitably know their own markets better: “An uncertain prospect becomes less attractive when people are made aware that the same prospect will also be evaluated by more knowledgeable individuals.”20
By synthesizing several psychological biases that are demonstrated to have a correlation with home bias, ambiguity aversion is a preference that could be a good candidate for explaining the puzzle. Most recent empirical research tends to move in this direction.
3.2. STUDY OF TWO EMPIRICAL PAPERS
Two recent research papers have focused on the correlation between ambiguity aversion and classical portfolio puzzles.
Ambiguity Preferences and Portfolio Choices: Evidence from the field (Bianchi and Tallon, 2016) draws on portfolio data obtained from a French large financial institution, which focuses on the French household saving product “Assurance Vie”.
Ambiguity aversion and household portfolio choice puzzles: Empirical evidence (Dimmock, Kouwenberg, Mitchell and Peijnenburg, 2015) uses American data drawn from the American Life Panel (ALP), as well as a survey-module fielded on ALP respondents to measure ambiguity aversion.
Those two papers focus on several portfolio puzzles, among which under-participation in equities, portfolio under-diversification, home-bias and own-company stock ownership. We will pay particular attention to how they measure ambiguity aversion and how they demonstrate a correlation with home-bias.
3.2.1. In France – Assurance Vie
Bianchi and Tallon (2016) use three sources of data: portfolio data about assurance vie contracts, which are the most-used access to stock markets for French people, a survey made by the researchers to obtain information about demographic characteristics and behavioural traits of the contracts’ owners, and Thomson Reuters’ data on market returns. The latter allows Bianchi and Tallon to construct returns of participants’ portfolios and to study those more in-depth: particularly useful for our study, they are thus able to “build a measure of differential exposure based on the difference between a ‘domestic’ beta and an ‘international’ beta.”21
To measure preferences over ambiguity, Bianchi and Tallon use a classical Ellsberg two-urns lottery (see figure 1): respondents have a choice between a risky lottery with an exact probability distribution, and an ambiguous lottery with no information at all on the probability distribution. In order to obtain a precise measure of ambiguity aversion, there are several rounds with more or less attractive risky lotteries depending on the previous answers. Respondents are then ranked between 1 and 4, from the least to the most ambiguity-averse.
The main conclusion they draw is that as literature predicts (cf 2.2.3. Impacts of ambiguity aversion on individuals’ portfolio choices), ambiguity-averse investors tend to under-diversify:
“In terms of portfolio composition, we find that ambiguity averse investors are more exposed to risk, as defined both in terms of the volatility of returns and in terms of beta relative to the
French stock market.”22
In fact, they bear both more domestic risk and more idiosyncratic risk than ambiguity-neutral or -seeking investors. Regarding the home-bias, Bianchi and Tallon compute a “Beta(W)” and a “Beta(F)” for every portfolio, to measure their exposure to the MSCI World Index and the CAC40 Index respectively:
“The measure we take is simply the difference between Beta(F) and Beta(W). […] The effect of ambiguity aversion is positive and significant, suggesting that ambiguity averse investors are more exposed to the French rather than to the international stock market. The estimated coefficient implies that a standard deviation increase in ambiguity aversion increases the
difference Beta(F)-Beta(W) by 0.7%, relative to the average difference of 2.3%.”22
The striking dimension of these results is that they are obtained from mutual funds holdings data: compared to direct stock holdings, they are “commonly perceive as instruments to obtain well diversified portfolios”22. They are empirical proof that ambiguity preferences can partially
solve the home-bias puzzle.
3.2.2. In the United States – American Life Panel
In this subsection, I will give more detailed information on data since some of it will be re-used in the following statistical study.
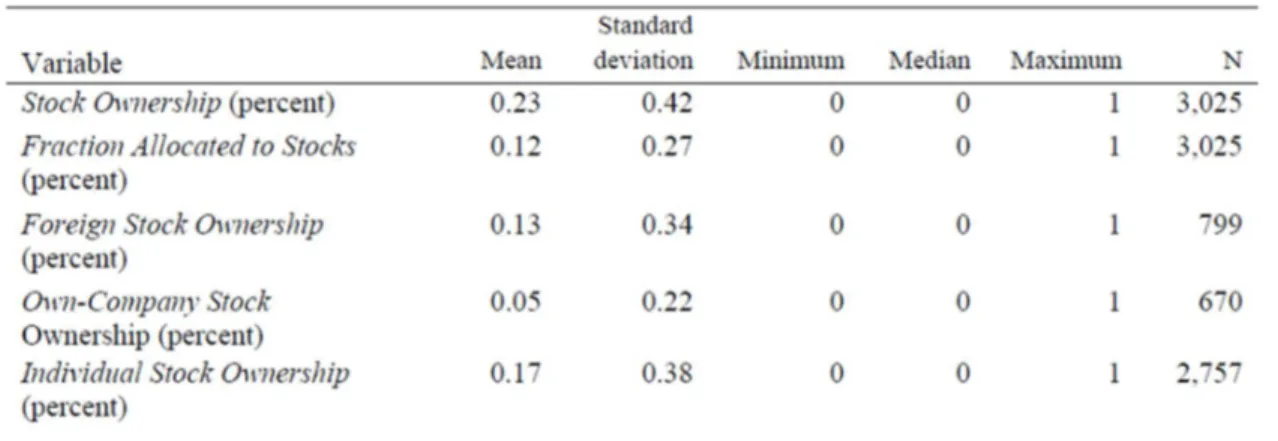
In this second research paper, the main difference is the source of data exploited: Dimmock, Kouwenberg, Mitchell and Peijnenburg (2015) use large representative surveys from the American Life Panel, an online panel of U.S. households. The larger size and scope of those surveys – compared to portfolio data from Bianchi and Tallon (2016) – allows to investigate stock market puzzles more in detail. A summary of some variables can be found in figure 4.
To elicit ambiguity preferences, the methodology is the same as Bianchi and Tallon (2016) – namely the Ellsberg two-urns lottery. Nevertheless, Dimmock et al. chose to give real monetary
rewards as “previous studies show that rewards are crucial for eliciting meaningful responses to questions involving economic preferences”23.
Figure 4 – Summary of dependant variables23
The measured ambiguity index is more detailed. Respondents can choose between the two urns but also answer “indifferent”: the goal of the survey module is to find the level of winning probability of the risky urn so that the respondent is indifferent between both urns. They note q the matching probability and the ambiguity aversion index is then defined by 50% - q: “positive values of this measure indicate ambiguity aversion, zero indicates ambiguity neutrality, and negative values indicate ambiguity-seeking”23. They find results consistent with previous
research (see figure 5).
Figure 5 – Ambiguity aversion measure summary23
In this research paper, the main result is the confirmation of theory predicting the adverse effect of ambiguity aversion on stock market participation and portfolio allocations to equity:
“Results indicate that a one standard deviation increase in ambiguity aversion implies a 2.0 percentage point decrease in the probability of stock market participation (8.6% relative to
the baseline rate of 23%) and a 4.0 percentage point decrease in the fraction of financial assets allocated to equity (7.8% relative to the conditional average allocation of 51.4%)”24
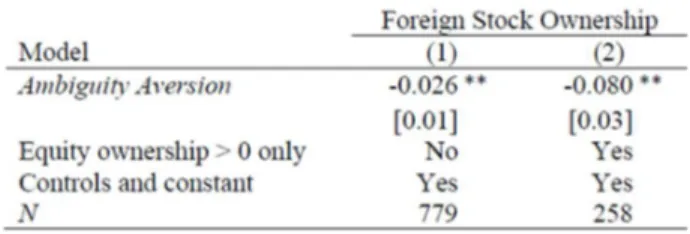
Regarding home-bias, Dimmock et al. (2015) use a binary variable to measure foreign stock ownership. Like Bianchi and Tallon, they demonstrate a significant negative relation between ambiguity aversion and exposure to the international market. This result also holds among equity market participants taken alone:
“Once again, the implied economic magnitude is large. A one standard deviation increase in ambiguity aversion is associated with an 8.0 percentage point decrease in the probability of
foreign stock ownership (29.6% relative to the baseline rate of 27.0 percentage points).”24
Figure 6 – Foreign stock ownership and ambiguity aversion24
They are empirical proof that ambiguity preferences can partly solve the home-bias puzzle.
We again find empirical evidence that ambiguity aversion can explain the home-bias puzzle. We will further investigate this relationship in a statistical study, partially using the same dataset as Dimmock et al.
IV- STATISTICAL STUDY
The empirical study of Dimmock et al (2015). focuses on the relationship between ambiguity aversion and the participation or non-participation in the international market. However, the home-bias puzzle goes beyond participation: even among participants in the international market, it is the proportion of allocations in foreign equities which is counterintuitively low. In accordance with classical theory, an investor should hold the world market portfolio: in the MSCI All-World Country Index, the American market currently weights around 55% of the index. Even if this weight is huge – especially compared to the actual weight of the American economy in term of GDP, around 25% –, foreign markets still represent 45% of stock market capitalization25.
Bianchi and Tallon (2016) already tried to build a more acute link between ambiguity aversion and international allocations in France, by studying the linear relation between their ambiguity aversion index and the exposure in terms of beta of respondents’ portfolios to the international MSCI World Index.
In this statistical study, I choose to take advantage of the large and comprehensive dataset from Dimmock et al. (2015) to study the dependence of the proportion of allocations in foreign equities on ambiguity aversion.
4.1. CREATION OF A DATASET
4.1.1. Re-use of Dimmock et al. dataset
A substantial part of the workload in empirical research about ambiguity aversion consists in eliciting ambiguity preferences of the sample: it is not a given value like demographic variables or the value of owned financial assets. The provision of an accurate ambiguity aversion index for a large sample (3259 respondents) is therefore the main advantage of re-using Dimmock et al. dataset. This index has been described in 3.2.2 (see figure 5). A more comprehensive summary of this index provided by Dimmock et al. (2015) can be found in Appendix A.
Moreover, this dataset has the advantage of being representative of the American population thanks to survey weights provided by ALP. Regressions of ambiguity aversion on control
variables show that the latter explain a low proportion of the variance in ambiguity aversion: “this suggests that [this] measure of ambiguity aversion captures new information about preferences which is not subsumed by standard demographic and economic controls.”26
Other variables included in the dataset helped me to find relevant surveys in the ALP database; I discuss those in the next subsection. A summary of the sample’s characteristics and variables taken from Dimmock et al. (2015) can be found in Appendix B.
4.1.2. Survey from the American Life Panel
Outside of an ambiguity aversion index, the main prerequisite of this statistical study is to obtain more precise data on foreign stocks ownership. I therefore rely on one survey led by the ALP27.
Survey 48 “Cognition and Aging in the USA Internet Decision Making Survey” was led from November 2008 to September 2009 on 2188 respondents. Questions asked are about everyday financial decisions and the financial well-being of respondents: the survey focuses on the general understanding of financial topics, sources of income, allocation of wealth, etc. The questions that are interesting for us are the following:
Questions about owned retirement accounts and their composition (foreign investment funds, US index funds, sector funds): Q100, Q101, Q102, Q103, Q104
Questions about owned mutual funds and their composition (foreign investment funds, US index funds, sector funds): Q119, Q120, Q121, Q122
Questions about owned stocks of individual companies (stock of current and previous employers, stocks in foreign companies, stocks in US companies): Q125, Q126, Q127, Q128
I had first planned to use another survey in addition to survey 48. Survey 307 “Decision Making” provides similar information as survey 48 thanks to questions about finances and retirement plans of respondents. But results were not homogeneous between both surveys: I therefore chose to only use survey 48 since it provides with more observations and data is clearer and more detailed.
26 (Dimmock, Kouwenberg, Mitchell, & Peijnenburg, 2015) 27 (The American Life Panel, s.d.)
4.1.3. Data treatment
The two main goals of data treatment were to compute the allocation in foreign stocks as a proportion of total stock ownership and then to cleanse the data. I will call the key variable foreign stock proportion, which is equal to the percentage of foreign equity a respondent holds compared to the total value of their equity.
a- Proportion of foreign stocks
To compute the foreign stock proportion, I take both tax-advantaged accounts (retirement accounts) and normal accounts.
In survey 48, the composition of equities holdings is precisely described and distinguished between stocks held in retirement plans, stocks held through mutual funds not part of retirement plans, and stocks held individually. Thanks to a clear separation between U.S. and foreign holdings, it is easy to compute the foreign equity value, the total value of owned equity, and finally the foreign stock proportion.
The only difficulty is the possibility for respondents to give answers about their allocations as ranges. I chose to use a table of correspondence to take the centre of those ranges as the exact value of investments (e.g. $75,000 for the $50,000-$100,000 range).
I obtain 665 observations, starting from 2188 respondents: a large portion of them do not own equity at all.
b- Data cleansing
Using Dimmock et al. (2015) dataset made data cleansing quite straight-forward as it was already coherent.
I follow their approach and eliminate respondents who did not answer all ambiguity questions or who answered all questions in less than two minutes.
4.2. STATISTICAL ANALYSIS
As a reminder, a summary of the sample’s characteristics and variables taken from Dimmock et al. (2015) can be found in Appendix B. In this statistical analysis, I focus only on equity owners.
4.2.1. Summary of Foreign Stock Proportion
Among all respondents owning equity, the average of foreign stock proportion is 17% (see figure 7): this is consistent with information given in research about the home-bias puzzle and with the fact that U.S. investors under-diversify in international markets.
In terms of participation, 56% of equity owners are invested in foreign stocks. I logically reach the same number as Dimmock et al. (2015) since they use similar data.
Figure 7 – Summary of Foreign stock proportion (all observations)
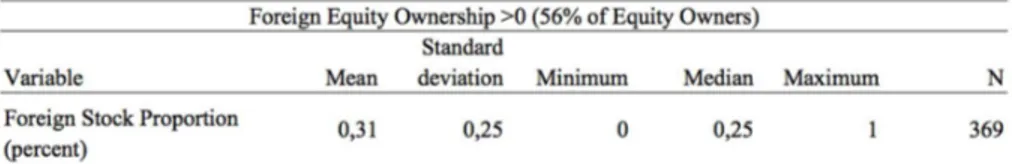
Conditional on participation in foreign markets, the foreign stock proportion increases up to 31% (see figure 8). This is still proof that a strong home-bias exists among U.S. individual investors.
Figure 8 – Summary of Foreign stock proportion (Foreign Equity Ownership > 0)
These results are not surprising as the exploratory work on research about home-bias suggested we would obtain this kind of values.
4.2.2. Comparison of means against ambiguity preferences
Instead of using the unaltered ambiguity aversion index, I first transformed it in a binary variable:
Equal to 1 for the [0;0.5] range: ambiguity-averse respondents; Equal to 0 for the [-0,5;0[ range: ambiguity-seeking respondents.
Since the number of respondents having an ambiguity aversion index equal to 0 is quite low – 6% of respondents owning foreign equity –, I decided to include them in the first group. Moreover, the results are not significantly different when eliminating ambiguity-neutral respondents from the ambiguity-averse group.
This simplified variable allows to study the portfolio choices of individuals having opposite preferences in terms of ambiguity. Dimmock et al. (2015) had already showed that “a one standard deviation increase in ambiguity aversion is associated with an 8.0 percentage point decrease in the probability of foreign stock ownership.”28
We have here the first evidence that ambiguity preferences also play a huge role on the proportion of equity allocated to foreign assets among foreign equity owners: in average, ambiguity-averse respondents have a 28% foreign stock proportion, while ambiguity-seeking investors have a 38% foreign stock proportion – a startling 10 percentage points difference (see figure 9).
Figure 9 – Comparison of means against ambiguity preferences
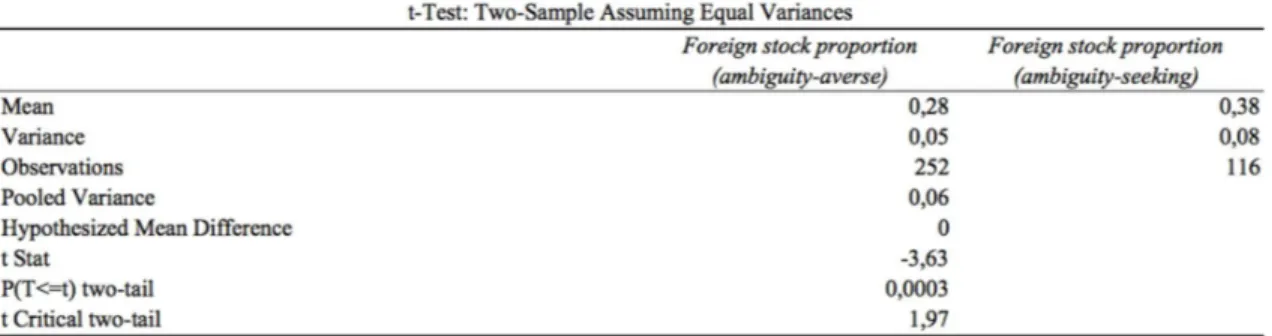
Moreover, a t-Test done on the two sub-samples of data show that this difference is statistically significant with a 1% confidence level (see figure 10).
Figure 10 – t-Test: significance of the difference in means against ambiguity preferences
4.2.3. Linear regression of foreign stock proportion against the ambiguity aversion
index
I now use the whole ambiguity aversion index to go further and study if there exists a linear relation between the proportion of equity allocated to foreign stocks and ambiguity aversion, as theory predicts.
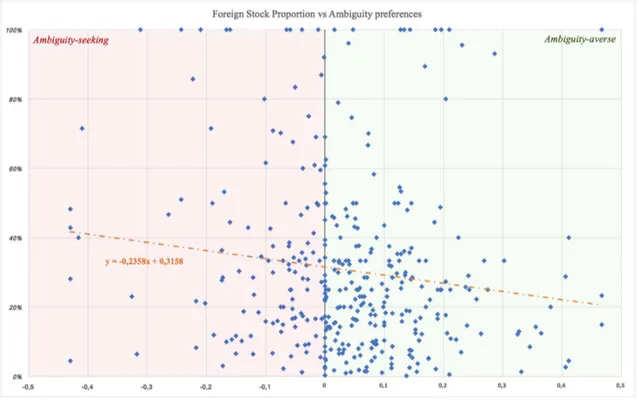
A first glance at the scatter plot of foreign stock proportion against the ambiguity aversion index and at the layout of data suggests a negative relation (see figure 11).
Figure 11 – Scatter plot of Foreign stock proportion against Ambiguity aversion index
An OLS regression demonstrates that this intuition is right: there is a statistically significant – at the 1% confidence level – negative relation between foreign stock proportion and ambiguity aversion index (see figure 12). In fact, for an increase of one standard deviation in ambiguity aversion (+0.21), the proportion of equity allocated to international markets is predicted to go down by 5%.
V- DISCUSSION AND CONCLUSIVE REMARKS
The statistical analysis has confirmed several predictions of research. As observed by a number of papers having first drawn attention to the home-bias puzzle, the proportion of equity allocated by individual investors to international markets is exceptionally low – 17% in our dataset. This proportion is even exceptionally small given that I take into account equity owned through tax-advantaged retirement funds that usually diversify “in place of” the owner.
It would therefore be interesting to lead a similar study on exclusively directly held stocks. The dataset I used allows such distinction between stocks held in mutual funds and individual stocks held, but the number of observations was too low to be of statistical interest.
Thanks to a thorough exploration of existing bibliography about the home-bias puzzle and ambiguity aversion, I had hypothesized that foreign stock ownership was negatively affected by ambiguity aversion. Most recent research papers on the subject have started demonstrating this relation, by focusing on the pure participation or not-participation in the foreign stock markets.
I demonstrate that even among foreign equity owners, ambiguity aversion has an adverse effect on the proportion of their assets they decide to allocate to the international market. The foreign stock proportion of averse respondents is thus 10% lower than that of ambiguity-seeking respondents (see figure 9).
However, these results should not conceal the fact that ambiguity aversion kept alone holds a rather low explanatory power for home-bias. Even among the most ambiguity-seeking respondents, the proportion of equity allocated to foreign markets is far below what is predicted by the classical theory of utility. Moreover, the OLS regression (see figure 12) shows that even if the negative relation is statistically significant, ambiguity aversion seems to explain a relatively small part of the decision of allocation to foreign equity (see R Square).
Future axes of research on the home-bias puzzle could include multi-variable empirical studies focusing on several promising hypotheses alongside ambiguity aversion: some of them have been discussed at length in the bibliographic exploration, like the geography proximity preference29. Such research would require far more detailed data: it should only focus on equity
owners and provide precise allocations of stocks in different countries. A dataset similar to
Bianchi and Tallon (2016), obtained from a stockbroker or a banking institution, would be a gold mine of information. This would allow to investigate if ambiguity aversion is included in other preferences or if it effectively holds some explanatory power alone.
Other explanations, although very promising, are much more complicated to test empirically, like the inclination for information immobility30. The home-bias puzzle still retains much of its
mystery.
APPENDIX
APPENDIX A – Presentation of the American Life Panel ... 28 APPENDIX B – Complete summary of ambiguity aversion index ... 29 APPENDIX C – Summary of key variables ... 30
APPENDIX B – Complete summary of ambiguity aversion index (Dimmock
et al. 2015)
BIBLIOGRAPHY
Ahearne, A. G., Griever, W. L., & Warnock, F. E. (2000). Information Costs and Home Bias: An Analysis of U.S. Holdings of Foreign Equities.
Baxter, M., Jermann, U. J., & King, R. G. (1998). Nontraded goods, nontraded factors, and international non-diversification. Journal of International Economics, No. 44, pp 211-229.
Bekaert, G., & Urias, M. S. (1996). Diversification, Integration and Emerging Market Closed-End Funds. The Journal of Finance, Vol. 51, No. 3, pp. 835-869.
Bianchi, M., & Tallon, J.-M. (2016). Ambiguity Preferences and Portfolio Choices: Evidence from the Field.
Bossaerts, P., Ghirardato, P., Guarnaschelli, S., & Zame, W. R. (2003). Ambiguity in Asset Markets: Theory and Experiment.
Campbell, R. A., & Kräussl, R. (2006). Revisiting the home bias puzzle: Downside equity risk.
Chen, Z., & Epstein, L. (2002). Ambiguity, Risk, and Asset Returns in Continuous Time. Econometrica, Vol. 70, No. 4, pp. 1403-1443.
Cooper, I., & Kaplanis, E. (1994). Home Bias in Equity Portfolios, Inflation Hedging, and International Capital Market Equilibrium. The Review of Financial Studies, Vol. 7, No. 1, pp. 45-60.
Coval, J. D., & Moskowitz, T. J. (1999). Home Bias at Home: Local Equity Preference in Domestic Portfolios. The Journal of Finance, Vol. 54, No. 6, pp 2045-2073.
Dimmock, S. G., Kouwenberg, R., Mitchell, O. S., & Peijnenburg, K. (2015). Ambiguity Aversion and Household Portfolio Choice Puzzles: Empirical Evidence.
Fox, C. R., & Tversky, A. (1995). Ambiguity Aversion and Comparative Ignorance. The Quarterly Journal of Economics, Vol. 110, No. 3, pp. 585-603.
French, K. R., & Poterba, J. M. (1991). Investor Diversification and International Equity Markets.
Gollier, C. (2008). Does ambiguity aversion reinforce risk aversion? Applications to portfolio choices and asset prices.
Gorman, L. R., & Jorgensen, B. N. (2002). Domestic versus International Portfolio Selection: A Statistical Examination of the Home Bias. Multinational Finance Journal, Vol. 6, No. 3&4, pp. 131-166.
Heath, C., & Tversky, A. (1991). Preference and belief: Ambiguity and competence in choice under uncertainty. Journal of Risk and Uncertainty, Vol. 4, No. 1, pp. 5-28.
Kang, J.-K., & Stulz, R. M. (1996). Why is there a Home Bias? An Analysis of Foreign Portfolio Equity Ownership in Japan.
Karolyi, G. A., & Stulz, R. M. (2002). Are financial assets priced locally or globally?
Kilka, M., & Weber, M. (2000). Home Bias in International Stock Return Expectations. Journal of Psychology and Financial Markets, No. 3&4.
Kimball, M. S., & Shumway, T. (2006). Investor Sophistication and the Participation, Home Bias, Diversification, and Employer Stock Puzzles.
Kumar, S., & Goyal, N. (2015). Behavioural biases in investment decision making - a systematic literature review. Qualitative Research in Financial Markets, Vol. 7, No. 1, pp. 88-108.
Lewis, K. K. (1999). Trying to Explain Home Bias in Equities and Consumption. Journal of Economic Literature, Vol. 37, No. 2, pp. 571-608.
Nechio, F. (2014). Foreign Stock Holdings: The Role of Information.
Parwada, J. T. (2008). The Genesis of Home Bias? The Location and Portfolio Choices of Investment Company Start-Ups. Journal of Financial and Quantitative Analysis, Vol. 43, No. 1, pp. 245-266.
Shore, S. H., & White, J. S. (2002). External Habit Formation and the Home Bias Puzzle.
Tallon, J.-M., & Mukerji, S. (2001). Ambiguity Aversion and Incompleteness of Financial Markets. The Review of Economic Studies, Vol. 68, No. 4, pp. 883-904.
Van Nieuwerburgh, S., & Veldkamp, L. (2005). Information Immobility and the Home Bias Puzzle.
Warnock, F. E. (2002). Home bias and high turnover reconsidered. Journal of International Money and FInance, No. 21, pp. 795-805.
LIST OF ILLUSTRATIONS
Figure 1 – Illustration of the two-urns Ellsberg paradox ... - 3 -
Figure 2 – Risk return trade-off portfolios of U.S. and foreign Mutual Funds... - 7 -
Figure 3 – Distance effect on U.S. equity portfolio weights ... - 13 -
Figure 4 – Summary of dependant variables ... - 18 -
Figure 5 – Ambiguity aversion measure summary ... - 18 -
Figure 6 – Foreign stock ownership and ambiguity aversion ... - 19 -
Figure 7 – Summary of Foreign stock proportion (all observations) ... - 23 -
Figure 8 – Summary of Foreign stock proportion (Foreign Equity Ownership > 0) ... - 23 -
Figure 9 – Comparison of means against ambiguity preferences ... - 24 -
Figure 10 – t-Test: significance of the difference in means against ambiguity preferences - 24 - Figure 11 – Scatter plot of Foreign stock proportion against Ambiguity aversion index ... - 25 -
Figure 12 – OLS regression summary of Foreign stock proportion against Ambiguity aversion index ... - 25 -