Any correspondence concerning this service should be sent
to the repository administrator:
[email protected]
This is an author’s version published in:
http://oatao.univ-toulouse.fr/26622
To cite this version: Despax, Laurie and Vidal, Vanessa and
Delagnes, Denis and Dehmas, Moukrane and Matsumoto,
Hiroaki and Velay, Vincent Influence of strain rate and
temperature on the deformation mechanisms of a fine-grained
Ti-6Al-4V alloy. (2020) Materials Science and Engineering A,
790. 139718. ISSN 0921-5093
Official URL
DOI :
https://doi.org/10.1016/J.MSEA.2020.139718
Open Archive Toulouse Archive Ouverte
OATAO is an open access repository that collects the work of Toulouse
researchers and makes it freely available over the web where possible
Influence of strain rate and temperature on the deformation mechanisms of a
fine-grained Ti-6Al-4Valloy
Laurie Despax
•
·
•
, Vanessa Vidal
•
, Denis Delagnes
•
, Moukrane Dehmas
h,
Hiroaki Matsumoto
C,
Vincent Velay
•
a Institut Clément Ader (ICA), Université de Toulouse, CNRS, IMT Mines Albt UPS, INSA, ISAE-SUPAERO, Cwnpus Jarlard, 81013 Albi CT Cedex 09, France b CIRIMAT, Université de Toulouse, CNRS, 4 allie Emile Monso, BP 44362, 31030 Toul.ouse Cedex 04, France
c Departnrent of Advwtced Materi.aù; Science, Faculty of Engineering, Kagawa Untversi.r;y, 2217-20 Hayashi-cho, Takanwt.su, Kagawa 761-03%, Japan
Keyworm: Titanium alloys Mechanical behaviour Supe:rplasticity Interrupted tensile test Texrure
P-phase
Electron backscatter diffraction (EBSD)
1. Introduction
ABSTRACT
Depending on their initial microstructure, titanium alloys, as the Ti-6Al-4V may have activation of different deformation mechanisms during hot forming processes. In this work, interrupted tensile tests and heat treatments are used to improve the understanding of the mechanical and microstructural behaviour of a fine grained Ti-6Al-4V alloy at two temperatures (750 °c and 920 °C) and so for two different p phase fractions. The microstructural features like, a grain size and phase fraction, were determined by Scanning Electron
Microscope (SEM) and image analysis. Moreover, evolution of the preferred crystallographic orientation of a
grains and local misorientations between and inside grains were obtained by Electron Backscatter Diffraction (EBSD). The strain rate sensitivity parameter as well as the activation energy were deduced from mechanical tests. lt appears, from all these microstructural and mechanical data, that several mechanisms are activated depending on the strain level and on the temperature range. At 750 °c, for a high strain rate, the deformation is mainly controlled by dislocations activity in the a phase (texture changes, dynamic recrystallization) and, at very low strain rate, by probably GBS accommodated with dislocations activity into a (recovery) and p. On the contrary at 920 °C, a clear decrease of the overall texture intensity associated with a high m value suggests that GBS is the dominant mode of deformation. Nevertheless, as the a/P volume fraction is around 48 %/52 % at this temperature, not only the a phase but also the P phase as well as a/ a and P / P boundaries might contribute to the flow behaviour. During long deformation time (low strain rate and high temperature), dynamic coarsening behaviour (both into a and P), that is controlled by bulk diffusion, can occur and modify the type, the distribution and decrease the number of a/P, a/a and P/P boundaries. This can be partly related to the flow hardening observed at 920°C and 10--4s-1•
Titanium alloys are widely used in the aerospace industry as tbey combine a good resistance to corrosion and good mechanical prop erties as tbeir strengtb to weight ratio and good ductility [1]. They are also known to have interesting superplastic behaviour. Indeed, superplastic forming (SPF) process uses tbe ability of some materials to witbstand a huge deformation witbout necking at high temperature
(T > 870 °C) and low strain rate (lo-4 s-1) to produce near net shape parts. Moreover it is commonly admitted that a fine-grained (da <
10 µm) and equiaxed microstructure of two-phase titanium alloys (e.g Ti-6AI-4V) would promote tbis superplastic behaviour at intermediate temperatures (650 °C-800 °C) [2].
reformulating tbe alloy chemistry [5] or by decreasing the temperature as well as the forming time. The refinement of tbe initial microstructure (grain size lower than IOµm) appears to be a promising way [6,7]. During SPF, tbe involved deformation mechanisms can be significantly different depending on tbe temperature (and so tbe phase fraction a/ P), tbe strain rate and so tbe initial microstructure [8]. For two-phase tita nium alloys sucb as tbe Ti-6Al-4V, tbe deformation is mainly described as being controlled by either the a phase (isostrain-rate mode) [9], tbe p phase (isostress mode) [9] or controlled by a competition between tbe two ones [9, 10]. In addition to tbe description of the role of each phase, tbe mechanisms at high temperatures are generally described in terms of dislocations climb [11], diffusional creep [12], grain boundary sliding (GBS) supported by several accommodation mechanisms like Since the last thirty years, some researches concentrate on in
vestigating the ways to improve tbe cost efficiency of SPF [3,4] by * Corresponding author.
E-mail address: [email protected] (L. Despax). https:/ /doi.org/10.1016/j.msea.2020.139718
vacancy diffusion or dislocations glide [13] as well as microstructural changes (dynamic recrystallization, grain growth and grain rotation).
The understanding of the deformation mechanisms involved in su perplastic forming (SPF) remains a major challenge because each study shows as many mechanisms as experimental conditions and is mainly based on the analysis of stress-strain curves [10] or on the post mortem characterization of samples [8,9,14]. As an example, in the case of a Ti-6Al-4V alloy with an a grain size of 6 µm, at 900 °C, Alabort
et al. suggested, by in-situ SEM observation, a mechanism of GBS completed by the motion of dislocations in the /J phase, which seems ta be dependent on the /J grain size [15]. Kim et al. proposed a phase boundary sliding (PBS) rather than GBS due to the presence of dislocations only at a//J interfaces [9]. In the temperature range of 750°C-850°C and for an initial a grain size about 5 µm, Yang et al.
described a mechanism involving GBS combined with a stress softening explained by dynamic recrystallization for the lowest temperatures and a strain hardening noticeable by an a grain growth for the highest temperatures [14]. These studies are mainly based on mechanisms identified in the a phase. However, the phase fractions and the number of a/ fJ interfaces might be different at high temperature and sa may influence the mechanical behaviour. An increase of the /J phase fraction seems ta favour the GBS by enhancing the mechanisms of accommo dation [10,14,15]. Furthermore, the understanding of mechanisms at high temperatures (>900 °C) is poorly documented because they are too
far from industrial superplastic favourable conditions [8,16]. Liu et al. described a mechanism of GBS controlled by lattice diffusion at 890 °c
with a high strain rate. By applying high temperatures, the dislocations mobility is favoured leading ta the formation of large grain boundaries and thus ta a grain boundary slip [17].
Thus, although there are several papers dealing with the mech anisms of SPF in titanium alloys, there is not much literature on superplastic deformation mechanisms in Ti-6Al-4V alloys with a grain size below 4 µm and for temperatures above 900 °C. These consider
ations motivate the current study to improve the understanding of deformation mechanisms involved in a fine-grained Ti-6Al-4V alloy (d0
= 2 µm), for two strain rates (10-2 s-1 and 10-4 s-1) and two tempera
tures (750 °C and 920 °C) for which the /J phase fraction is significantly
different. Therefore, interrupted tensile tests and SEM-EBSD character izations were carried out to study the mechanical behaviour and the microstructural evolution (a phase fraction, a grain size and crystal lographic orientation) at each deformation step. This paper provide, thus, a better understanding on how a fine grain size can significantly modify the value of the optimal a/ fJ phase fraction ratio (classically reported around 40%-50% for superplasticity) and, sa, the mechanisms of superplasticity. Moreover, a special effort have been made at high temperature ta discuss the mechanisms that could contribute ta the hardening.
2. Materials and methods
The material investigated in this study, supplied by Airbus France, is a fine-grained (FG) Ti-6Al-4V alloy in the shape of 3 mm thick sheets processed by rolling and by a heat treatrnent at 770 °C during 40 min
followed by air cooling. The nominal chemical composition (wt.%) of this alloy was 6.26 Al, 3.92 V, 0.33 0, 0.24 Fe, 0.01 C and 0.01 N. The /J-transus temperature is around 1000 °C. Pole figures for five lattice
plan hkl reflections were obtained with a X-ray diffractometer (X'Pert PANALYTICAL) by using an Euler cradle. Phi angles were measured between 0° and 360° each 5° for 150 s. Psi angles were obtained with
a rotation from 0° to 70° each 5°. The "X'Pert Texture" software was
thus used ta calculate pole figures.
Flow behaviour at high temperatures (750 °C and 920 °C) and at two
constant strain rates 00-2 ,-1 and 10-• ,-1) was characterized by tensile test measurements performed with a servo-hydraulic testing machine and a three-zones furnace to minimize the temperature gradient on the specimen during deformation. The temperature on each zone of the
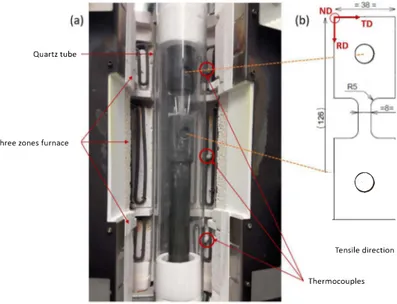
fumace was controlled by K-thermocouples positioned in the centre of each zone (Fig. 1). Dog bone specimens (gauge section of 3 x 8 mm2, a
gauge length of 15 mm and a tensile axis parallel ta the rolling direction) were machined (see Fig. l(b) which shows the shape, dimensions and sample coordinate system (ND, TD and RD mean respectively Normal, Transverse and Rolling Directions)). As titanium alloys are sensitive ta oxidation, the samples were placed in a quartz tube with a constant argon flow. The heating rate was 10°Cmin-1 followed by an isothermal
holding time of 15 min at the desired temperature before starting the tensile test. At the end of the mechanical loading, the samples were cooled down ta the room temperature inside the furnace. Therefore, a grain size data should be used with caution, as a growth regime can be certainly activated during this cooling.
Ta correlate the microstructural evolution with the plastic strain level, interrupted tensile tests were performed. Sa for each tensile test conditions (temperature and strain rate), at least three samples, charac terized each by a different incremental strain level, were obtained. Then the evolution of the microstructure was conducted on these samples deformed ta different strain levels, ta provide data about the involved deformation mechanisms. In the following sections, results of these characterizations are reported. Note that some cautions have ta be taken while interpreting these data due ta the slow cooling used from the test ta ambient temperature. In particular, due ta the grain growth mechanisms that could occur during slow cooling, it is assumed that (i) the measured a grain size at room temperature is surely slightly higher than before cooling, (ii) there is no noticeable modification of the crystallographic orientation of the a phase while cooling by considering that there is no nucleation processes involved [18].
Complementary tensile tests were done at 870 °C, 900 °C and with a
strain rate of 10-3 ,-1 ta evaluate the strain rate sensitivity m. Indeed, this parameter expresses the sensitivity of the stress to the strain rate and requires at least three temperatures and strain rates ta be calculated. It was determined by evaluating the slope of the ln(o-)-ln(ê) curves at a logarithmic strain of 0.4 (Eq. (1)).
1
t=Aam (1)
Heat treatrnents were also performed ta study the phase trans formations occurring during heating and isothermal holding without mechanical loading contribution. Sa, the phase fraction evolution on heating was obtained from different heat treatrnents carried out with a resistive furnace using the following parameters: a heating rate of 10°Cmin-1, a holding lime of 2h at temperatures in the range of 765 °C
ta 935 °c, and a water quenching. Tuen ta evaluate only the influence of
the holding time at high temperature on the microstructural evolution (without mechanical loading), additional heat treatments were carried out at 920 °C using a radiative inert gas (Argon) furnace with two differ
ent holding times (20min and 210min) representative ta the duration of the tensile tests (respectively test at 10-2 s-1 and 10-4 s-1 ). The applied heating rate is about 10°Cmin-1• The temperature was monitored with
a thermocouple inside the fumace and not welded ta the surface of the sample. The absolute error on the temperature in the range 750 °
C-950 °C was estimated to be ±20 °C. Samples were water quenched after
the heat treatrnent.
For the microstructural and microtextural characterizations, the samples before and after hot deformation and heat treatment were polished using standard preparation. The final step was a prolonged polishing (about 10 min) using a colloidal silica suspension with 20 % of H202• Key microstructural features that are the a grain size (d0)
and the phase fraction (/0/ fp) were determinated by image analysis (Aphelion® software) from images recorded using a scarming electron
microscope (SEM - Novanosem450 FEI) in backscattered mode (BSE), operated at an accelerator voltage of 15kV. The intercept method for the determination of the a grain size and the surface fraction were conducted on at least 15 images/sample. Incomplete pole figures of
{l 010} a and { 0001} a reflections were measured on the initial material with a X-ray diffractometer (X'Pert Panalytical) equipped with an Euler
Quartz tube
Three zones furnace
0
Tensile direction ThermocouplesFig. 1. (a) Servo-hydraulic testing machine with a three zones furnace and a quartz tube to have an argon atmosphere. Red circles show the thermocouples used to control the temperanrre of the fumace. (b) Details of the dimensions of the tensile test sample in millimetre and the tensile direction parallel to the rolling direction.
cradle using a step size of 5°. The obtained data were processed
by tbe software X'Pert Texture from Panalytical. Note tbat texture measurements by XRD were only performed on tbe initial material.
Moreover Electron Backscattering Diffraction (EBSD) analysis using a JEOL JSM-7001F field emission gun scanning electron microscope equipped witb an Oxford-HKL electron backscatter diffraction detector was carried out to characterize the evolution of tbe local crystallo graphic orientation and tbe substructure evolution. 122 x 91 µm maps were made using a square grid at a step size of 0.3 µm for the tem perature of 750 °C and 302 x 228 µm maps witb a step size of 0.4 µm at
920 °C. The conditions were chosen according to the a grain size, which is higher at 920 °C. EBSD data were processed using two software, i.e. HKL Channel s® (Oxford instrument) and TSL OIM 5 (TexSem).
Botb software were used because HKL Channel 5 is tbe processing software available in tbe Institut Clément Ader (ICA) laboratory and TSL is a software allowing easy manipulation of data conceming small misorientations. Indeed, it allows exporting tbese data in order to esti mate tbe density of Geometrically Necessary Dislocations (GNDs) and to show tbem in tbe form of a map. To describe tbe local misorientation within a grain, tbe Kernel Average Misorientation (KAM) parameter was used. It consists in the average misorientation between a point on tbe centre of a hexagonal measurement grid and tbe second nearest neighbours [19]. Note tbat boundaries witb a misorientation angle (0)
higher tban 15° are considered as high angle grain boundaries (HAGB)
and in tbe range of 2° to 15° as sub-grain boundaries/low angle grain
boundaries (LAGB).
3. Results
3. I. As-received state
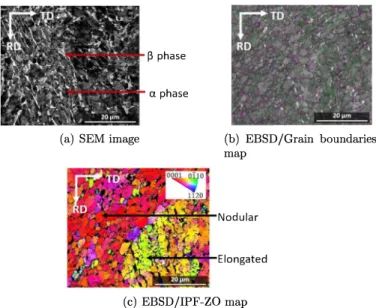
Fig. 2(a) shows a typical SEM-BSE image of tbe microstructure in tbe as-received state on tbe RD/TD surface tbat is assumed to be representative of tbe material. The a phase appears in black and tbe p phase in white (Fig. 2(a)). The SEM micrograph reveals an initial heterogeneous microstructure witb a mixture of equiaxed and slightly elongated a grains along tbe rolling direction witb tbe p phase distributed along tbese a grains. The a phase amount was found to
be about 87 ± 1 vol.%. EBSD data confirm tbat the morphology of a phase can be eitber nodular or slightly elongated with a size of about 2.1 ± 0.7 µm and 7.7 ± 2.3 µm x 3.1 ± 1.1 µm (Fig. 2(b), (c)), respectively. Texture measurements done by X-ray diffraction indicate an initial rolling texture witb basal planes { 0001} a tilted by ±25° from tbe
normal direction towards tbe rolling direction (Fig. 3(a)) and witb tbe normal of prismatic poles { 1010} a parallel to tbe transverse direction (Fig. 3(c)). A slight tilt of the sample can also be revealed because tbe poles tbat would be expected al 75° are only visible on one side of tbe
pole figure (Fig. 3(b)). Because of tbe limited p phase volume fraction in tbe Ti-6Al-4V at room temperature, only limited EBSD results were obtained for tbis phase on tbe as-received Ti-6Al-4V sheet. 3.2. Dissolution of a phase
Fig. 4 displays tbe evolution of a phase amount obtained by image analysis as a function of tbe temperature (heating rate of 10 °C min-1
and 2 h isotbermal holding). As expected, the a phase amount decreases with increasing tbe temperature from around 87 vol.% al 765 °C to
39 vol.% at 935 °C. The a phase dissolution into p seems to start around 765 °c.
The experimental data were compared witb the equilibrium a phase amount predicted using Thermo-Calc® software and tbe Saunders
database for titanium systems [20,21] (TITI3) and tbe nominal chem ical composition. The predictions are consistent witb tbe experimental results for temperatures higher tban 765 °c. lt can be assumed tbat
a holding time of 2 h at high temperature is enough to achieve an equilibrium phase fraction [22]. However, one can emphasize that the a phase amount at tbe as-received state is below tbe fraction expected at equilibrium (95% by calculation against 87% by image analysis). This difference could be linked to the last heat treatment applied during tbe manufacturing of tbe sheet. Indeed, the sheet was heated to 770 °C and
tben air cooled to room temperature. During tbe rapid cooling, only a small amount of p phase is transformed into a [23]. Therefore, tbe a phase fraction presents al room temperature will be lower tban tbe fraction predicted by tbermodynamics. Moreover, tbe beginning of tbe a phase dissolution and of tbe a .... p transformation can be noticed above 750 °C.
� phase
a phase
(a) SEM image
(b) EBSD/Grain boundaries
map
Nodular
Elongated
(c) EBSD/IPF-ZO map
Fig. 2. As-received microstructure analysed by SEM-BSE on the RDTD plane with a phase in black and P phase in white (a), EBSD map (index quality on a representation of HAGB (misorientation >15° in purple) and LAGB (2°<misorientation<15° in green)) (b) and inverse pole figure according to ZO normal direction to the sample surface (c). (For
interpretation of the references to colour in this figure legend, the reader is referred to the web version of this article.)
(a) {0001 }"'
(b) {1010}"'
( c) <X grains orientation
Fig. 3. {OOOl}a and {lOio}a pole figures of the as-received Ti-6Al-4V alloy in the RD/TD plane obtained by X-ray diffraction, respectively (a)(b), and a schema of the preferential
orientation of the a phase as a function of the rolling direction (RD) of the sheet (c). The plan in red shows the basal plans {0001 }., and in blue, the prismatic plans {lOÎO}a.
(For interpretation of the references to colour in this figure legend, the reader is referred to the web version of this article.)
Fig. 5(a), (b) and (c) show typical SEM images recorded after water quenching from 750 °C - 2 h, 920 °C - 20 min and 920 °C - 210 min,
respectively. At 750 °C, the microstructure after water quenching is
assumed to be representative of the microstructure at this high tem perature: the P phase appears in white (Fig. 5(a)). Microstructure does not significantly differ from the as-received state. Indeed, at this tem perature, the phase transformation has not yet started. However, there seems to be a slight change in the P phase distribution. On the contrary, during water quenching from 920 °C, the a' martensitic transformation
from the decomposition of P phase occurred. The mixture of a' and p phases appears in light grey in SEM micrograph (Fig. 5(b), (c)). As proved by Malinov et al. [22] and Dehmas et al. [24], the dissolution of the a phase into p phase is really fast (approximately <lümin). After heat treatrnent and quenching, the a phase amount was obtained to be about 33 vol.% for both holding limes (20min and 210min). Il is also noticed that the number density of a nodular grains measured by image analysis was found to be about 50 092 particles/nun2 and
I 6 388 particles/ nun2 after 20 min and 210 min holding time, respectively.
A difference on the a grain size was also observed with d0 = 3.2± 1.1 µm
and d0 = 5.5±1.9 µm after 20min and 210min holding lime, respectively. The evolution of these microstructural features highlights a coarsening activation with the holding time at 920°C [16].
3.3. Thenno-mechanical behaviour
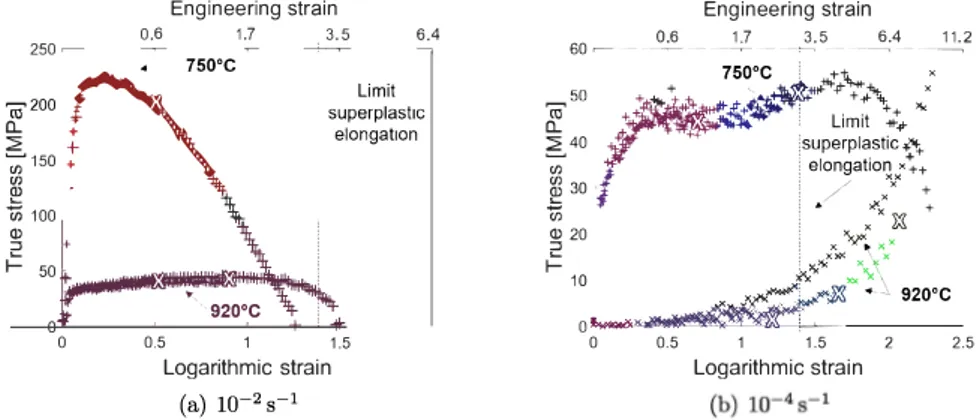
Fig. 6 represents the true stress and logarithmic strain curves ob tained after !ensile test at two temperatures (750 °C and 920 °C) and
two strain rates 00-2 ,-1 and 10-4 s-1 ). Interrupted tensile tests for the further characterizations are represented by yellow cross symbols (Fig. 6). The temperatures of 750 °c and 920 °c were chosen because
the p phase fraction varies significantly and may have an impact on the mechanical behaviour: around 12 vol.% at 750°C and 52 vol.% at
920 °C (Fig. 4). It can be noticed that the stress-strain responses from
interrupted !ensile tests perforrned under the same conditions are, for the most part, comparable. Only a slight difference can be seen for the lower strain rate (10-4 s-1) at 920 °c.
Three different flow behaviours are mainly observed depending on the strain rate and the temperature: a softening of the stress, a steady
�
1è... C: Q) Q. d 100- - - -
-80\
\ 60 1 1 40t
a phase fraction 20o�---�--�---�
0 200 400 600 800 1000 Temperature (0C] Thermo-Calc+
ExperimentFig. 4. a phase fraction evolution as a function of the temperature at the as-received
Ti-6Al-4V state obtained by image analysis on SEM-BSE images following the RD/ID plane.
state flow or a high hardening. The drop in stress level is mainly related to the necking of the sample. The condition at 920°C-10-4 ,-1 is the only
condition not to have been to failure. In the literature, a superplastic condition is defined by an elongation greater than 300% and a m value higher than 0.3 [25]. A superplastic elongation, which corresponds to an engineering strain greater than 300%, can be shown for each
condition except the one with the highest strain rate and the lowest temperature. At high strain rate, the flow stress rapidly increases in the initial stage of deformation for the both temperatures. After the peak stress, the stress decreases (750 °C) or remains constant before slightly
increasing (920 °C). At slow strain rate, al 750 °C, after an initial strain
hardening and a slight softening, a steady-state flow characteristics of a superplastic flow occurs and is followed by a slight strain hardening and by a strain softening until the failure. At 920 °C, the stress-strain curves reveal a pronounced flow hardening with a low stress level on the first deformation stage.
3.4. Microstructural evolution during hot tensile test 3.4.1. Size and morphology of the a phase
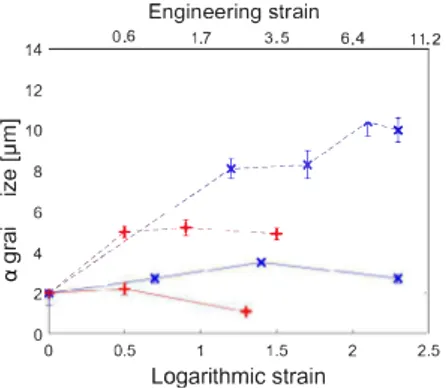
Fig. 7 shows the evolution of the a grain size determined by image analysis after interrupted !ensile tests al different elongation levels for
750 °c (solid line) and 920 °c (dotted line) and for two strain rates:
10-2 ,-1 (red symbols) and 10-• ,-1 (blue symbols).
At 750°C and for the highest strain rate (10-2s-1), no evident evolution of the a grain size is noticeable at low elongation level ( corresponding to the beginning of the softening on the true stress and logarithmic strain curves in Fig. 6), while a grain refinement is found to be at the failure. For the lowest strain rate (10-4 ,-1 ), the a grain size slightly increases until the maximum stress is reached. Then, a grain refinement occurs with less variation as compared to the higher
strain rate. In addition, SEM images also reveal that the microstructure, initially heterogeneous in terms of the morphology, becomes equiaxed at the first step of deformation (Fig. B(a)). It can be also noticed that the P phase distribution, along the a grains, as well as its size seems to have
(a) 750°C 120min
(b) 920
°C 20 min
(c) 920 °
C 210 min
Fig. S. SEM images obtained after water quenching from isothennal holding at high temperature: 750°C for 120min (a), 920°C for 20min (b) and 920°C for 210min (c).
Engineering strain 250 �- --0_._6 _ _ __ 1._7 _ _---+-' 3_._5 _ _ _6�.4 Limit ro200
Î'\
•
7500ca.
+�
+
"; 150 + superplast,c elongat1on � iii 100 \�
�
t=
50 0 0 0.5 1 1.5 Logarithmic strain(a) 10-2 s-1
Engineering strain 0.6 1.7 3.5 6.4 11.2 60 �---~---7500C ! ++. x 50 + "-��-ttt:-t't;+:ti+: x � �à;.'l«
ir
i
Li�;"::,.."'6
40 ,superplastic �"'
1
.
i elongatiortx
�+ � 30i
/
XX + 1n ! • x<)( + Q)� ' �. 2 ! ./n<- ►\ x/ 1- 10 �x,,::>S< ")l;X)(w.,,,\ .X-_></'<�� ·-" 920°Co
-
�
-+---0 0.5 1 1.5 2 Logarithmic strain 2.5Fig. 6. True stress and logarithmic strain curves obtained after tensile tests at 750 °c and 920 °c following two strain rates: 10-2 s-1 (a) and 10-4 s-1 (b). Yellow cross symbols are related to the intenupted tests for the further characterizations. Vertical dotted lines represent the minimum strain characteristics of a superplastic deformation. (For interpretation of the references to colour in this figure legend, the reader is referred to the web version of this article.)
14 12 E"10 2 Q) 8 _t,! 6 ·� 4 Ol 0 2 0 0 Engineering strain 0.6 1.7 3.5 6.4 11.2
,,,r-
j
_//
�
--
-
-
-
-
-
-
i----_,t.-':�-t--- -- ---t,,�,;.
-
/_,,
;:
,
/"
0.5 1 1.5 2 2.5 Logarithmic strainFig. 7. a grain size evolution after interrupted tensile test as a function of strain rate and temperature: 750 °C (solid line) and 920 °C (dotted line). (For interpretation of the references to colour in this figure legend, the reader is referred to the web version of this article.)
changed (Figs. B(b) and B(c)). As a function of the strain rate, a huge difference in the a grain size can be noticed. By looking to the evolution of the a grain size measured after interrupted !ensile test (Fig. 7), it can be observed that by increasing the temperature (920 °C), the a grain
size increases compared to the ones obtained at 750 °C (Fig. 9). The
temperature as well as the time at high temperature might promote this effect. More specially, at 10-• s-1, the grain size seems to continuously increase along the deformation with two drops around 250% and 600% of elongation (Fig. 7, dotted blue line). On the contrary, at higher strain rate c10-2 ,-1 ), even if a high increase of the grain size occurs at the first step of deformation, then for higher elongation it almost remains the same (Fig. 7, dotted red line). As mentioned, a grain shape is modified during deformation: (i) there is a modification as compared with the initial state, certainly due ta a spheroidization or ta a rearrangement of sub-grains into nodular grains [26], (ii) the grain shape is kept after deformation and failure, which is synonymous with superplastic deformation (no elongated grain morphology).
3. 4.2. C,ystallographic orientation of the a phase
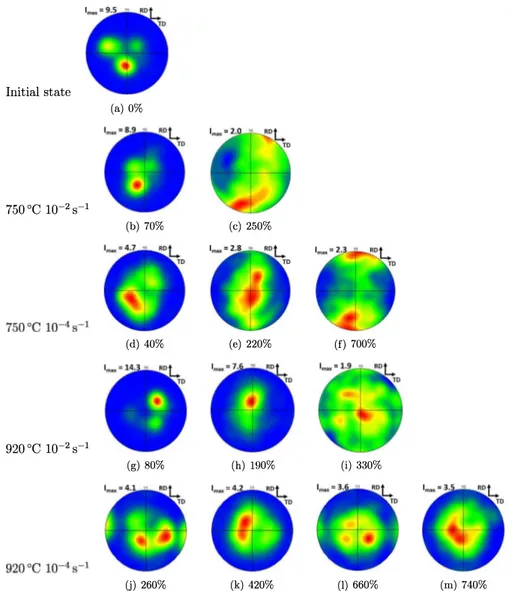
Fig. 10 displays the basal pole figures of the a phase obtained from EBSD measurements of samples at the initial state (Fig. lO(a)) and after interrupted tensile tests at different elongation levels for 750 °C (Figs. lO(b) to lO(f)) and 920 °C (Figs. lO(g) to lO(m)) at two different strain rates. At 750
°c
and for both strain rates, the crystal orientation ofa grains gradually evolved: their basal planes tend to become parallel
to the rolling direction (equal to the tensile direction). In addition, a decrease of the initial texture intensity is noticed at the first step of
deformation in particular for the lowest strain rate (from Imax = 9.5
initially to 4.7 at 10-• ,-1 ). At 920 °C, {00011
a basal pole figures mainly revealed a decrease
of the initial texture component intensity that is related to a ran domization of the a grains orientation. For the lowest strain rate, this decrease mainly occurs in early deformation stages (!max = 9.5 initially to around 4) and afterwards the !max value remains almost the same until the failure. On the contrary for the highest strain rate,
I,,,ax gradually decreases until reaching a small value at the fracture,
revealing a strong randomization of the a grain orientation, which is widely associated with the grain boundary sliding mechanism. So while at 920 °C a randomization of the texture intensity was mainly observed, at lower temperature (750 °C), the deformation applied resulted in a modification of the preferential orientation of a grains. It could be then assumed that different mechanisms of deformation should be involved. 3.4.3. Substructure evolution: nature of grain boundaries and dislocations density estimation
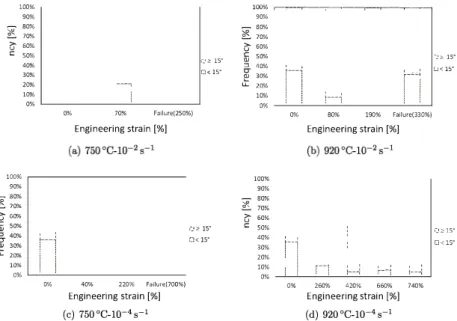
The substructure evolution is shown in terms of IAGB and HAGB distribution as well as local misorientation that can be related to dislocations density evolution (by using KAM maps). The distribution of IAGB ( < 15°) and HAGB (è': 15°) is shown in Fig. 11 for each
temperature/strain rate condition.
During tensile test at 750 °C and for the highest strain rate (Fig. ll(a)), the fraction of IAGB progressively decreases in favour of HAGB. For the lower strain rate, almost the same evolution is observed (Fig. ll(c)), except before failure (so at the higher elongation) where the fraction of IAGB increases. At 920
°c,
a high decrease of the IAGB clearly occurred in early deformation stages for both strain rates. Tuen, for the highest strain rate, an increase of the fraction of IAGB is progressively observed while the low fraction of IAGB remains almost the same until the fracture at low strain rate. As it can be assumed that these mechanisms are closely related to the dislocations activity, the density of geometrically necessary dislocations CiiGND) from the KemelAverage Misorientations (KAM) values was estimated. This parameter can be related to the local lattice curvature caused by dislocations and so to the evolution of intragranular substructures. Fig. 12 shows the KAM evolution at different elongation levels for each condition. The hatched area represents the accuracy limit of the EBSD method. Indeed, due to its angular resolution, misorientation values of subgrain boundaries Jess than or equal to 0.5° are not considered.
The KAM mean value of the as-received state is around 0.9° with a
spread curve over the KAM misorientation range. When the peak width is large, this reflects a high local plasticity in the grains and certainly a high dislocations density within the a grains [27]. Il is possible to notice that overall, for low temperatures, the peak width greatly varies. In contrast to high temperatures, where the average KAM value decreases during the first deformation step and seems to be no longer modified. This decrease is described in the literature [27] as corresponding to
(a) 40% (b) 220% (c) 700%
Fig. 8. SEM-BSE images after inteITUpted tensile test at different elongation levels for 750 °c and a strain rate of 10-4 s-1: 40% (a), 220% (b) and 700% (c) of engineering strain. (c) represenIB the microstructure at the failure. The a phase appears in dark and the P phase in light.
Fig. 9. SEM-BSE images obtained after tensile test at 920 °C at two strain rates: 10-2 s-1 (a) until the failure and 10-4 s-1 (b) without failure. The a phase appears in dark and the p phase in light.
Table 1
Summary of strain rate sensitivity (m) and activation energy (Q) for a plastic strain of 0.4 and following different temperatures.
Temperature (°C) 750 870 900 920 0.33 0.55 0.73 0.82 Q (kJ rnoJ-1) 436 259 196 175
the material recovery at high temperature. For the lowest temperature (750 'C) with the highest strain rate, the KAM distribution tends to spread when the deformation increases to 70%. However, the KAM mean value tends to decrease after failure. This could be explained by the rearrangement of dislocations in a grains into subgrain boundaries certainly linked with the influence of dynamic recrystallization. At the same temperature with a slow strain rate, the KAM mean value tends to decrease, as observed at high temperatures. This could mean that there is a lower dislocations activity in the a phase at this deformation stage. Tuen at the failure, the KAM curve seems to spread over a wider values range, maybe due to an accumulation of dislocations into the a phase at the failure.
In order to gel the spatial distribution of the dislocations density for each condition, the density of geometrically necessary dislocations PGND was calculated considering the Eq. (2) established by Ashby [28].
2Ll0
PGND
=
b.d (2)where PGND is the GND density, Ll0 is the KAM value (rad), b is the burger's vector of the a phase (b(ll20) = 2.95.10-10 m) and d is the step size used during the EBSD data acquisition. Calculated values are then used in the 11.S software to obtain a GND density map.
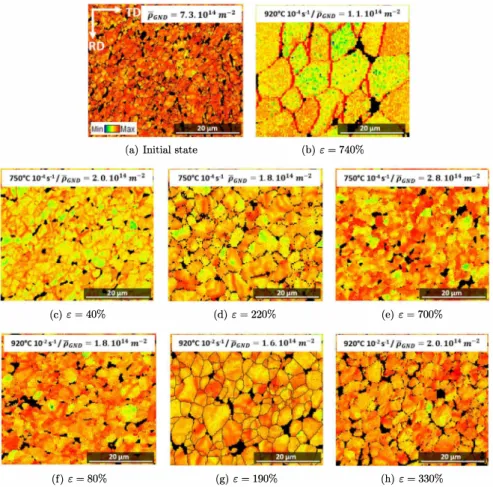
Fig. 13 shows the dislocations density maps in the a phase and corresponding mean values, calculated with Eq. (2), at the as-received state and for different conditions. At the as-received state, the plas tic strain seems accumulated, with an important dislocations density (i>GND
=
7.3 x 10¹⁴ m-2), in the a phase. At lower temperature and strainrate, the dislocations density seams localized at interfaces a/a and a/P during the deformation certainly due to a rearrangement of dislocations (Fig. 13(c)). Tuen, at failure, the GND density heterogeneously in creases in the a phase, certainly linked to dislocations activity favoured in some nodules after the grain growth observed (Fig. 13(d)). At higher temperature and strain rate and from at least 80% of deformation, the dislocations density and distribution in the a phase almost remains the same until the failure. At 920 'C but for a lower strain rate, Fig. 13(b) shows a contrast of dislocations density between the a phase and the grain boundaries. These results show a high dislocations activity in the a phase at 920 'C 10-2 s-1 (i>GND
=
2 x 10¹⁴ m-2J whereas at920 'C 10-4 s-1, a lower dislocations activity in the a phase can be
seen after the first step of deformation (i>GND
=
1.1 x 10¹⁴ m-2). Theconditions 750 'C 10-4 s-1 and 920 'C 10-2 s-1 seem to have a similar modification of the substructure in the a phase (decrease of the LAGB at the beginning of the deformation then increase at the last deformation level).
3.5. Kinetics analysis of the deformation
The deformation behaviour with a larger range of temperatures and strain rates conditions was then characterized according to kinetic anal ysis [29]. The values of strain rate sensitivity (m) reported in Table 1 were estimated at a plastic strain of 0.4 from different !ensile tests carried out at three constant strain rates
oo-
2 s-1, 10-3 s-1, 10-4 s-1)and four temperatures (750 'C, 870 'C, 900 'C, 920 'C), as shown on Fig. 14. According to the literature [ 4], the mechanical behaviour is superplastic when the m value is greater !han or equal to 0.3. Indeed, the strain rate sensitivity represents the capacity of the material to resist necking and so to provide interesting deformation stability. Note that the m values of the superplastic material are mainly between 0.4 and 0.8 [30].
The estimated m values are higher !han 0.3 regardless of the tem perature, indicating that these conditions are favourable to superplastic behaviour. In addition, the value of m increases with temperature, which indicates the increase in GBS activity with temperature [29]. This observation can also be done on Fig. 14. Indeed by increasing the temperature, high elongations are reached even for high strain rates. Warren et al. [31] describe an accommodation of the GBS by dislocations motion for m
=
0.5 and an accommodation by grain boundary diffusion for m=
1. Regarding the values estimated here, it is possible to expect to fmd some dislocations activity for the lowest temperatures while for the highest, a diffusion phenomenon.The apparent activation energy was estimated by assuming that the strain rate follows an Arrhenius-type equation (Eq. (3)).
t = Ao-"exp(- }T) (3)
where A is the material constant, R the gas constant (8.314J moJ-1 K-1 ),
T the temperature (K) and n
=
.!. is the stress exponent. Estimated ap parent activation energy values ';;,e reported in Table 1. Moreover, Ta ble 1 shows a decrease of the Q values from 750 'C to 920 'C, the value is three limes higher at low temperature !han at high temperature, suggesting that specific deformation and accommodation mechanisms are involved by increasing the temperature and so the "soft" -P phase fraction [32]. The estimated Q values are close to the reported ones (Table 2). For the lowest temperatures, the mechanism could be con trolled by GBS with dislocations motion and dynamic recrystallization. At 870 'C, the mechanism, reported in the literature with a Q valueInitial state
(a) 0% 750 °C 10-2 s-1 (b) 70% (c) 250% (d) 40% (e) 220% (f) 700% 920 °C 10-2 s-1 (g) 80% (h) 190% (i) 330% (j) 260% (k) 420% (!) 660% (m) 740%Fig. 10. {0OOl}a pole figures obtained by SEM-EBSD at the initial state (a) and after interrupted tensile tests at different elongation levels: 750°C-10-2s-1 (b, c), 750°C-10-4s-1 (d, e, O, 920°c-10-2 s-1 (g, h, i) and 9zo0c-10-4 s-1 (j, k, 1, m). Each caption corresponds to the applied engineering strain and the pole figure intensity (higher diffraction probability density).
close to the estimated Q, would be GBS with lattice diffusion involving the a phase. At highest temperatures, the mechanism would be volume self-diffusion in the p phase with a Q value lower than 200 kJ mo1-1•
The Zener-Hollomon parameter (Z) represents the temperature compensated strain rate parameter used for kinetics analysis and de fmed as follows:
Z=texp
J1r
(4)where R is the gas constant (8.314JmoJ-1 K-1), t is the strain rate applied during the tensile test (s-1 ), T is the temperature (K) and Q the apparent activation energy (kJ moJ-1 ).
Fig. 15 represents the evolution of the stress for the plastic strain of 0.4 Oog(u0.4)) as a function of the log(Z). This relationship, obtained
with the Eqs. (1) and ( 4), is almost linear for the highest strain rate,
which means the deformation is a thermally activated process [29]. Moreover there is a modification of the deformation mechanisms in volved according to the associated strain rate because a modification of the slope can be observed with the evolution of the Z parameter.
An overlap of two " values can be observed at log(Z) = 9.8. These points correspond to a temperature of 750 °C and 920 °C for different strain rates but corresponds to the same stress level. This means that the active deformation mode is similar. Il is also remarkable that one of the points has a stress value quite distant from the other conditions (right corner Fig. 15). This would mean that the GBS mechanism would not be activated under these conditions. The m values higher than 0.3 were obtained for ail conditions but with different activation energies which means that the deformation mechanisms involved should be different for each condition.
100%
�
c;-C: 100% 90% � 80% � 70% (;' 60%fi;
50% ::, 40%0-�
::
10% 0% 90% 80% 7(]% 60% 50% 4()'/4 3()'/4 20'/4 10'/4 0%�--i
i i
i !
l ! 0% ,-_,;:,,15· 1:1< 1s· --7!
0% 70% Failure(250%) Engineering strain [%] 40% 220% Failure(700%) Engineering strain [%] (c) 750°C-1Q-45-l ,-_,;,: 15" D< 15° 100% ���-�--�-�-�-� 90% ... 80% � 70% (;' 60%ai
50% ::::l 40% ' 1 � 3{}¼r--7
u.. 20%!
i
10%i i
: 1 1 �--: ' ()� ' ' ,--i -i
! !
0% 80% 190% Failure(330%) 100% 90%��:
� 60% C: 50% 40% 30% 20% 10% 0% ' ' !:! !
i
i
i
Engineering strain [%]r--1
:
1 ' ' �--i ' ' r--; ' ' 1--� 0% 260% .a20% 660% 740% Engineering strain [%] (d) 920 °c-10-4 s-1 -.!<:!" 15° ':.�< 15" i"J<:!15° Ci< 15"Fig. 11. Misorientation distribution obtained by SEM-EBSD after interrupted tensile tests at different elongation levels: for two temperatures (750°C (a, c)-920°C (b, d)) and two
strain rates (10-2 s-1 (a, b)-10---4 s-1 (c, d)).
40 3S �30 > 2S u
[i
20 5-15 � 10 u.. 40 3S �30 �25 � 20 5"1s � 10 u.. 0.5 1.5 KAM [0] (a) 750 °c-10-2 s-1 0.5 1 1.5KAM[
°]
(c) 750°C-10-4s-l 40 3S �30 > 2S u � 205"
15 � 10 u.. 40 3S �30 >2S u �20 5"1s �10 u.. -♦-0% -+-BO% --•·-190% ----Fa il ure (330%) 0.5KAM [
0] (b) 920°C-10-2s-1 0.5 1KAM [
0] (d) 920°C-10-•s-1 1.S 1.5•
,
/
Fig. 12. Kernel Average Misorientation (KAM) obtained from EBSD map for two temperarures (750°C (a, c)-920°C (b, d)) and two strain rates
oo-
2s-1 (a, b)-10---4-s-1 (c, d)). Thehatched area represents the accuracy limit of the EBSD method.
4. Discussion
As previously introduced, it is widely reported that the superplastic mechaoisms in two-phase titaoium alloys are mainly related to grain
boundary sliding accommodated by dislocations slip/creep aod/or dif fusion. In particular, it is supposed that most of the accommodation mechaoisms are carried out by the p phase, which has larger number of slip systems aod a higher atomic diffusivity than a. These mecha nisms can change with increasing the strain. Moreover, microstructural
(a) Initial state
(b) ë = 740%(c) E = 40% (d) ë = 220% (e) E = 700%
(f) E = 80% (g) E = 190% (h) ë = 330%
Fig. 13. Dislocations density distribution: at the as-received state (a), at the last interrupted point at 920 °c 10-4 s-1 (b), at different deformation levels at 750°C 10--i s-1 (c-e) and
920 °c 10-2 ç1 (f-h). The mean value of geometrically necessary dislocations P
GND obtained is shown on each map. (For interpretation of the references to colour in this figure
legend, the reader is referred to the web version of this article.) Table 2
Summary of activation energy reported in the literature.
Activation energy Q (kJ mo1-1) Reported defonnation mechanisms 121-132
170 184-188 242-264 522
Grain boundary self-diffusion for an a Ti [12,33] Self-diffusion for a Ti-6Al-4V alloy in p region [32] GBS accommodated by dislocation slip/creep mechanism [34] Nabarro-Herring creep, volume diffusion for an a titanium alloy [12,33] Dynamic recrystallization in a + P region [32]
evolution by dynamic recovery, recrystallization and/or grain growtb are often observed. This study, on the mechanical behaviour at high temperature of a fine-grained Ti-6Al-4V alloy, revealed that this alloy exhibits different changes in deformation mechanisms depending on the temperature and the strain rate. Indeed these changes are high lighted by the mechanical behaviour evolution, the values of both the strain rate sensitivity and the activation energy that can be related to microstructural and microtextural modifications which are the grain size, grain shape, phase fraction and texture.
First of al!, by comparing these experimental results with those obtained for Ti-6Al-4V currently used for superplastic forming (i.e. with an a grain size around 10 µm [2]), it can be confirmed that by decreas ing the size of the a nodules, the superplastic behaviour at 750 °C is improved. However, by increasing the strain rate, the steady-state flow
characteristic of superplastic behaviour seems to be favoured by an increase in temperature (Fig. 6(a)).
At low temperature (750 °C) and high strain rate 00-2 s-1 ), the studied alloy exbibits a strain rate sensitivity parameter m higher than 0.3 and an elongation of 250% which is lower than that of superplastic materials (>300%). These two parameters indicate that the superplastic effect is probably weak. Moreover the activation energy value calculated (Q = 436kJmol-1) is clearly higher than activation energy involving self-diffusion mechanisms [17,35] and tends to values linked to dynamic recrystallization which is generally associated with
the dislocations activity /storage. The softening shown before failure is similar to the behaviour reported in the literature [14,25] that is related to dislocations activity. Thus, the mechanism controlling the deformation, at low temperature and high strain rate seems not to be
Engineering strain 0 .6 1.7 3.5 6.4 11.2 250
.---
-=
c--
� -
--- -
�- -
-- -
,
10·2s·1o
.,,_
--�--
--Yf-
-�-
-",,_._
�
--
�
0 05 1 15 Logarithmic strain(a) 750 °C
Engineering strain 25 70 �--o,6 ....__ �1"c.7 __ 305 __ 6.�2 60ro
0.. 50è,
+ u, 40 � 30 a, � 20 10 0.5 1 1.5 Logarithmic strain(c) 900
°C
2.5 100è,
60 40 20 ro4o o.. "'; 30 � 20 + a, � 10 0.6 Engineering strain 1.7 3.5 0.5 1 1.5 Logarithmic strain(b) 870 °C
Engineering strain 0.6 1.7 3.5 6.4 11.2 2.5 6.4 11.2o
l_
0+a11,
��
05=
:::.._
1--�--�-__J
15 Logarithmic strain(d) 920
°C
25Fig. 14. True stress and logarithmic strain curves obtained after tensile tests at 750°C (a), 870°C (b), 900°C (c) and 920°C (d) following three strain rates: 10-2s-1, 10-3s-1 and
10-4s-l. 1000000 �---� 100000 10000 X 1000 ◊ 100 10 --·�·-o···-X··· t l' ◊ X X750'C X870"C ◊900"( 920°( 1 �--��--�---�---�---J 7.00 8.00 9.00 10.00 11.00 12.00 Log(Z)
Fig. 15. o-0_4 in log scale as a fonction of log(Z) illustrating a large variation of Z
parameter with the temperature.
mainly related to GBS but ratber to tbe dislocations activity leading to tbe continuous dynamic recrystallization (CDRX) (as noticed with tbe decrease of botb the IAGB fraction and a phase grain size) [14,36]. Moreover, regardless of the deformation level at 750 °c, a decrease of tbe overall texture intensity associated to a change of tbe crystal lographic orientation of (0001)0 basal planes is observed and can be
also related to dislocations activity witbin a grains (Fig. lO(c)). Indeed, it is mainly reported tbat grain rotation accompanied by GBS leads to a homogeneous randomization of the preferred orientation [37] while intragranular dislocations activity would be more consistent witb texture changes [38].
On the contrary, for the highest temperature and tbe lowest strain rate (920 °C 10-4 s-1 ), tbe alloy shows a high elongation (740%) associ ated to a high m value (0.82) and a low apparent activation energy (Q = 175 kJ moJ-1) tbat should evidence an interesting superplastic behaviour. We can noticed tbat tbe m value is higher tban tbe value obtained by Alabort et al. for a grain size of 6 µm [15], which highlights tbe impact of tbe initial grain size on tbe behaviour of tbe material. Even if tbe alloy exhibits an initial low flow stress, an important hardening is noticed by increasing tbe strain. The high temperature associated to tbe low strain and the hardening make tbus tbe forming of tbis alloy in these conditions both expensive and inefficient. Il is important to notice, tbat contrary to what it is usually mentioned in tbe literature, tbe high hardening behaviour cannot be explained in totality by tbe a grain growth. Indeed, in tbe FG titanium alloy, tbe
a grain growtb occurred mainly in tbe early deformation stage (Fig. 7), whereas the flow stress highly increases over an elongation of 420%. So it is believed tbat otber changes at tbe microstructural level, in addition to tbe a grain growtb, should be involved in tbis hardening. In particular, at 920 °C, it is important to remind tbat tbe p phase fraction (52 vol.%) is almost equivalent to tbe a phase fraction (48 vol.%). Moreover as tbe alloying elements diffusivity in tbe P phase is two times faster tban in tbe a phase, the high temperature microstructure can tbus be considered as composed by non-deformable a grains surrounded by deforming p phase [38,39]. As a result, increasing tbe distance between a grains and changing tbe spatial distribution of tbe two phases result in a significant change oftbe number and type of interfaces (a/P, a/a, p / p). Il can be assumed a lower occurrence of GBS mechanism witb tbe decrease of tbe area fraction of a/ p interfaces favourable to GBS [9] as tbe sliding resistance of a/ a and p / p boundaries are reported to be
higher than a/ p interfaces. Nevertheless, at 920 'C, the post-mortem SEM observations cannot highlight any microstructural changes in p due to the slow cooling applied. At this high temperature (920 'C), the small KAM dispersion obtained (Fig. 12(b) and (d)), associated to a strong decrease of the average KAM value suggests that there are few local defects in the a phase and that the deformation is clearly controlled by the p phase. Indeed the p phase having a rather high stacking fault energy and a high diffusivity, it will favour both, the reduction of the dislocations density during deformation by dynamic recovery [11,40] and also bulk diffusion mechanisms that, at low strain rate, can easily lead to dynamic coarsening in p and so to changes of the number of p / p interfaces. Judging from the values of the activation energy as well as the results of the microstructural observations, it would appear that the predominant deformation mechanism may be supported by the p phase, like a volume self diffusion and a diffusion at interfaces (a/P or P/P), favoured by the high temperature and the low strain rate applied.
One interesting result in this study concerns the similar flow be haviour observed for two different conditions of temperature and strain rate (750 "C 10-• ,-1 and 920 'C 10-2 ,-1) on Fig. 6. Indeed, a super
plastic flow behaviour with a similar stress level (about 45 MPa) was noticed for these two conditions. However, as previously explained, at these two temperatures (750 'C and 920 'C), the a and p phases fractions, the strain rate sensitivity m as well as the apparent activation energy Q are distinctly different implying that the mechanisms of deformation operating are not the same even if there are similarities of flow behaviour. Note also that at 920 'C 10-2 ,-1 the alloy exhibits a lower elongation and a more stable flow behaviour than at 750 'C
10-• ,-1.
At low temperature (750 'C) and low strain rate, the deformation will be mainly controlled by the a phase as ils volume phase fraction is around 88%. The steady state flow characteristics of superplastic flow observed and the m value of 0.33 calculated could be representative of GBS activation. At the first deformation step, microstructural studies reveal that the alloy has more equiaxed grain and more HAGBs than before deformation, which can be attributed to an initial poligonization process by dynamic recrystallization. This refined microstructure (with sufficient homogeneous p phase distributed around a grains) could promote GBS activation [ 41] by increasing the strain. Moreover, no modification of local plasticity in the a phase was shown (Fig. 12(c)), which could highlight that the predominant deformation mechanism would be GBS with accommodation by dislocations motion at grain boundaries a/ p. By comparison with the work of Alabort et al. [15], for an a grain size of 6 µm and a temperature of 700 'C, the p phase was not suitable to accommodate the deformation (cavities formation at interfaces). However, in our study, a p phase fraction of 12%, asso ciated to a higher number of grain boundaries (due to a lower a grain size than in the work of Alabort et al. [15]) seems quite appropriated. The increase of the a grains size shown at a stress level of 220% could induce the slight hardening noticed for this stress level. Indeed, at this slow strain rate, the dynamic coarsening can occur more readily during the longer deformation time. Finally, a dislocation activity favoured in the larger a grain, at the end of the deformation, could explain the change in the preferential orientation of grains as well as the increase in dislocations density.
Regarding the 920'C 10-2 s-1 condition, the higher p phase fraction
present at this temperature suggests that the mechanisms will mainly involve the p phase. Nevertheless, the high strain rate should prevent high diffusion mechanisms from occurring into p compared to a slow strain rate. Even if the a phase will play the role of inclusion in a soft p phase during the deformation, the stresses will be mainly localized at the p / p grain boundaries (Fig. 13(!)) and thus lead to their motion. This mechanism corresponds to the GBS accommodated by the alloy elements diffusion [37]. Indeed the first step to accommodate the deformation is the alloy elements diffusion from either the core mantle or from the p grain leading then to the grain boundaries motion. The
main deformation will be thus the GBS accommodated by diffusion in the P phase. This hypothesis is moreover confirmed thanks to the pole figures obtained by EBSD (Figs. lO(g), lO(h) and lO(i)), which show that the texture in the a phase does not change much except at the failure. Indeed due to the high strain rate applied, the diffusion in the P phase is limited. The stress is then undergone by the a phase through the dislocations motion leading to the dynamic recrystallization in the a phase, as observed for the condition at 750 'C 10-4 s-1• If we compare
our experimental observations as well as the calculated activation energies with those obtained in the literature, it would appear that the mechanisms described are quite similar [33,34]. In consequence of these two conditions (750 'C 10-• ç1 and 920 'C 10-2 ,-1 ), the alloy has
similar stress levels but the deformation mechanisms are respectively activated and accommodated by different energy levels and phenomena (dislocation motion, diffusion).
5. Conclusions
In this contribution, high temperature deformation mechanisms of the as-received Ti-6Al-4V titanium alloy with an a grain size of 2 µm were investigated by interrupted tensile tests and SEM/EBSD for two significantly different temperatures (750 'C and 920 'C) and two strain rates c10-2 ,-1 and 10-• ,-1 ). The following conclusions have been made:
1. Superplastic behaviour was obtained at low temperature (750 'C) and low strain rate
oo-
4 ,-1 ).2. The microstructural observations at different steps of deforma tion at 750 'C 10-4 ,-1 showed a complex evolution leading to the
activation of different deformation mechanisms by increasing the strain. At first, a rearrangement of dislocations leads to the formation of nodular a grains followed by the activation of GBS accommodated by dislocations in smaller a nodules and in the p phase. Thereafter, a slight hardening was observed explained by an increase of the a grains size. Finally, a continuous dynamic recrystallization is activated due to an accumulation of stress in the a phase. The deformation is mainly controlled by the a phase and accommodated by the surrounding P phase.
3. The superplastic behaviour, also obtained at high temperature (920'C) and for a high strain rate (10-2 ,-1), is attributed to the activation of different deformation mechanisms than at 750 'C. In particular, the GBS seems to be the main mechanism of deformation but accommodated differently at 750 'C and 920 'C. While at 750 'C, the accommodation can be by dislocations glide at a/ P interfaces and in some a grains, at 920 'C, the deformation is assumed to be accommodated by the p / p grain boundaries motion favoured by the alloy elements diffusivity in p. 4. At 920 'C 10-• ,-1, a high hardening was obtained with a su
perplastic elongation. These high hardening cannot be only ex plained by the grain growth observed. Regarding the activation energy and the texture evolution, a main mechanism in the p phase can be expected, like volume self-diffusion [32] and diffusion at a/ p and p / p interfaces. Indeed at this temperature, there is a huge change of the number of a/ p interfaces due to an increase of the p phase fraction which is in favour of a deformation supported by the p phase.
5. At 750 'C and 920 'C, the deformation mechanisms are mainly controlled by respectively the a phase and the p phase. CRediT authorship contribution statement
Laurie Despax: Conceptualization, Formai analysis, Investigation, Writing original draft. Vanessa Vidal: Conceptualization, Writing -review & editing, Funding acquisition, Supervision. Denis Delagnes: Conceptualization, Writing - review & editing, Resources, Supervision. Moukrane Dehmas: Conceptualization, Writing - review & editing, Su pervision. Hiroaki Matsumoto: Funding acquisition, Resources, Writ ing - review & editing. Vincent Velay: Resources, Writing - review & editing.