Open Archive TOULOUSE Archive Ouverte (OATAO)
OATAO is an open access repository that collects the work of Toulouse researchers and
makes it freely available over the web where possible.
This is an author-deposited version published in :
http://oatao.univ-toulouse.fr/
Eprints ID : 16051
To link to this article : DOI : 10.1016/j.memsci.2016.07.061
URL :
http://dx.doi.org/10.1016/j.memsci.2016.07.061
To cite this version :
Benavente, Lucia and Coetsier, Clémence and
Venault, Antoine and Chang, Yung and Causserand, Christel and
Bacchin, Patrice and Aimar, Pierre FTIR mapping as a simple and
powerful approach to study membrane coating and fouling. (2016)
Journal of Membrane Science, vol. 520. pp. 477-489. ISSN
0376-7388
Any correspondence concerning this service should be sent to the repository
administrator:
staff-oatao@listes-diff.inp-toulouse.fr
FTIR mapping as a simple and powerful approach to study membrane
coating and fouling
Lucia Benavente
a, Clémence Coetsier
a, Antoine Venault
b, Yung Chang
b,
Christel Causserand
a, Patrice Bacchin
a, Pierre Aimar
a,naLaboratoire de Génie Chimique, Université de Toulouse, CNRS, INPT, UPS, 118 Route de Narbonne, 31062 Toulouse, France
bR&D Center for Membrane Technology and Department of Chemical Engineering, Chung Yuan Christian University, 200 Chung Pei Rd., Chung-Li 32023,
Taiwan Keywords: Membrane modification FTIR Coating Fouling Heterogeneity
a b s t r a c t
The purpose of this work is to apply FTIR mapping to the analysis of the coating and fouling behaviour of PVDF membranes coated with two different types of PS-PEGMA copolymers – diblock and random. The coating conditions involve the variation of coating solution concentration and of coating time. We have carried out adsorption experiments with BSA as the foulant, and also filtration experiments. The analysis of the results is mainly performed by image analysis of the mapped surfaces with two approaches: taking the average grey value/peak height of the whole surface for the coating and foulant signals, and by defining coating/fouling levels as an initial approach to analyse heterogeneity. Our results show that there is an heterogeneous distribution of the coating and fouling layers on the membrane surface at a millimetre scale. Moreover, the diblock copolymer has a slightly better anti-adsorption performance than the random one. Coating conditions should be carefully chosen and conclusions regarding the anti-fouling properties of the membranes should be drawn by taking into account both adsorption and fil-tration tests. All in all, FTIR mapping is a technique that should be taken into account for the study of fouling phenomena.
1. Introduction
Membrane technologies as separation processes have proved to be a go-to solution for the treatment of water and wastewater. Easy scale-up, low temperature operation, and space-efficiency of plants are among some of the advantages of the use of membranes for the filtration of fluids.
However, the fouling of the membrane structure – surface and pores – is one of the key problems membrane researchers have to overcome to render more efficient and attractive processes.
Fouling can be classified as reversible or irreversible; when the permeate flux can be restored by means of a gentle cleaning protocol then the fouling is mostly reversible. On the other hand, when we need to apply harsher chemical cleaning, we are in the presence of irreversible fouling. Some parameters of the mem-brane surface that affect fouling are: hydrophilicity, roughness, charge and steric hindrance/repulsion.
One of the approaches to manage fouling is the modification of the structure of the membranes to produce materials that will
repel foulants from their structure and/or make fouling more re-versible. The modification of polymeric membranes can be carried out in different ways. Physical methods include the adsorption of a hydrophilic-hydrophobic component on a hydrophobic membrane – also known as coating – or its addition in the polymer dope before casting – blending. Chemical modification of the mem-branes involve the grafting of a chemical group onto their struc-ture[1].
A large part of these modification techniques focuses on the increase of the hydrophilicity of the membranes[2–5]since most of the foulants – proteins, bacteria – are of a more hydrophobic nature, although it is possible to find literature where more hy-drophobic surfaces could be less fouled than hydrophilic ones[6]. The addition of a negative charge or of zwitterionic charged ma-terials on the membrane structure has also been reported to im-prove the anti-fouling properties of membranes[7,8]. Fouling can also be decreased when long polymer chains are added onto the membrane structure, since there will be an increase in the re-pulsive steric interactions among others[9].
No matter how we approach the membrane modification issue, we need to be able to properly characterize, first, the modification that has been carried out, and then the anti-fouling properties of these membranes.
http://dx.doi.org/10.1016/j.memsci.2016.07.061
n
Corresponding author.
Several techniques are widely used to assess the presence of the modifying agent, hydrophilicity of the membrane, and ad-sorption of the foulant. The most direct method to determine the hydrophilicity of the membrane is the water contact angle analy-sis. It is a quite simple method, with an easy sample preparation and results do not require a big expertise for their processing. However, results can be affected by changes in pore size, rough-ness, porosity and pore size distribution. Fourier-transform infra-red (FTIR) spectrometry has been used to qualitatively assess the modification process and sometimes of the foulants. The peaks that can be measured on these spectra correspond to a particular bond stretching, allowing the identification of the chemical spe-cies on the sample[10,11]. Sample preparation and data analysis is quite simple, although the technique is limited to the analysis of the surface of the membrane. Atomic force microscopy (AFM) can be used to measure surface roughness. When used in force spec-troscopy mode specific particles are attached to the probe, and it is possible to measure surface-particle interaction forces[9]. These particles can be very varied depending on which kind of system researchers want to study and their experience the team has with attaching them to the probe. A drawback of AFM is that it is a very local measurement. If the surface of membrane is not perfectly homogeneous, as it is generally assumed when membranes are produced, it might not be possible to get a realistic view of the coating homogeneity. The adsorption of foulant species can be determined by UV spectrophotometry (proteins) [2], confocal microscopy (blood cells and bacteria), X-ray photoelectron spec-troscopy (XPS)[12] or sometimes with scanning electron micro-scopy (SEM)[13]. The determination of fouling by most of these techniques can be regarded as static, foulants reach the surface by diffusion and adsorb, and then its presence and concentration is determined. It is an indication of the behaviour and properties of the system but they have not to be regarded as the absolute truth. These membranes are supposed to be used for filtration set-ups or in systems that there will be a flow, thus final fouling behaviour can be different.
To better assess the effect of the modification in the antifouling properties of the membrane it is always necessary to perform filtration tests. They normally involve one filtration and cleaning cycle with the determination of pure water fluxes and evolution of the foulant solution flux. More interesting data can be obtained when more than one fouling-cleaning cycle is performed, since it emulates the way membranes are operated in reality. Some of the previously-mentioned analytical techniques can be applied to analyse the fouled membranes after filtration has been carried out to complement the obtained results.
One interesting extension of the FTIR technique is FTIR micro-spectrometry. Here, the infrared interferometer is coupled with a microscope that has specialised detectors, giving the possibility to scan a surface and get chemical maps of the sample. In this way, it is possible to detect polymers and other compounds – like proteins – and their distribution on the surface[14,15]. FTIR imaging has been extensively used in biomedical, biomaterials, and tissue studies[16,17]. Using this technique for the scanning of the surface of modified membranes that have been modified and fouled could yield interesting results concerning the modification itself and the adsorption – or fouling depending on the method used – of the foulant. There is little bibliography on this subject concerning fil-tration membranes. On one conference paper the authors used FTIR microscopy so see the distribution of the fouling of a mem-brane used in a desalination plant[18]. In it, they quickly show the distribution of different foulants – proteins, polysaccharides and inorganic species – with the proteins being the major component found on that fouling layer. Other authors use attenuated total reflectance Fourier-transform infrared (ATR-FTIR) microspectro-scopy combined with a multivariate analysis to study the effect of
fouling agents on membranes and to evaluate cleaning protocols
[19]. The data collected on this work does not seems to have been treated as a surface map, but more as averaged or independent values. Another group studied the fouling on PES membranes used in the milk industry [20]. In this case, the resolution of the equipment was adjusted so a large area of the membrane could be analysed. Thygesen et al.[21]also used ATR-FTIR imaging to assess different cleaning techniques on the composition of the foulant layer of polypropylene (PP) and polytetrafluoroethylene (PTFE) membranes. They identify three types of foulants – proteins, lipids, and carbohydrates – and perform a k-clustering analysis re-presenting the results as membership maps.
FTIR maps yield very interesting pieces of information, yet the question remains on how we could obtain more data out of them. By having the chemical distribution maps of the modification agent and the foulant for the same surface it should be possible to improve the critical analysis and, hopefully, get a better under-standing of the relationships between the modification of the membrane and its fouling behaviour.
Therefore, the main goal of our work is to apply FTIR mapping and develop the data analysis protocol necessary for the assess-ment of the modification of polyvinylidene fluoride (PVDF) membranes by coating Polystyrene and poly(ethylene glycol) methacrylate (PS-PEGMA) copolymers, and its adsorption/fouling behaviour. To reach this goal, we use two different types of co-polymers – diblock and random – and vary some of the coating parameters: copolymer solution concentration and coating time. We use image analysis software to measure the coating and fouling presence on the maps, either by taking averages or by defining coverage/adsorption levels. When necessary we carry out other more classic experiments to complement the data obtained from the FTIR mapping analysis.
2. Materials and methods
2.1. Materials
Polyvinylidene fluoride (PVDF) (Kynars, M
w¼ 150,000 g/mol) was washed with methanol and deionized water before use. N-methylpyrrolidone (NMP) was used as solvent without any further purification (Tedia). The ethanol (EtOHabs) used for
solu-bilizing the copolymers was provided by VWR Prolabo Chemicals (AnalaR NORMAPUR). Bovine Serum Albumin labelled with fluor-escein isothiocyanate conjugate (BSA-FITC, A9771) was acquired from Sigma Aldrich. For the filtration experiments BSA A3059 from Sigma Aldrich was used. Phosphate buffered saline solutions (PBS, pH¼7.4) were prepared from concentrated PBS bulk solution from Fisher BioReagents (BP399). Ultrapure water used in the experi-ments was purified from the osmotic water obtained from an ELGA PURELAB Prima purification system with an ELGA PURELAB Classic water purification system (final minimum resistivity of 18 M
Ω
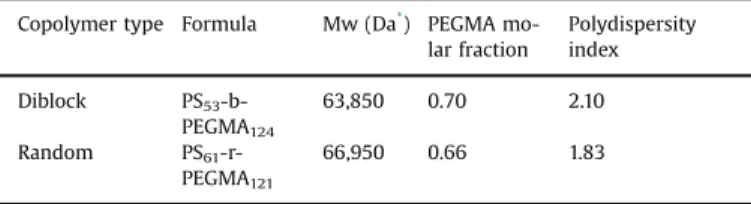
cm).Polystyrene (PS) and poly(ethylene glycol) methacrylate (PEG-MA) copolymers were synthesised by the R&D Centre for Mem-brane Technology and Department of Chemical Engineering of the Chung Yuan Christian University in Chung-Li, Taiwan. Random (PS-r-PEGMA or RND) and diblock (PS-b-PEGMA or DB) copoly-mers were used with the repeated units of PS and PEGMA shown in the table below (Table 1). More detailed information on how these copolymers are synthesised can be found in[22].
2.2. Methods
2.2.1. Membrane casting
25 wt% of PVDF was dissolved in 75 wt% NMP at 40 °C and stirred for at least 24 h until homogeneous blend was obtained. After solutions were well rested and stopped bubbling, membranes were prepared using the liquid-induced phase separation process. Casting was done on a glass plate with a metal casting knife with a height of 300 mm. Glass plates were immersed in ultrapure water to induce phase separation and membranes were kept in water for 24 h. Afterwards, membranes were dried at room temperature for 24 h before use. The obtained membranes have a pore size of 43 nm, measured by capillary flow porometry, and an example of the pore size distribution graph can be found in the Supplemen-tary material(Section 3,Fig. S3). Other membrane properties can be consulted on a previous work by Venault et al.[24].
2.2.2. Coating
Copolymer solutions were prepared adding EtOHabsto weighed
amounts of copolymer and stirring overnight to ensure complete dissolution. The concentrations ranged from 1 to 10 mg of copo-lymer per mL of ethanol.
The procedure to modify the virgin membranes was as follows. The PVDF membranes were left in contact with the corresponding copolymer solution at 25 °C.
For the experiments done at constant coating time, this value was set to 2 h and the coating solution concentrations used were of 1, 5 and 10 mg of copolymer per mL of ethanol. The virgin membranes were treated the same way as the coated ones but using pure absolute ethanol solution instead of the copolymer one. For the experiments carried out at constant copolymer con-centration, a 5 mg/mL copolymer solution was used and the coating times varied between 0 and 8 h.
The membranes were rinsed three times with PBS solution after the coating was performed to remove non-adsorbed or loosely adsorbed copolymer.
2.2.3. BSA adsorption – fouling
For the preparation of 1 g/L BSA-FITC, the albumin was
weighed, dissolved in PBS and stirred for 1 h. The mother solution was divided in 1 mL aliquots and stored at "18 °C. For all the preparation and storage steps the containers were wrapped in aluminium foil to avoid contact with light.
For the filtration experiments the 1 g/L BSA solution (A3059) was prepared the day before the experiments were carried out.
After membranes were modified BSA adsorption was carried out. First, PBS was poured onto the membranes and left in contact for 12 h at 25 °C to hydrate the copolymer structure. Afterwards, the PBS was removed and 1 g/L BSA-FITC solution was added to the hydrated membranes for 2 h at 25 °C. The foulant was rinsed three times with PBS and membranes were dried at 35 °C for two hours.
2.2.4. Contact angle
Contact angle measurements were carried out by dropping 4 mL water droplets on a dry membrane at 10 different sites and mea-suring the contact angle in air at 25 °C until reaching thermo-dynamic equilibrium at the three-phase interface (constant value) with an angle-metre (Automatic Contact Angle Metre, Model CA-VP, Kyowa Interface Science Co., Ltd., Japan).
2.2.5. Coating density
Coating density was determined by performing a mass balance between the unmodified and modified membranes. First, the membranes were dried overnight at 37 °C and their dry weights were registered (WD). The coating was performed as specified by
the experimental parameters and the membranes were dried at 37 °C overnight. Modified membranes weights were then regis-tered (WM). Coating density with respect of membrane area
(Amembrane) was calculated as follows:
= − ( ) Coatingdensity W W A 1 M D membrane
For each experimental condition, the final coating density is an average of five dry weight measurements. The average experi-mental uncertainty was of 70.02 mg/cm2.
2.2.6. FTIR mapping
The membrane surfaces were scanned with an infrared spec-trometer (IN10MX Thermo Scientific) under reflection mode with an analysed surface of 50 # 50 mm for each point (one point was measured every 50 mm). The spectral resolution is 8 cm" 1, and 16
scans are acquired on each measurement point. The spectrometer is equipped with MCT-A detector cooled with liquid nitrogen, and a KBr beamsplitter. The measurements were made using a gold mirror as a reference, and external reflection was used as the
Table 1
Copolymers used for membrane modification: Formula, molecular weights (Mw), PEGMA molar fraction and polydispersity index.
Copolymer type Formula Mw (Da*) PEGMA
mo-lar fraction Polydispersity index Diblock PS53 -b-PEGMA124 63,850 0.70 2.10 Random PS61 -r-PEGMA121 66,950 0.66 1.83
*1 Da¼1 Da¼1 g/mol.
Fig. 1. Sample spectra of a coated and fouled membrane with additional information on the Peaks of interest, functional groups related to them and to the compounds present in our study.
acquisition mode. The obtained spectra were no further processed, except for the atmospheric correction. External reflection was chosen instead of attenuated total reflection (ATR) because the penetration depth is smaller, thus thin depositions of compounds are easier to detect and peaks are more defined. External reflection allows to detect superficial modifications, while with ATR the signal coming from deeper layers of the material is more
predominant, since the evanescent wave created by the internal reflection inside the crystal penetrates the sample.
Dry membranes were attached onto microscope slides and analysed under the FTIR equipment.
The obtained chemical maps can have a size of around 2 by 2 mm and are colour coded with respect of peak height intensity. Low intensities are coded as blue and highest as red; intermediate
Fig. 2. Colour (up) and grey (down) scale bars for peak heights between 0.0 and 0.5. (For interpretation of the references to colour in this figure legend, the reader is referred to the web version of this article).
Fig. 3. Diagram of the filtration protocol.
colours are light blue, green, yellow and orange (ordered on in-creasing intensity). Higher peaks are related to more presence of that compound on the sample.
A sample spectra with information regarding the peaks of in-terest is shown in the figure below (Fig. 1). The sample corres-ponds to a modified membrane with BSA adsorbed on its surface. For each experiment, peak heights were measured by taking the baseline limits at similar wavenumbers. More information on the reflection technique used and the peaks of interest can be found in theSupplementary material section (Section 4). Since the pene-tration depth of the reflection technique would be in the mm order whereas the adsorbed layers on the nm order, alterations in focus due to the additional layers of copolymer and BSA were considered to have a limited impact on the measurement.
Several authors already established the correspondence be-tween these peaks and the compounds present in our system
[13,23,25]. The peak corresponding to the CQO stretching present on the PEGMA structure is found at a wavenumber of approxi-mately 1737 cm" 1. Since this is the hydrophilic polymer on our
modifying copolymer, maps created based on this signal are re-lated to “hydrophilicity maps”, whereas the peak at a wavenumber of 2876 cm" 1corresponds to the aliphatic C–H bonds present in
the general copolymer backbone, therefore general copolymer presence and distribution on the membrane surface can be related to this signal. In the same way, the foulant can be detected by
measuring peak heights at a wavenumber of 3300 cm" 1, hence
rendering “fouling maps”.
2.2.7. Calibration curves
The colour scale of the maps obtained in our work was adjusted from a peak height of 0–0.5 to be able to perform further image analysis. The colour maps and scale were converted to a grey scale for the measuring of the grey values (Fig. 2).
We also performed a calibration curve of peak height with respect to the grey value measure on the scale bar above by measuring the grey value with the ImageJ software at the specific peak height of that grey scale bar. This allowed us to transform the grey values measured during the image analysis to their corre-sponding peak heights. The fitting curve obtained (r2
¼ 0.99998) was the following:
(
)
= * − ( )Peakheight AU 0. 00258 Greyvalue 0. 1106 2
2.2.8. Filtration experiments
Dead-end filtration experiments with Amicons stirred cells
(Series 8050, Merck Millipore) were carried out at a stirring speed of 200 rpm, temperature of 20 °C and pressure of 2 bar to assess the efficiency of the coating for different coating times.
Coated membranes were left overnight with PBS solution and the initial PBS flux was recorded (JPBS,0). Then 1 g/L of BSA was
filtered until 20 mL of permeate were collected, and then the rinsing step was performed with 20 mL of PBS for 20 min. The final PBS flux (JPBS) was recorded. These steps correspond to the first fouling-rinsing cycle (Cycle 1 or C1); two more cycles like this were performed on the same manner, yielding BSA and PBS fil-tration parameters for the cycles 2 and 3 (C2 and C3 respectively, seeFig. 3).
The permeability was calculated from these fluxes and ex-pressed inkg m* −2*s−1*MPa−1.
2.2.8.1. Reversibility index. With the filtration fluxes calculated
from the experiments, the reversibility indexes (RI) were calcu-lated for each cycle.
= − − ( ) − RI J J J J 3 i PBS i PBS i PBS BSA i , 1 , ,0 , where: JPBS : PBS flux
(
)
* kg m2 s .JBSA : BSA flux
(
)
* kgm2 s , calculated from the final stable flux measured during BSA filtration step.
JPBS,0: PBS flux registered before the first fouling cycle was carried out.
i: Cycle i, where i¼[1–3].
A reversibility index of zero means that the fouling was 100% irreversible while a value of 1 indicates that the fouling was 100% reversible.
2.3. Image analysis of the FTIR results
Files obtained from the FTIR analysis were first processed with the OMNIC Software Suite (OMNIC Atlms v.9.2, Thermo Fisher Scientific) which allowed to open the scanned maps, select the peak of interest and create the corresponding map.
Maps created with the OMNIC software were exported as im-age files (.tiff extension) and further imim-age analysis was carried out with ImageJ software[26].
3. Results and discussion
In this section we will be showing the results we obtained when modifying our PVDF membranes with the two different copolymer types – random and diblock – first by varying the co-polymer concentration in the coating solution and using the same coating time, and then by varying the coating time and leaving the copolymer concentration constant. All of these experiments are also carried out by adding our foulant solution – 1 g/L of BSA, and the FTIR maps are acquired for the membrane-copolymer-foulant system.
3.1. Variation of copolymer concentration in coating solution
Classically, coated amounts as a function of the copolymer concentration of the coating solution have been determined by calculating coating densities from mass balances[2,22]. Authors have found that there is an increase in the adsorbed mass with
Fig. 6. Image of the membrane surface modified with the random copolymer and incubated with 1 g/L BSA solution. Virgin membrane (upper left) and modified with copolymer solution concentration of 1 mg/mL (upper right), 5 mg/mL (lower right), and 10 mg/mL (lower left). The mesh is a consequence of the images taken by the microscope to determine the subsequent surface to be analysed by the FTIR microspectrometer.
Fig. 7. Average peak height of the 1737 and 3300 cm" 1peaks as a function of
random (RND) and diblock (DB) copolymer concentration.
Fig. 8. Evolution of the foulant adsorbed as a function of the copolymer presence for the different coating concentrations.
increasing concentrations of copolymer in the solution until a plateau is found beyond a concentration of 3–5 mg of copolymer per mL of solution. FTIR analysis – taking the average value of spectra taken at 3–5 different membrane locations – confirmed this tendency. FTIR in these cases is used to identify the presence of the copolymer on the membrane surface and qualitatively as-sess the amounts by looking at the peak heights from the raw spectra.
When we performed similar experiments by coating our membranes with different concentrations of coating solutions and analysed the surface under FTIR mapping the results were the following (Figs. 4and5).
For the 2876 and 1737 cm" 1peaks, with increasing copolymer
concentration the peak intensities were higher which suggests that there is more copolymer adsorbed and the surface could be more hydrophilic. It is still possible to observe differences between the 5 mg/mL and 10 mg/mL concentration levels, showing that this technique could be a little more sensitive than the coating den-sities calculated as mentioned above. It is important to mention that the problem with the measurement of the coating density by mass balance is that the surface area is not properly assessed: the contribution of the pores to the surface is overlooked, and we have no idea how much polymer penetrates the pores during coating. So the trend (coating density vs. copolymer concentration in the coating bath) should be considered rather than the actual value.
It is also possible to observe that the copolymer distribution on
the surface is not homogeneous and it is noticeable at a millimetre level, which could affect the adherence of foulant on the surface.
If we take a look at the foulant contribution on the image (last row onFigs. 4and5), it is possible to appreciate that the foulant adsorption decreases with increasing coating concentration. This behaviour could also be seen on plain sight, since the BSA used was of an orange colour (Fig. 6).
As a first image analysis approach, we proceeded to calculate the average peak height of the whole 1 # 1 mm areas for the peaks corresponding to the C ¼O and the N–H functional groups (1737 cm" 1for PEGMA and 3300 cm" 1for BSA contributions,
re-spectively); those results are shown in Fig. 7. In this figure it is possible to appreciate the evolution of the peak heights for the different concentrations of copolymer in the coating solution.
For both copolymers, the CQO peak is higher with the in-crease of copolymer in the coating solution while the BSA ad-sorbed decreases with the increase of copolymer concentration. It is also possible to see the coating plateau mentioned before, especially for the diblock case and for the random case if we take into account the standard deviation.
OnFig. 8we represented the variation of the foulant signal in relation with the one of the copolymer. The diblock copolymer seemed to be a little more efficient than the random in its anti-adsorption properties, tendency that can be better appreciated in the following graph.
It is possible to see a trend in the previous graph despite the
Fig. 9. Coverage and adsorption levels for the membranes modified with different random copolymer concentrations and a coating time of 2 h.
high standard deviation of the 1737 cm" 1peak. The diblock
co-polymer reaches the same foulant average peak value at a lower average peak height than for the random copolymer. This could imply that the long PEGMA brushes present in the diblock chain are somewhat more efficient to prevent protein adsorption than the loops on random case, for these experimental conditions.
We could also see that beyond a copolymer concentration of 5 mg/mL, the adsorption detected did not significantly decrease.
It is important to mention that we are detecting coating and protein adsorption from the same sample at the same time on the
same area. With other methods one part of the samples will be prepared and analysed for the detection of the coating layer while another set of samples will be dedicated to analyse foulant adsorption.
3.1.1. Analysis of heterogeneity
In the previous section we rapidly commented on the hetero-geneous distribution seen on the FTIR maps of the copolymer and foulant, and proceeded to analyse the data by averaging all those values, therefore, losing the real potential of an heterogeneity analysis on a surface mapping technique such as FTIR microspectrometry.
One of the main problems we have to face is the definition of heterogeneity itself; whether it is possible to analyse it with standard deviations, or by defining different coating/fouling levels. Analysing standard deviations would just give another “aver-aged” type of information from our system, since values are always compared against the mean. What is more, we can see from pre-vious sections that it will not give us any further information.
Therefore, we proceeded to try to define different coating and adsorption levels to really see how they distribute on the mem-brane surface and their interrelationships.
The development of the methodology for the primary analysis of heterogeneity can be found in the first section of the com-plementary material.
The two figures below show the type of results that we got from this level-analysis (Fig. 9for the membranes modified with random copolymer and Fig. 10 for the ones modified with the diblock one).
As expected, the 1737 cm" 1peak intensity is nil or low for the
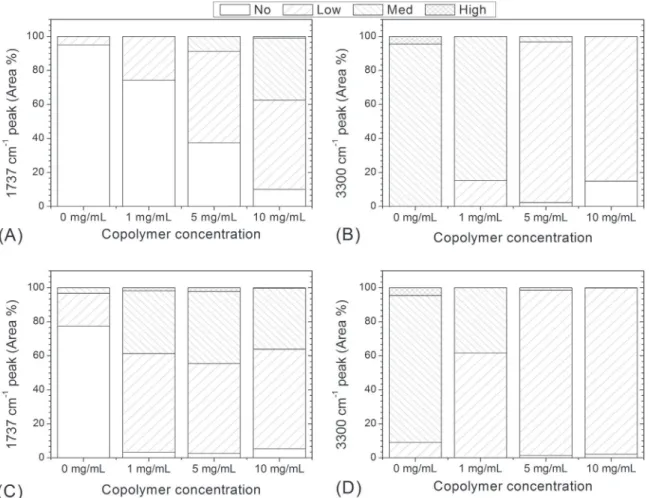
Fig. 11. Measured area percentages for the different coverage and adsorption levels as a function of copolymer concentration. (A) and (B): random copolymer; (C) and (D): diblock copolymer.
Fig. 12. Water contact angle and average coating densities as a function of coating time. Coating solution: 5 mg of random copolymer per mL of ethanol.
virgin membrane while there is a mainly medium level foulant adsorption. Coating levels migrate towards the low and medium values when membranes are modified with higher concentrations of copolymer, and adsorption levels decrease from medium to the low levels. The measured black area percentages are depicted in the following figure (Fig. 11).
At coating concentrations of 1 mg/mL and 5 mg/mL, the diblock copolymer shows a better coverage level than the random one. At 10 mg/mL the coating level percentages are similar. The adsorption levels are also affected by the different copolymer types. At a co-polymer solution concentration of 1 mg/mL there is lower ad-sorption percentages for the membranes modified with diblock copolymers than for the random. These values become similar for both copolymers at a concentration of 5 mg/mL and beyond.
The anti-adsorption properties of the modified membranes – either with diblock or random copolymers – seem to be effective once the surface reaches a “low” level of copolymer coverage of between 50% and 60%.
The slight advantage of the diblock copolymer versus the ran-dom in its anti-adsorption characteristics could be due to higher “medium” and “low” levels coverages at lower copolymer concentration.
Nevertheless, there is not a significant anti-adsorption differ-ence once a certain coating level is reached and neither brush nor loop configurations seem to matter for improving the properties of
the membranes.
3.2. Variation of coating time (constant copolymer solution concentration)
Most of the bibliography related to membrane coating just fo-cuses on the effect of copolymer concentration on the properties of modified membranes. Authors specify the coating time usually without further discussion on why that particular time was cho-sen. However, not so much attention has been drawn to the fact that the final coating layer is heavily dependent on the time that the copolymer solution is in contact with the membrane, i.e. coating time. Therefore, we are going to evaluate the effect of different coating times when 5 mg/mL copolymer solutions are left in contact with the membranes from 2 to 8 h at 25 °C, and its subsequent fouling behaviour, with some traditional techniques and with FTIR mapping.
First, we determined the water contact angles and coating densities for a 5 mg/mL random copolymer solution with respect of coating time (Fig. 12).
For these experimental conditions, we can see that the coating density increases with the coating time, while the contact angle does not have a considerable change for any of the tested mem-branes. Water contact angle was not a very sensitive method to assess membrane hydrophilicity change, even though it is the
Fig. 13. Example of FTIR maps obtained for membranes modified with the random copolymer at different coating times while keeping the copolymer concentration at 5 mg/mL. Each map has an area of 1 mm2. (For interpretation of the references to colour in this figure legend, the reader is referred to the web version of this article).
most direct method to do it.
As seen on the previous section, we also registered the FTIR maps for the random and diblock copolymers at different coating times (Fig. 13– colour map shown for the random copolymer).
When coating time increases copolymer presence increases as well. Heterogeneous distribution of the coating layer is again evident. It is also possible to appreciate an increase of the copo-lymer between the coating times of 2 and 8 h.
Since a coating time of 2 h was taken as our reference coating time, it is important to know whether this difference is influencing
the foulant adsorption levels or whether we should proceed for a longer coating time standard.
The measurement and analysis of the average peaks heights performed for this image confirm the trends seen inFig. 13(see
Section 2of theSupplementary material). It also shows that after a coating time of 2 h there is no improvement in the anti-adsorption properties of the modified surface, even when a higher coating signal is detected.
We proceeded to apply a similar heterogeneity analysis as the one previously shown for the membranes coated with a copoly-mer concentration of 5 mg/mL at different coating times (Fig. 14). As expected, the 1737 cm" 1peak intensity is nil or low for the
virgin membrane while having the highest BSA adsorption levels. When the coating time is increased, coating levels increase as well. The BSA adsorption levels drastically decrease from the virgin membrane to the modified ones.
Once the membranes have been coated for two hours and more, there is not much difference in the BSA adsorption levels for the different coating times, even though coating levels keep in-creasing. InFigs. 11and14, one can see that a low level of BSA adsorption is achieved all over the membrane sample only when the level of coating has reached at least a medium level over most part of the sample surface. Since we already started from “good” coating conditions (5 mg/mL and 2 h), a longer coating time did not have a measurable effect on BSA adsorption.
The results shown before involve the static adsorption of the foulant onto the surface, which give a first overview of the system, however it is important to perform filtration experiments to have a better understanding of the influence of coating time with the anti-fouling properties of the membranes. As explained in the Materials and Methods section, three fouling-rinsing cycles were
Fig. 14. Measured area percentages for the different coverage and adsorption levels as a function of coating time, for a 5 mg/mL copolymer solution. (A) and (B): Random copolymer; (C) and (D): diblock copolymer.
Fig. 15. Permeability as a function of coating time for the membranes modified with 5 mg/mL of copolymer solution.
performed to membranes modified with a 5 mg/mL random co-polymer solution at coating times ranging from 2 to 8 h. The virgin membranes were treated with pure ethanol. The PBS and BSA fluxes are shown inFig. 15and the calculated reversibility indexes inFig. 17. The initial PBS flux refers to the first flux recorded, be-fore the fouling experiments began. The BSA flux values corre-spond to the final value registered while filtering the BSA solution through the membrane.
For the virgin membrane, the final PBS permeabilities are lower than the initial one, showing that it is clearly affected by fouling. For the membrane modified with the standard coating time of two hours, the PBS permeability measured after the first fouling cycle is practically the same as the initial one while the other two de-crease after each cycle is performed, gradually reaching similar values as the ones of the virgin membrane. The PBS permeabilities
at the coating time of 4 h can be considered unchanged after each filtration – taking into account an experimental error between 12% and 18%. It is certain that after a coating time of 4 h there is a protective anti-fouling effect for at least three fouling cycles.
The initial PBS permeability decreases with coating time. The increase of copolymer amounts with coating time, showed in the data from the coating density determination and the FTIR tech-nique, is probably causing a mild decrease in the effective pore size, hence, lowering the initial PBS permeabilities. Pore size re-duction as a result of the modification of the membrane has been seen before[27]. Additionally, SEM images of the unmodified and modified membranes are shown below (Fig. 16). There it is pos-sible to see the coverage of the pores by the copolymer with the increase of coating time, which adds a small resistance to flow passage through the pores.
We have determined the retention of BSA at the end of the BSA filtration step for each cycle for the virgin membrane and the membranes coated for 2, 4, and 6 h. At the end of the first cycle the calculated retention percentages were of 5%, 14%, 8% and 8%, re-spectively, which lie very close to the estimated retention of BSA by the Ferry law – for a diameter of BSA of 7.9 nm and using 43 nm as a mean pore size. The results for the subsequent cycles show some tendencies in retention percentages of BSA, for the virgin membrane the retention of BSA slightly increased to 11%, while for the membrane modified for 6 h the final retention value reached 14%. For the other two coating conditions the retention of BSA varied between each cycle and reached 30%. Taking into account the expected variabilities of the process – laboratory-made membranes and the coating itself –, the modification did not sig-nificantly change the retention of BSA.
The reversibility index of the process was calculated and the results are shown inFig. 17. Here it is possible to appreciate how reversible fouling is for the different experimental conditions. As discussed before, the virgin membrane has lower performance
Fig. 16. SEM images of the virgin, and modified membranes: for 4 and 6 h, with a 5 mg/mL PS-r-PEGMA copolymer. The scale bars correspond to 1 mm and 100 nm for the # 20k and the # 50k magnifications, respectively. The images were taken with a Schottky Field Emission Scanning Electron Microscope (JEOL SEM-FEG JSM7800F); samples were metallised with gold.
than the modified ones. The surfaces coated for 2 h can be con-sidered more protected against fouling for a first fouling cycle, afterwards the protective effect of the copolymer is not efficient. After a coating time of 4 h, membranes show great anti-fouling properties, at least for the 3 fouling cycles studied on this work. It is important to mention that even if these membranes are show-ing good reversibility indexes after a coatshow-ing time of 4 h, this index does not show that fluxes are greatly decreased due to the higher copolymer content. Thus conclusions based solely on indexes should always be backed by raw filtration data.
It is interesting to note that by performing filtrations we can see an improvement on the reversibility of the fouling between 2 and 4 h of coating time, while in the static adsorption experi-ments this difference was not noticeable.
Coating time is clearly a factor that affects the anti-fouling properties of the membranes and discussions on whether the modification of membranes with coating techniques and its sub-sequent comparison should be more efficient or not have to take this factor into consideration.
Coating density determination and FTIR mapping assessment techniques reached similar conclusions on the matter of presence of the copolymer on the membrane surface, while water contact angle determination did not prove to be sensitive enough. With the filtration experiments it was possible to indirectly confirm the increase of adsorbed copolymer with coating time while also getting the always necessary flux performance in relation to the pure fluxes – PBS in this case – and fouling. Filtration experiments also showed that a coating time of 4 h could be more suitable for our system.
Static fouling tests that test the anti-adsorption properties of the modified membranes should always be complemented by fil-tration experiments.
4. Conclusions
FTIR mapping is an important tool that can help us to com-plement our study of fouling phenomena by assessing chemical distribution of the different components of the system on the membrane surface at a millimetre scale.
We have shown that it is possible to apply this technique to assess coating and fouling of the membrane – at the same time – for the surface of the sample, and the data obtained can be ana-lysed by image analysis software, either by calculating the average signal or by defining coating/fouling levels. This last image analysis technique needs to be further developed to have a better under-standing and analysis of the obtained data, hence improving our understanding on the importance of the heterogeneous distribu-tion of the coating and fouling layers and their interreladistribu-tions. We have also shown that while “static” adsorption experiments can be a good initial indicator of the behaviour of the system, it is always necessary to perform filtration tests to get a better evaluation of the experimental conditions. We also recommend that it is im-portant to carefully select the coating conditions – such as coating time and coating bath concentration – for better results and analysis.
We confirmed that when there is more presence of the copo-lymer on the surface of the membrane the fouling is decreased, until a certain concentration or coating density of the copolymer is reached. Beyond this point, there is not an appreciable improve-ment of the anti-fouling properties of the membrane. From the results obtained it is also evident that the measurement of water contact angle has not proved to be very sensitive to assess the change in hydrophilicity of the modified membranes and its pos-sible impact on their anti-fouling properties.
Hence, we recommend using FTIR mapping as a
complementary technique for the study of the modification of membranes and assessment of their anti-fouling properties.
Acknowledgements
The authors would like to thank the Agence Nationale de la Recherche (ANR, France) (ANR-12-IS08-0002) and the Ministry of Science and Technology (Taiwan) (MOST 102-2923-E-033 -001 -MY3) for the funding of the project. We also like to acknowledge Corinne Routaboul (Service commun de spectroscopie infrarouge et Raman, Université Paul Sabatier, France) for the scanning of the samples on the FTIR microspectrometer and her guidance into the understanding of the technique. Last but not least, special regards for Yuki and Sherry for carrying out the contact angle and coating density experiments, and for casting the membranes; and to Maithili in helping us with the filtrations.
Appendix A. Supplementary material
Supplementary data associated with this article can be found in the online version athttp://dx.doi.org/10.1016/j.memsci.2016.07.061.
References
[1] A. Bhattacharya, B.N. Misra, Grafting: A versatile means to modify polymers: Techniques, factors and applications, Prog. Polym. Sci. 29 (2004) 767–814,
http://dx.doi.org/10.1016/j.progpolymsci.2004.05.002.
[2] N.J. Lin, H.S. Yang, Y. Chang, K.L. Tung, W.H. Chen, H.W. Cheng, et al., Surface self-assembled PEGylation of fluoro-based pvdf membranes via hydrophobic-driven copolymer anchoring for ultra-stable biofouling resistance, Langmuir 29 (2013) 10183–10193,http://dx.doi.org/10.1021/la401336y.
[3]A. Akthakul, R.F. Salinaro, A.M. Mayes, Antifouling polymer membranes with subnanometer size selectivity, Macromolecules 37 (2004) 7663–7668. [4] A. Asatekin, A. Menniti, S. Kang, Antifouling nanofiltration membranes for
membrane bioreactors from self-assembling graft copolymers, J. Membr. Sci. 285 (2006) 81–89,http://dx.doi.org/10.1016/j.memsci.2006.07.042. [5]S. Boributh, A. Chanachai, R. Jiraratananon, Modification of PVDF membrane
by chitosan solution for reducing protein fouling, J. Membr. Sci. 342 (2009) 97–104.
[6] L. Zhang, G. Chowdhury, C. Feng, T. Matsuura, R. Narbaitz, Effect of surface-modifying macromolecules and membrane morphology on fouling of poly-ethersulfone ultrafiltration membranes, J. Appl. Polym. Sci. 88 (2003) 3132–3138,http://dx.doi.org/10.1002/app.12000.
[7] Y. Zhao, K. Wee, R. Bai, Highly hydrophilic and low-protein-fouling poly-propylene membrane prepared by surface modification with sulfobetaine-based zwitterionic polymer through a combined surface polymerization method, J. Membr. Sci. 362 (2010) 326–333,http://dx.doi.org/10.1016/j. memsci.2010.06.037.
[8] M. Zhou, H. Liu, J. Kilduff, High-throughput membrane surface modification to control NOM fouling, Environ. Sci. Technol. 43 (2009) 3865–3871,http://dx. doi.org/10.1021/es9003697.
[9] S. Kang, A. Asatekin, A.M. Mayes, M. Elimelech, Protein antifouling mechan-isms of PAN UF membranes incorporating PAN-g-PEO additive, J. Membr. Sci. 296 (2007) 42–50,http://dx.doi.org/10.1016/j.memsci.2007.03.012.
[10] S. Xue, Q.-L. Zhao, L.-L. Wei, N.-Q. Ren, Behavior and characteristics of dis-solved organic matter during column studies of soil aquifer treatment, Water Res. 43 (2009) 499–507,http://dx.doi.org/10.1016/j.watres.2008.10.026. [11] S. Belfer, R. Fainchtain, Y. Purinson, O. Kedem, Surface characterization by
FTIR-ATR spectroscopy of polyethersulfone membranes-unmodified, modified and protein fouled, J. Membr. Sci. 172 (2000) 113–124,http://dx.doi.org/ 10.1016/S0376-7388(00)00316-1.
[12] P. Kingshott, H. Thissen, H.J. Griesser, Effects of cloud-point grafting, chain length, and density of PEG layers on competitive adsorption of ocular proteins, Biomaterials 23 (2002) 2043–2056,http://dx.doi.org/10.1016/S0142-9612(01) 00334-9.
[13] J. Jin, W. Jiang, Q. shi, J. Zhao, J. Yin, P. Stagnaro, Fabrication of PP-g-PEGMA-g-heparin and its hemocompatibility: From protein adsorption to anticoagulant tendency, Appl. Surf. Sci. 258 (2012) 5841–5849,http://dx.doi.org/10.1016/j. apsusc.2012.02.113.
[14] R. Bhargava, S.-Q. Wang, J.L. Koenig, FTIR Microspectroscopy of Polymeric Systems, in: Liquid Chromatography FTIR Microspectroscopy Microwave As-sisted Synthesis, Springer Berlin Heidelberg, Berlin, Heidelberg, 2003, pp. 137– 191. doi:http://dx.doi.org/10.1007/b10932.
E. Hennink, et al., Lysozyme distribution and conformation in a biodegradable polymer matrix as determined by FTIR techniques, J. Control. Release 68 (2000) 31–40,http://dx.doi.org/10.1016/S0168-3659(00)00227-3.
[16] M.J. Baker, J. Trevisan, P. Bassan, R. Bhargava, H.J. Butler, K.M. Dorling, et al., Using Fourier transform IR spectroscopy to analyze biological materials, Nat. Protoc. 9 (2014) 1771–1791,http://dx.doi.org/10.1038/nprot.2014.110. [17]S.G. Kazarian, K.L.A. Chan, Micro- and macro-attenuated total reflection fourier
transform infrared spectroscopic imaging, Appl. Spectrosc. 64 (2010) 135A–152A.
[18] E. Ferrero, S. Navea, C. Repolles, J. Bacardit, J.J. Malfeito, Analytical Methods for the characterizaction of reverse osmosis membranes fouling, in: IDA World Congress Proceedings Paper IDAWC/PER11-240, 2011: pp. 4–9.
[19] T.K. Gelaw, C. Güell, M. Ferrando, S. De Lamo-Castellví, Use of attenuated total reflectance infrared microspectroscopy combined with multivariate analysis to study membrane fouling, J. Food Eng. 143 (2014) 69–73,http://dx.doi.org/ 10.1016/j.jfoodeng.2014.06.032.
[20] M. Rabiller-Baudry, M. Le Maux, B. Chaufer, L. Begoin, Characterisation of cleaned and fouled membrane by ATR—FTIR and EDX analysis coupled with SEM: application to UF of skimmed milk with a PES membrane, Desalination 146 (2002) 123–128,http://dx.doi.org/10.1016/S0011-9164(02)00503-9. [21] O. Thygesen, M.A.B. Hedegaard, A. Zarebska, C. Beleites, C. Krafft, Membrane
fouling from ammonia recovery analyzed by ATR-FTIR imaging, Vib. Spectrosc.
72 (2014) 119–123,http://dx.doi.org/10.1016/j.vibspec.2014.03.004. [22] Y. Chiag, Y. Chang, W. Chen, R. Ruaan, Biofouling resistance of ultrafiltration
membranes controlled by surface self-assembled coating with PEGylated co-polymers, Langmuir 28 (2011) 1399–1407,http://dx.doi.org/10.1021/ la204012n.
[23] A. Venault, Y.-H. Liu, J.-R. Wu, H.-S. Yang, Y. Chang, J.-Y. Lai, et al., Low-bio-fouling membranes prepared by liquid-induced phase separation of the PVDF/ polystyrene-b-poly (ethylene glycol) methacrylate blend, J. Membr. Sci. 450 (2014) 340–350,http://dx.doi.org/10.1016/j.memsci.2013.09.004.
[24] A. Venault, M.R.B. Ballad, Y.-H. Liu, P. Aimar, Y. Chang, Hemocompatibility of PVDF/PS-b-PEGMA membranes prepared by LIPS process, J. Membr. Sci. 477 (2015) 101–114,http://dx.doi.org/10.1016/j.memsci.2014.12.024.
[25] S. Xue, Q.-L. Zhao, L.-L. Wei, N.-Q. Ren, Behavior and characteristics of dis-solved organic matter during column studies of soil aquifer treatment, Water Res. 43 (2009) 499–507,http://dx.doi.org/10.1016/j.watres.2008.10.026. [26] C.A. Schneider, W.S. Rasband, K.W. Eliceiri, NIH Image to ImageJ: 25 years of
image analysis, Nat. Methods 9 (2012) 671–675,http://dx.doi.org/10.1038/ nmeth.2089.
[27] S. Singh, K. Khulbe, T. Matsuura, P. Ramamurthy, Membrane characterization by solute transport and atomic force microscopy, J. Membr. Sci. 142 (1998) 111–127,http://dx.doi.org/10.1016/S0376-7388(97)00329-3.