OATAO is an open access repository that collects the work of Toulouse
researchers and makes it freely available over the web where possible
Any correspondence concerning this service should be sent
to the repository administrator:
[email protected]
This is an author’s version published in:
http://oatao.univ-toulouse.fr/23274
To cite this version:
Wassner, Diego and Borrás, Mariano and Vaca-Garcia, Carlos
and Ploschuk,
Edmundo Harvest date modifies seed quality and oil composition of Jatropha
curcas growth under subtropical conditions in Argentina. (2016) Industrial
Crops and Products, 94. 318-326. ISSN 0926-6690
Harvest date modifies seed quality and oil composition of]atropha
curcas growth under subtropical conditions in Argentina
D. Wassnera,*,
M.
Borras b, C. Vaca-Garcia c,E.
Ploschukaa Universidad de Buenos Aires, Facultad de Agronomfa, Departamento de Producdôn Vegetal, Ciitedra de Cultivos Industriales, Av. San Martin 4453 (C1417DSE) BsAs., Argentina
b Patagonia Bioenergfa SA. Juramento 2059 of 804, CABA, Argentina
'Laboratoire de Chimie Agro-industrielle (LCA), Université de Toulouse, INRA, INPT, Toulouse, France
ARTICLE INFO Keywords: New crops Biodiesel Seed weight Seed filling Increasing temperature 1. Introduction ABSTRACT
One of the most currently promoted new crops for biodiesel productions the perennial species Jatropha curcas L. (Euphorbiaceae) due to its promising high seed yields with high oil concentrations (33-39%) and oil quality that reaching the international biodiesel standards. Although there have been different
evaluations of genotypes growing under the same environmental conditions, revealing great variability
for seed and oil quality, no reports are available about the effect environmental conditions during grain
filling over such traits.
The objectives of this work were to determine (i) the effect of harvest dates on seed quality and oil
concentration, (ii) if such changes can be explained by the average temperature during grain filling and
(iii) how harvest dates could affect biodiesel quality. An experiment was carried out during 29 months
in experimental plots located in Formosa, Argentina. A systematic fruit harvest was conducted during 15
different dates on 10 plants with similar height (""1.80 m). Environmental conditions during the exper
iment were appropriate to create a broad individual seed weight range (326-752 mg) and significant
differences were found among harvest dates. Seed oil concentrations were significantly different among
harvest dates with a maximum value of 38. 7 ± 0.6% on 08 August 2011 and a minimum of 19.6 ± 1.8% on
17 March 201 O. Oil concentration increased linearly as seed weight increased up to a value of 605 mg,
after which higher seed weight was not associated with greater seed oil concentration. Oil concentration
was largely (r2 = 0.85) explained by the kernel percentage through a linear regression (y= -25.9 + 0.967x).
Variations in seed weight and oil concentration were not associated with changes in average temper ature during grain filling, suggesting that fluctuations in the source-sink relation through the growing
season could explain the variations found among harvest dates. Temperature during seed filling period
strongly affected oil composition and higher temperatures were associated with higher oleic acid and
lower linoleic acid concentrations, although this effect generated only small effects on the biodiesel qual
ity. Environmental conditions during grain filling modified seed quality and oil composition, while its
concentration was not affected. This work reveals the existence of harvest dates effects on seed qual
ity and oil concentration, although unrelated with the environmental conditions explored during grain
filling period.
dence on fossil fuels. In this context, the interest for new oil crops in areas not used for agriculture has remarkably increased. Worldwide demand for vegetable oils used in biodiesel elabora
tion has markedly grown during the last years due to governmental decisions aiming to reduce greenhouse gas emissions and
depen-One of the most currently promoted new crops is the perennial species ]atropha curcas L. (Euphorbiaceae ), due to promising high
seed yields with high oil concentrations (33-39%; Ginwal et al., 2004) and oil quality reaching international biodiesel standards (Achten et al., 2008).
* Corresponding author.
E-mail address: [email protected] (D. Wassner). https://doi.org/10.1016/j.indcrop.2016.09.001
The real productive potential of]. curcas is controversial because
the first plantations were performed assuming seed yield estima tions which proved excessively optimistic ( 4-5 t ha-1; Francis et al.,
2005; Adil Edrisi et al., 2015), but experimental results showed great variability and lower yields than expected (0.4-2.0t ha-1;
Senger et al., 2016; Wani et al., 2016; Van Eijck et al., 2014; Laviola et al., 2014). These results are largely the consequence of low genetic improvement combined with poor development of crop management technology.
Another component that explains oil yield is seed weight and oil seed concentration, which for]. curcas is broadly assumed to range
between 35 and 40% (Carets, 2009). However, different genotypes evaluations performed under the same environmental conditions revealed a great variability for oil seed concentration ranging between 29.8-37.1% (Rao et al., 2008); 17.1-38.8% (Subramanyam et al., 2010); and 28.0-38.8% (Kaushik et al., 2007).
Oil seed concentration does not only depend on the genotype, but it is also affected by the environmental conditions during grain filling, mainly by temperature that modifies seed oil concentra tion and the fatty acid composition through changes in grain filling dynamics and biosynthetic activity. In general, the higher the tem peratures, the shorter the seed filling duration and the higher the seed filling rate, which determines lower seed weights than those obtained with lower temperatures (Singh et al., 2013; Singer et al., 2016).
In]. curcas, oil is accumulated during the Iast third of the seed fill
ing period (Annarao et al., 2008; Sinha et al., 2015 ), so a shortening of grain filling duration should determine Iower oil concentration. Furthermore, changes in seed weight generated by different tem peratures can affect seed oil concentration through changes in the seed coat - kernel relationships in a similar way to that found by Rondanini et al. (2003) for the pericarp-seed relationship in sunflower (Helianthus annuus L.). Surprisingly, the effect of envi
ronmental conditions during grain filling in]. curcas has not been
studied yet.
Regarding the composition of]. curcas oil, there is consensus
that its quality is suitable for producing biodiesel that meets the international quality standards due to an adequate proportion of its two main fatty acids, oleic and linoleic, which represent 67-81% of total fatty acids (Rathbauer et al., 2012).
However, similarly to what happens to seed weight and oil con centration, there is abundant information indicating the existence of genotypic variability for oil composition, with extreme values that range from 21.8 to 49.0% for oleic acid and 47.4-29.7% for linoleic acid (Oliveira et al., 2009), but there is no information on the effect of environmental conditions on oil composition during grain filling.
lt is generally demonstrated that low temperatures increase the accumulation of polyunsaturated fatty acids and decrease the monounsaturated oleic acid, which is explained by the optimal temperatures ranges for the activity of different enzymes involved in the biosynthesis of bath types of fatty acids (Trémoliéres et al., 1982).
However, not ail crops exhibit the same response ( Canvin, 1965; Rondanini et al., 2014 ), which makes it necessary to determine how temperature during seed filling affects the composition of]. curcas
oil in order to determine how biodiesel quality parameters could be affected.
Under our experimental conditions, seeds of]. curcas were pro
duced in several cohorts throughout the growing season (usually three or four), extending from early summer to early winter, lead ing to uncertainty about how seed quality and oil composition could be affected by the environmental conditions explored during each seed cohort. Knowing how environmental conditions affect oil concentration and composition is important to develop agro nomie practices aiming to concentrate seed production under the most favourable conditions. Thus, the objectives of this work were to determine (i) the effect of environmental conditions during grain filling on seed quality (seed weight, seed coat and kernel
propor-tian and seed oil concentration), (ii) if changes in seed quality and oil composition can be explained by the average temperature dur ing grain filling and (iii) how harvest dates could affect biodiesel quality.
2. Material and methods
2.1. Experimental conditions
The experiment was carried out during 29 months, from March 2010 to August 2012, in experimental plots of ]. curcas located
in Siete Palmas, Formosa, Argentina (58c 17' 59.67"W-25° 13'
21.04"5), Iocated in the Chaco region, sub-region of Humid Chaco. The climate is warm humid subtropical, with a rainy season that extends from late spring until early autumn, white during the win ter rainfall is lower.
The plantation was established in 2008, with a 4 m inter-row distance and 2 m between plants (1.250pl ha-1), with East-West row orientation. Plants were not pruned during the experiment. Weeds were mechanically eliminated and plants were fertilized every year ( during October) with 100 kg ha-1 of urea, under rainfed
conditions. Insects were controlled using Dimethoate and preven tive applications of systemic fungicide Amistar™ (Syngenta, active
principle: Azoxystrobin) were performed twice a year. The applied doses were carefully chosen in order to avoid taxie effects.
Previous to starting the experiment, soit analysis was performed and results obtained were: pH in water (1 :2.5) 6.8; electrical con ductivity (µScm-1) 5.9, organic matter by Walkey-Black method (%) 3.8; extractable phosphorus by Bray-Kurtz I (mg kg-1 as P205)
25; total nitrogen by Kjetdahl method (%) O. 7; Exchangeable cations by Ammonium acetate method (meq 100g-1 ), Na: 122; K: 0.25; Ca: 20.93 and Mg: 15.43.
A systematic fruit harvest was conducted on 15 different dates (between 4-6 harvests per year) on 10 plants with similar height ( c,,1.80 m), using as criterion to harvest when more than 80% of each fruit cohort had the yellowish-brown colour characteristic of ripe fruit (Silva et al., 2012). On each harvest date, ail ripe fruit was collected and separated into their components ( the shell conformed by the exocarp and endocarp and the seeds), aven dried at 70°C
until constant weight, and weighted.
2.2. Chemical analysis 2.2.1. Seed oil concentration
Seeds sampi es ( 10-15 g) were aven dried at 65 °c until constant
weight and milled. Oil was extracted using a Soxhlet apparatus with hexane for 12 h. The extracts were evaporated under vacuum with a rotary evaporator until dry and weighted.
2.2.2. Oil composition
Fatty acid composition was determined by gas-liquid chro matography of methylated fatty acids. Oil was dissolved in 1 ml of TBME (tert butyl methyl ether, approximately 20mg m1-1) and methylated using TMSH (trimethyl sulphonium hydroxide 0.5 M in methanol) at 103 °C for 3 min. Fatty acids components were
identified with Varian 3900 gas chromatographer equipped with FID detector. The analytical conditions used were the follow ing; capillary column Agilent CP-select CB for FAME fused silica WCOT (50m x 0.25 i.d. x 0.25 µm film thickness; Agilent, USA); carrier gas: Helium; injector temperature: 250 °C; detector temper ature: 250 °C, initial aven temperature: 185 cc ( 40 min); gradient:
15 °C min-1 up to 250° (10.68 min).
The fatty acids myristic (14:0), palmitic (16:0), palmitoleic (16:1 ), heptadecanoic (17:0), heptadecenoic (17:1 ), stearic (18:0), oleic (18:1), linoleic (18:2), linolenic (18:3), arachidic (20:0),
arachidonic (20: 1 ), behenic (22:0) and lignoceric (24:0) were iden tified in comparison with retention times of a known standard mixture (AOCS-1, Sigma-Aldrich, St. Louise, MO).
Glycerides composition was determined by gas-liquid chro matography of sylated fatty acids. Oil was dissolved in 1 ml of cyclohexane (approximately 1.5 mg mJ-1) and silylated using Methyl-imidazole with MSHFBA (N-methyl-N-trimethylsilyl heptafluorobutyramide) at 103 °c for 3 min. Fatty acids
components were identified with Perkin Elmer Autosystem XL gas chromatographer equipped with FID detector. The analyti cal conditions used were the following; capillary column CP Sil 8 CB low bleed MS ( 15m x 0.32 i.d. x 0.25 µm film thickness; Varian, California, USA); carrier gas: Helium; injector temperature: 55 °C;
detector temperature: 365 °C, initial oven temperature: 55 °C
(0.5 min); gradient: 200 °c min-1 up to 340° ( 40 min).
The glycerides were identified in comparison with retention times of a known standard mixture (AOCS-1, Sigma-Aldrich, St. Louise, MO) composed by the fatty acids palmitic (16:0) and stearic (18:0), monoglycerides and diglycerides of palmitic and stearic acids, and triacilglycerides conformed by 3 molecules of stearic acid, 2 molecules of stearic and 1 of palmitic, 1 molecule of stearic and 2 ofpalmitic acids and 3 molecules ofpalmitic acids.
2.2.3. Biodiesel quality parameters
Two oil parameters relevant for biodiesel quality (iodine value and cetane number) were estimated from the fatty acid profiles. Saponification number (SN) indicates the quantity of long-chain fatty acid whereas iodine value (IV) indicates the level of oil unsat uration, and both were estimated using Eqs. ( 1) and (2 ), respectively (Kalayasiri et al., 1996). Cetane number (CN) indicates the ignition speed of biodiesel after injection and was calculated using Eq. (3)
(Krisnangkura, 1986). SN = I:(560 x Ai)/MWi 1v = I:c254 x D x AiJ/Mwi CN = 46.3 + 5458/SN - 0.225 x IV (1) (2) (3)
where Ai is the percentage of each fatty acid, D is the number of double bonds of each fatty acid, and MWi is the molecular mass of each fatty acid present in the oil.
Changes in IV significantly affects many biodiesel quality param eters as viscosity, density, cold behaviour, oxidative stability, CN and heat value, while the SN, affects cold behaviour, CN and heat value (Hoekman et al., 2012). There are six grades of biodiesel according to their cold behaviour (Grades A to F) that determinate different prices in the European market (Garofalo, 2007)
2.3. Statistical analysis
Treatments were arranged in a completely randomized design and data were analysed by one-way ANOVA and LSD was consid ered at 5% significance level.
The percentages of fatty acids were transformed using arcsine transformation to correct for the non-normality in proportions. Means were separated with the Student-Newman-Keuls test (Keuls, 1952) at 5% significance level.
Seven plants were used for kernel and seed coat proportion in seeds and 10 plants for the other determinations. For each harvest date, ail mature fruit was harvested, and random subsample con sisted of 40 seeds of each plant taken to determine the seed and oil quality.
The nonlinear statistical routine of Prism (GraphPad, 2007) was used to fit bi-Iinear regression models with unknown eut-off to the relations of oil concentration and kernel proportion as a fonction of
seed dry weight. The mode! adjusted was: y=a + bx (for x:::: c) and y=a+bc (for x:::c) where y is the oil concentration (%) or kernel proportion(%), a and b are the intercept and the slope, respectively, xis the seed dry weight (mg) and c is the unknown break point of the fonction indicating the end of the Iineal association.
Multiple regression was used to predict seed weight and oil concentration through mean temperature 25 days before harvest (DBH), total radiation accumulated 25 DBH, accumulated rainfall 40, 50 and 60 DBH and the total number of hours during the 25 DBH with temperatures above 30 and 35 °c.
2.4. Meteorological information
Meteorological data, except precipitation measured in the experimental plots, were obtained from automatic meteorological station (Davis Vantage Pro 2 Plus, Davis Instruments, Califomia, USA) located at the Universidad Cat6Iica "Nuestra Sefiora de la Asunci6n" (Asuncion, Paraguay) located 50 km from the exper imental plot. This meteorological station was used because the original station installed in the experimental plot did not work properly and data was lost. So, there is no nearer station with data recording with an hourly frequency. Fortunately, temperature regimes in both sites are very similar because this area corresponds to a plain with the same isotherms throughout the year (Murphy et al., 2008 ).
3. Results
3.1. Meteorological conditions
The driest year was 2010, with an annual precipitation of 1043 mm, distributed 56% during summer, 17% in spring and 18% during fall, while 2012 was the most humid year with 1491 mm, distributed mainly during autumn (46%) and spring (42%). During 2011, a more concentrated distribution pattern was recorded, with 48% of the annual rainfall (1276 mm) during spring and 41% during early summer, and a long dry period of 5 months (March to August), in which precipitation was only 8 mm (Fig. 1 ). Winter rains were low, accounting for 9, 11 and 4% of the annual rainfall, occurring during 2010, 2011 and 2012, respectively.
For the 3 years analysed, the mean monthly maximum temper ature increased from 22 to 23 °C in July up to 35-36 °C in January, while the mean monthly minimum temperature increased from 8 to 10°C in July up to 21-23°C in January. Light frosts were
recorded every year, on 08 May, 2010 (3 h duration), 14July, 2010 (1 h), 27 June, 2011 (6 h), 28 June, 2011 (3 h), 06 July, 2012 (1 h) and 06 August, 2012 (5 h) with temperatures that ranged between -0.1 and -1.9 cc. This caused the Joss of ail immature leaves and fruit, Iight damage to the branches, which involved the necrosis of between 10 and 20% at the top of the branches. During the next spring, no plant mortality was observed.
3.2. Seed quality
3.2.1. Individual seed dry weight
Environmental conditions during the experiment were appro priate to create a broad individual seed weight range (326-752 mg) and significant differences were found (p < 0.05) among harvest dates. The seeds harvested during late fall and early winter (April to July) were significantly (p < 0.05) heavier than those harvested during summer and late winter, except for the seeds harvested on 09 August 2011 (Fig. 2).
Great variability for seed weight was found according to the harvest date, with seeds harvested on 05/20/2011 presenting the highest mean weight (695 ± 11 mg, mean ± standard error,
respec-40 35 Û 30 � I!! 25 c. 20 E .si 15 10 5 -Precipitation
____._ Minimun monthly temperature
---*·--
Mean monthly temperatura700
----t:r- Maximun monthly temperature
600 500 C 400 300 ë:iI!! 200 100 0
Fig. 1. Meteorological conditions during the experiment from 2010 to 2012.
,,__ 800 d a ab b c
-:E 6000)-�
� 400 Q) en-5
200 ·:s: 0--
... ...
-2010
b a a a C C b a ab C-2011
2012
Fig. 2. Mean individual seed weight of]atropha curcas plants harvested on different dates during 3 years. Different letters indicate significant differences between means at p < 0.05, vertical lines represent standard errors, n = 10.
tively) and the seeds harvested on 17 March, 2010 the lowest (395 ± 16 mg).
3.2.2. Relationship seed coat -kemel
The seed mass partition between seed coat and kernel was sig nificantly different (p < 0.05) among harvest dates ( data not shown) and were significantly related to seed weight. Thus, the slope of seed coat weight as a function of individual seed weight was sig nificantly (p < 0.001) lower ( 0.17) than the slope of kernel weight (0.83, Fig. 3).
3.2.3. Seed oil concentration
Seed oil concentration was significantly (p < 0.01) different among harvest dates. Seeds harvested on 17 March 2012 had the lowest oil concentration white the seeds harvested on 22 June, 2010, 26 January, 2011, 20 May, 2011, 09 August, 2011, 30 April, 2012, 03 July, 2012 and 17 July, 2012 had the highest values (Fig. 4). The mean maximum value was 38.7 ± 0.6% on 09 August,
..
-CIi Cl ..io:: E "C - c-1'11 .c - .21:g ;
u >, "C ... Cil "C Cil 600 500 400 300 200 100 kernel = -124 + 0.83x r2 = 0.97 seed coat = 124 + 0.17x r2 = 0.60 • kernel o seed coat 0+---.---"T----.----.---,---, 300 400 500 600 700 800 900lndividual seed weight {mg)
Fig. 3. Linear regression between hull and kernel dry weight with seed weight. The slopes are significantly different from zero atp <0.001, n= 84. Data were taken from
ail harvest dates evaluated. 40-
e b ab bd
-� 0-
C 0 30-C Q) C 0 20-(.) ·5 Q) Q) 10-,c>,Q) >,ûî u ro c :5 ::, ro��•Cl � ..-N N � r,.. ONN C') N2010
ab baba
è:' 'E >, ûî roc. Cil :, ::J<(�Cl C LO O ::J Cil N N <( -, 0) � 02011
b c ab ab ab cd
è:' è:' 'E � � ûî ro ro O.::J ::J ::J ::J ::J<(••Cl aj.Eo Mr--- � Q) C') 0 ... -, LL "SI" "SI" "SI" O N2012
Fig. 4. Mean oil concentration in seeds of Jatropha curcas harvested on different dates during 3 years. Different letters indicate significant differences between means at p < 0.05, vertical lines represent standard errors, n = 1 O.
■ Kernel (%)
-
80� 0 Seed oil concentration (%)
-
c-0� Ill .: - 60 CO 'tJ ... G) -5i
G) 1/) U C C ·- 40o-(,) G) - C
·- ...
0 G) 'tJ � 20 G) G) u, 300 400 500 600 700 800Seed dry weight (mg)
Fig. 5. Bilinear regressions between oil concentration{%) (y= -8.68 + 0.07 42x); up ta 595 mg, the slope was significantly different from zero at p < 0.001, n = 65; and n = 71 for values higher than 594.9 mg, with slopes not significantly (p > 0.05) different from zero) and kernel percentage (%) of total seed dry weight (y= 26.89 + 0.0592 x; up ta
624 mg, the slope was significantly different from zero at p < 0.001, n = 47; and n = 33 for values higher than 624 mg with slopes not significantly (p > 0.05) different from zero).
-so
y = -32.2 + 1.065x � 0 r2 = 0.90, n=81, (p<0.001)-
C 40.2
30 C: a., (J C: 20 (J·o
10 a., a., 0 30 40 50 60 70 80Seed kernel proportion (%)
Fig. 6. Linear regression between seed oil concentration {%) and kernel percentage in seed (%).
2011 (means ± standard error, respectively) whereas the lowest was 19.6 ± 1.8% on 1 7 March, 201 O. Seasonal variations in seed oil concentration presented the same pattern that was found for seed weight only in 2010, while for the remaining years, seed oil concentration tended to be more stable among harvest dates.
The relationship between oil concentration and seed weight can be explained through a bilinear regression. Oil concentra tion increased linearly as seed weight became heavier, up to a value of 605 mg, after which higher seed weight was not associ ated with increases in seed oil concentration (Fig. 5). ln addition, the relationship between kernel percentage and seed weight pre sented the same pattern that seed oil concentration, where linear increases were detected up to a value of 625 mg (p < 0.01 ), after
which increases in seed weight were not associated with changes in kernel percentage (Fig. 5 ). No significant differences (p < 0.05) were
found between the values from which both relationships begin to have a slope equal to zero (605 and 625 mg).
Oil concentration was largely ( r2 = 0.85) and significantly (p < 0.01) explained by the kernel percentage through linear regres sion (y= -25.9 + 0.967x, n = 156, p < 0.001; Fig. 6).
No significant relationships were found between mean temper ature 25 DBH and individual seed weight (p = 0.107) or seed oil concentration (p = 0.204; Fig. 7). In addition, no relationships were
0 Seed weight
� 70
•
Seed oil concentration 800 � C 60 0 0 0 0 <P 700 (/) 0 0 CD ;; CO 50 0 0 0 600 CD C.-
C 0 0 0 500 :E Q) 40 0 CD u••
C:
•• •
-
o _. 400 :::T 0 -u 30•
•
3003
ë:i•
!:9.. "C 20•
200 Q) Q)"'
10 100 15 20 25 30 Mean temperature 25 DBH (°C)Fig. 7. Relationships between mean temperature 25 DBH and seed weight (mg) and oil concentration {%, n = 15 ).
found with other environmental variables, such as solar radiation or water availability (data not shown).
3.3. Oil characteristics 3.3.1. Fatty acid composition
The main fatty acids present were linoleic and oleic, which ranged from 28.9 to 47.5% and from31.7 to47.1%, respectively; with a minor proportion of palmitic (13.1-14.1%) and stearic (7.2-4.1%) and minimal proportions of palmitoleate (0.72-1.04%), linoleic (0.18-0.312%) and arachidonic (0.14-0.24%; Table 1). Linoleic and oleic concentrations were strongly affected by harvest date, while the proportion of minor components tended to be stable.
3.3.2. Glycerides composition, cetane number and iodine values
The proportions of free fatty acids, mono-and diglycerides in oil were very small, and the total amount of the three compounds was always lower than 3% (Table 2). The harvest date significantly affected (p < 0.05) the proportion of free fatty acids and monoglyc
erides. The proportion of free fatty acids on 17 March 2010 was significantly higher than that found on 22 June 2010 and 23 August 2010, while among the rest of the harvest dates there were no significant (p > 0.05) differences. The proportion of monoglycerides
was significantly (p < 0.05) higher on 01 May 2010 and 25 April 2011
compared with those found on 17 March 2010, 26 January 2011 and 20 May 2011, while among the remaining harvest dates there were no significant differences (Table 2). The amounts of diglycerides were very low and significant differences (p < 0.05) were found
among seed collected on 01 May 2010 and 25 April 2011 compared with those harvested on 17 March 2010, 26 January 2011 and 20 May 2011. No significant differences (p < 0.05) were found for the proportion of triglycerides on any of the harvest dates evaluated. The CN and IVhad values in the range of 47.1-52.1 and 96.6-116.1, respectively.
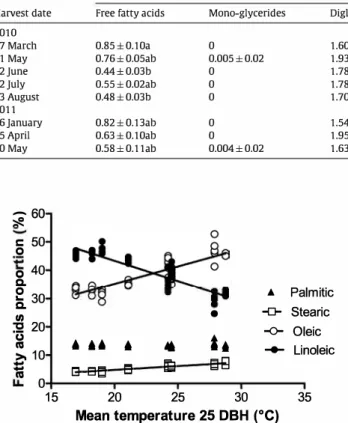
3.3.3. Relationship between temperature during grain filling and fatty acid composition
For each harvest date, we calculated the thermal environment under which seed filling occurred, considering the mean daily tem perature during 25 DBH. The oil fatty acids proportion, especially for oleic and linoleic acids, was strongly affected by mean temper ature 25 DBH (Fig. 8). Under the cool mean temperatures of 19.0, 1 7 .0 and 18.2 °C registered for the harvest dates on 22 June, 2010, 22 July, 2010 and 23 August, 2010 respectively, we found the highest proportion of linoleic acid ( 47.5-45.4%) and the lowest oleic acid proportion (31.7-33.4%, Fig. 8). Under warmer temperatures (27.9 and 28.7 °C), forthe harvest dates on 17 March, 2010 and 26January, 2011, respectively, we found the opposite response pattern, with
Table 1
Fatty acid composition in oil obtained from seeds harvested on different dates during two years (2010 and 2011) from an experimental plantation of]atropha curcas in Formosa, Argentina. Means ± standard errors, n = 1 O. Different letters indicate significant differences between means at p < 0.05.
Fatty acids
Harvest date Palmitic (C16:0) Palmitoleate (16:1n7c) Stearic (C18:0) Oleic (C18:1n9c) Linoleic (C18:2n6c) Arachidonic (C20:0) Linolenic (Cl 8:3n3a) 2010
17 March 14.1 ±0.4a 1.04±0.10a 6.6±0.lb 47.1 ± 1.5a 28.9 ± 1.lf 0.24 ± 0.005a 0.31 ± 0.016a 01 May 13.4±0.lab 0.80±0.02b 6.3±0.2b 42.4±0.9b 35.4± 1.0d 0.20 ± 0.005c 0.20 ± 0.005c 22June 13.8±0.2ab 0.88 ± 0.03ab 4.1 ±0.le 31.7 ±0.6e 47.5±0.6a 0.14±0.004f 0.23 ± 0.009b 22July 13.9±0.lab 0.97±0.02a 4.2±0.le 33.4±0.3e 45.4±0.3ab 0.14 ± 0.002f 0.24 ± 0.003b 23 August 13.5 ±0.2ab 1.03 ±0.05a 4.2±0.le 32.9±0.7e 46.0±0.7ab 0.15 ± 0.002ef 0.30 ± 0.010a 2011
26January 13.2 ±0.3ab 0.72±0.03b 7.2±0.4a 45.4±0.2a 31.8±0.4e 0.22 ± 0.008b 0.19 ± 0.006c 25 April 13.1 ±0.2b 0.79±0.03b 5.9±0.lc 38.1 ±0.6c 40.3±0.6c 0.18 ± 0.002d 0.19 ± 0.006c 20May 13.5±0.2ab 0.87 ± 0.02ab 4.9±0.ld 35.2 ±0.4de 43.7±0.4b 0.16±0.003e 0.18 ± 0.004c
Table 2
Glycerides composition and biodiesel quality of oil from seeds harvested on different dates during 201 O and 2011 from a plantation of]atropha curcas in Formosa, Argentina. Mean± standard error, n= 10. Different letters indicate significant differences between means at p < 0.05. Limits values for ASTM D 6751-15a for grade N°1-B15 biodiesel and
EN 14214 (in parentheses): Acid number (mg KOH g-1) 0,5 (0,5); Cetane number: 47 (51); Monoglycerides: 0,4 (0,8); Diglycerides:(0,2); ladine value:(120 max). Glicerydes composition(%, mass) Biodiesel quality
Harvest date Free fatty acids Mono-glycerides Diglycerides T riglycerides Cetane number ladine value (gl/100 g) 2010
17 March 0.85±0.10a 0 1.60±0.07b 97.54±0.14a 52.1 96.6 01 May O. 76 ± 0.05ab 0.005±0.02 1.93±0.06a 97.30 ± 0.05a 50.4 103.6 22June 0.44±0.03b 0 1.78 ± 0.05ab 97.77±0.07a 47.7 116.1 22July 0.55 ± 0.02ab 0 1.78 ± 0.05ab 97.66±0.07a 48.2 113.8 23 August 0.48±0.03b 0 1.70±0.02ab 97.82 ± 0.05a 48.0 114.9 2011
26January 0.82 ± 0.13ab 0 1.54±0.07b 25 April 0.63 ± 0.10ab 0 1.95±0.07a 20May 0.58 ± 0.11 ab 0.004±0.02 1.63±0.lOb -60 � C 50 0 40 0 C.
e
30...
Palmitic C. -0- Stearic Ill•
:2 20 -0- Oleic (,)*•
ni••• •
-
-+- Linoleic >, 10-
I:! �bl-B
-
ni 13- 13 E;l 0 15 20 25 30 35 Mean temperature 25 DBH (°C)Fig. 8. Fatty acids composition of Jatropha curcas oil obtained from seed filled under different mean temperatures 25 days before harvest (DBH). Linear regres sion between mean temperature during 25 DBH and fatty acids percentage (stearic acid = -0.60 + 0.269 mean temp 25 DBH (°C), r2 = 0.84; oleic acid = 10.34 + 1.24 mean
temp 25 DBH (°C), r2 = 0.78; linoleic acid = 72.39-1.44 mean temp 25 DBH (°C),
r2 =0.79; n=50,p<0.001).
the lowest linoleic proportion (28.9 and 31.8%, respectively) and
maximum oleic proportion (47.1 and 45.4%, respectively, Fig. 8).
The proportion of stearic acid increased significantly with higher temperature 25 DBH, but showed lower sensitivity (regression slope: 0.27) than that found for oleic (slope: 1.24) and linoleic (slope; -1.44) acids while the proportions of minor oil fatty acids were more stable and their si opes were not statistically (p > 0.05) different from zero (Fig. 8).
97.65 ± 0.20a 51.3 99.8 97.42 ± 0.87a 49.3 108.7 97.79 ± 0.21a 48.4 112.3
4. Discussion
The environmental conditions during grain filling correspond ing to seeds from different cohorts which were exposed, created a broad individual seed weight that ranged between 326 and 752 mg (Fig. 2), and resulted higher than the ranges reported for different genotypes evaluations under the same environmental conditions ( 569.8-790.9 mg, Rao et al., 2008; 491-683 mg, Subramanyam et al., 2010 and 493-742 mg, Rathbauer et al., 2012). In coinci dence, a similar pattern was observed for oil seed concentration, which ranged between 12.8 and 40.6% (Fig. 4). These results clearly revealed that harvest date has the same importance as the genotype for determining both individual seed weight and oil seed concen tration in]. curcas.
The results clearly revealed that the partitioning between ker nel and seed coat depends on the wide range of individual seed weight generated by the different harvest dates. Thus, the kernel weight was strongly associated (r2 = 0.97) and showed a high sen
sitivity (linear regression slope = 0.83) to changes in seed weight (Fig. 3 ), while the seed coat weight was Jess sensitive (linear regres sion slope 0.17). The average kernel proportion in seeds found in this work (60.43 ± 0.07%, mean ± standard error, respectively) was similar to the mean of 63.6% found by Montes et al. (2013) and the ranges reported by Naresh et al. (2012) and Makkar et al. (1997) for genotypes evaluation trials (53.9-64.2%).
As a consequence of the above described, a bilinear relationship was found between the proportion of kernel in seed ( expressed as% of total seed weight) and seed weight, with a threshold around 625 mg, where no increases were produced with higher seed weights (Fig. 5). Since oil concentration was strongly associated with the proportion of kernel in seed (Fig. 6), a similar pattern
was also observed for the former as a function of seed weight (Fig. 5), which oil concentration increases up to a similar seed weight ( 605 mg) than for the proportion of kernel in seed. Clearly, this pattern limits the usefulness of seed weight as a tool to identify genotypes with high oil seed concentration. Consistently with our results, a linear relationship between seed weight and oil concen tration was found by Karaj and Müller (2010). As explained above, seed oil concentration was better explained (90% through a linear relationship) by the kernel proportion (Fig. 6), which could be use fui as a rapid genotypes selection criterion for genotypes with high oil concentration, in the same way as was performed during the sunflower breeding process (L6pez Pereira et al., 1999).
Variations in seed weight and oil concentration were not associ ated with changes in average temperature (or radiation, rainfall or exposure time to temperatures above 30 and 35 °c either) during the grain filling period (Fig. 7). This results are inconsistent with the general pattern of temperature response observed in other oil crops such as sunflower (Rondanini et al., 2003), castor bean (Rici nus communis L.; Vallejos et al., 2011 ), jojoba (Simmonsdia chinensis
L.; Wardlaw and Dunstone, 1984) and flax (Linum usitatissimum
L.; Green, 1986), where the lower rate of grain filling under cool temperatures is overcompensated by the higher grain filling dura tion, resulting in heavier seeds with higher oil concentration due to longer grain filling duration (Rotundo and Westgate, 2009; Triboi and Triboi-Blondel, 2002). Likewise, no interactions were found between temperature 25 DBH and other environmental factors that affect seed weight and oil concentration, such as solar radiation accumulated during grain filling, as found in sunflower for water status (Seiler, 1986; Aguirrezabal et al., 2003). This apparent tem perature insensitivity during seed filling could be caused by the temperature ranges explored in these experiments, which that may not have been high enough to reduce seed weight and oil concen tration. In this experiment, average temperatures explored were between 17-29.2 °C. However, on some harvest dates the seeds were exposed to extended periods of heat stress (i.e on 24 February, 2012, 248 h with temperatures > than 30 °c and 86 h > 35 °c were
recorded. This represents 41 and 14%, of the filling period consid ered (25 DBH) respectively, while on 01 April, 2012, 243 h > 30 °c
and 74 h > 35 °C were registered (40 and 12%, respectively). This fact allows arguing that on some harvest dates thermal stress conditions were more severe than those reflected by average temperatures.
On the other hand, changes in seed weight and oil concentra tion observed for the different harvest dates could be explained by fluctuations in the plants source-sink relation through the grow ing season generated by a tracte-off between seed number and seed weight (Sadras, 2007; Pallas et al., 2013). In perennial plants, it becomes more important to consider the raie of carbohydrate reserves, which can be partitioned toward seeds when availabil ity of assimilates is restricted, or to be a sink of photoassimilates when the plant accumulates reserves. In]. curcas there is no infor mation on carbohydrate dynamics, the organs where reserves are accumulated, or their contribution to grain filling. Further research is needed in order to test this possibility.
The information available about]. curcas oil fatty acid composi tion was mainly focused on the genotypic effect, and differences were found for the proportions of their main fatty acids ( oleic and linoleic), which ranged between 35.1-42.7% and 31.6-38.2%, (Rathbauer et al., 2012), 36.7-42.6 and 37.5-43.4% (Rodrigues et al., 2013), respectively. As a complement of this approach, we found that environmental conditions during seed grain filling strongly affected oil composition.
Environmental conditions during grain filling strongly affected oil composition. Temperature response pattern found for]. curcas
oil was similar to that found for traditional oily crops like sun flower and rapeseed (Brassica napus var. oleifera L.), where high temperature during oil synthesis period increases the oleic/linoleic
acid ratio (Rondanini et al., 2003; Green, 1986). However, this con trasted with the response found for the olive fruit (Olea europaea
L.), where increases in temperature during fruit filling determine reductions in the oleic acid proportion (Garcia-Inza et al., 2016).
Despite the fact that the main saturated fatty acids present in ]. curcas oil (palmitic and stearic) showed significant differ ences among harvest dates, the magnitude of differences was considerably small, while oleic and linoleic showed high sensitiv ity to temperature during grain filling. We found that for every 1 °c increase in mean temperature during the 25 DBH oleic acid increased by 1.24% and stearic acid by 0.26% while linoleic acid decreased by 1.44%. In this sense, Demurin et al. (2000) found incre ments of 2% in the oleic acid percentage for every degree increased during sunflower fruit filling.
In general terms, no important changes were produced by the different harvesting dates over the quality of biodiesel. Thus, FFA found on ail harvest dates were very low (0.44-0.85%) and simi lar to the values range (0.42-2.31%) reported by Rodrigues et al. (2013) and Akminul Islam et al. (2013). Nevertheless, higher FFA values, ranging between 2.24-4.5%, were found by Nzikou et al. (2009) and Adebowale and Adedire (2006) while Huerga et al. (2014) reported the highest FFA values for]. curcas oil obtained in Argentina (8.7-20.5%). The large variation of FFA values reported in the literature suggests that this parameter should be carefully considered. There is no evidence to relate FFA with genotype or environmental conditions during grain filling, but it was demon strated that in early stages of grain filling the proportion of FFA is high and then drops abruptly (Annarao et al., 2008). Thus, the incor poration of immature seeds during harvesting could be the cause of FFA increases.
In addition, changes in oil composition produced by different temperatures during grain filling could have changed the quality of biodiesel and in this sense triacylglycerols were found to comprise the major oil component (""97.5%) followed by diacylglycerols and free fatty acids (FFA), with practically absent monoacylglycerols on ail harvest dates (Table 2).
Finally, the iodine values found in this study ranged between 96.6 and 116.1, and they were similar to values reported in the literature (Akintayo, 2004; Nzikou et al., 2009) and broadly being close to the limits set by the rather restrictive maximum value of 120 (EN 14214, 2003). Cetane number has specified minimum val ues of 47 for the USA (ASTM D6751, 2008) and 51 for the European Organization (EN 14214, 2003). The estimated CN for]. curcas oil obtained in this work was between 47.7 and 52.1 and, for ail har vest dates the quality standards used in USA were met. However, only on 2 of the 8 harvest dates evaluated, values set by European regulations were reached. The higher CN values were obtained in oil from seed filled during the warm months as a consequence of their higher oleic and stearic acids proportions and lower linoleic acid proportion.
5. Conclusions
This paper makes a contribution in determining the existence of harvest dates effects on seed quality and oil concentration unre lated with the environmental conditions explored during grain filling period, which suggests that plant internai balance could play an important raie in the regulation of seed quality. The variations for seed weight and oil concentration found in this work have sim ilar magnitude to those found for genotypic evaluations, which highlights the importance of working in order to understand the ecophysiological mechanisms involved in generation of good qual ity seeds.
The relationship between seed weight and oil concentration was described by a bi-lineal regression, which limits its usefulness as
a rapid selection tool for genotypes with high oil concentration. The strong relationship between seed kernel proportion and oil concentration offers a rapid tool to identify genotypes with high oil concentration. The functional relationship that explains this is the lower seed coat weight sensitivity to changes in seed weight compared with the kernel weight.
Fatty acid oil composition was affected by mean temperature during seed filling in a similar way to the reported for most oil crops, where warmer conditions increased the oleic acid proportion and decreased linoleic, but the magnitude of changes observed gener ated non important effects on the biodiesel quality. On the other hand, no sensitivity to temperature was detected for oil concen tration and individual seed weight. This tractes could be of great interest in the context of global warming, because they open the possibility of introducing more stable oilseed crops in order to gen erate more stable grain yield and quality.
More controlled experiments should be conducted in order to expand the temperature ranges explored during grain filling under field conditions, as well as for understanding the carbohy drate dynamics in the plant and characterize whether variations in the sink-source relationships throughout the growing season may affect]. curcas seed quality.
Aclmowledgements
We are grateful to Evaristo Agüero, Valerio Jara y Crispin Portillo for their farm assistance; Ing. Agr. Adrian Morganti for carrying out the contact in Formosa farm of Patagonia Bioenergia SRL Ubacyt 20020130100379BA, programaci6n 2014-2017 provided financial support for this study. Dr. R. Takahashi, Universidad Cat6lica Nuestra Sefiora de la Asunci6n, for facilitating meteorological infor mation. ARFITEC Program (2011-2012) for funding transportation and accommodation in Toulouse, France. Muriel Cerny for her tech nical assistance in Laboratoire de Chimie Agro-industrielle (LCA), Toulouse, France.
References
Achten, W.M., Verchot, L., Franken, Y.J., Mathijs, E., Singh, V.P., Aerts, R., Muys, B., 2008.Jatropha bio-diesel production and use. Biomass Bioenergy 32 (12), 1063-1084.
Adebowale, K.O., Adedire, C.O., 2006. Chemical composition and insecticidal properties of the underutilized Jatropha curcas seed oil. Afr. J. Biotechnol. 5 (10), 901-906.
Adil Edrisi, S., Kant Dubey, R., Tripathi, V., Bakshi, M., Srivastava, P., Jamil, S., Singh, H.B., Singh, N., Abhilash, P.C., 2015.jatropha curcas L.: a crucified plant waiting for resurgence. Renew. Sustain. Energy Rev. 41, 855-862.
Aguirrez.ibal, L.A.N., Lavaud, Y., Dosio, G.A.A., Izquierdo, N.G., Andrade, F.H., Gonz.ilez, LM., 2003. Intercepted solar radiation during seed filling determines sunflower weight per seed and oil concentration. Crop Sei. 43 (1), 152-161.
Akintayo, E.T., 2004. Characteristics and composition of Parkia biglobbossa and
Jatropha curcas oils and cakes. Bioresour. Technol. 92 (3), 307-310.
Akminul Islam, A.KM., Primandari, S.R.P., Yaakob, z., Anuar, N., Osman, M., 2013.
The properties of Jatropha curcas seed oil from seven different countries. Energy Sour., Part A: Recovery Util. Environ. Effects 35 (18), 1698-1703.
Annarao, S., Sidhu, O.P., Roy, R., Tuli, R., Khetrapal, C.L., 2008. Lipid profiling of developingjatropha curcas L. seeds using 1 H NMR spectroscopy. Bioresour.
Technol. 99 (18), 9032-9035.
ASTM D6751, 2008. Standard specification for biodiesel fuel {BlOO) blend stock for distillate fuels. In: Annual Book of ASTM Standards. ASTM, International, West Conshohocken.
Canvin, D.T., 1965. The effect oftemperature on the oil content and fatty acid composition of the oils from several oil seed crops. Can. J. Botany 43, 63-69.
Carels, N., 2009. Chapter 2. Jatropha curcas. A review. Adv. Bot. Res. 50, 39-86.
Demurin, Y., Skorié, D., Veresbaranji, I.,Jocié, S., 2000. Inheritance ofincreased oleic acid content in sunflower seed oil. Helia 23 (32), 87-92.
EN 14214, 2003. Committee for standardization. Automotive fuels - fatty acid methyl esters {FAME) for diesel engines - Requirements and test methods. European Committee for Standardization, Brussels, Method EN 14214. Francis, G., Edinger, R., Becker, K., 2005. A concept for simultaneous wasteland
reclamation, fuel production, and socio-economic development in degraded areas in India: need, potential and perspectives of Jatropha plantations. Nat. Resour. Forum 29, 12-24.
Garda-Inza, G.P., Castro, D.N., Hall, A.J., Rousseaux, M.C., 2016. Opposite oleic acid responses ta temperature in oils from the seed and mesocarp of the olive fruit. Eur. J. Agron. 76, 138-147.
Garofalo, R., 2007. EU Biodiesel Markets European Biodiesel Board, http: / /www. cres.gr/biodiesel/pdf/Meetings/NationalWorkshopCyprus/
Biodiesel%20Markets.pdf (last access: 07 /10/16).
Ginwal, H.S., Rawat, P., Srivastana, R., 2004. Seed source variation in growth performance and oil yield of]atropha curcas Linn. in Central India. Silvae Genetica 53 (4), 186-192.
GraphPad., 2007. GraphPad Prism version 5.01 for Windows, GraphPad Software La Jalla California USA www.graphpad.com.
Green, AG., 1986. Effect of temperature during seed maturation on the oil composition oflow-linolenic genotypes offlax. Crop Sei. 26 (5), 961-965.
Hoekman, S.K., Broch, A., Rabbins, C., Ceniceros, E., Natarajan, M., 2012. Review of biodiesel composition, properties, and specifications. Renew. Sustain. Energy Rev. 16 (1), 143-169.
Huerga, l.R., Zanuttini, M.S., Gross, M.S., Querini, C.A., 2014. Biodiesel production
from]atropha curcas: integrated process optimization. Energy Convers. Manage. 80, 1-9.
Kalayasiri, P., Jayashke, N., Krisnangkura, K., 1996. Survey of seed oils for use as diesel fuels.]. Am. Oil Chem. Soc. 73, 471-474.
Karaj, S., Müller, J., 2010. Determination of physical, mechanical and chemical properties of seeds and kernels of]atropha curcas L. Ind. Crops Prad. 32 (2), 129-138.
Kaushik, N., Kumar, K., Kumar, S., Kaushik, N., Roy, S., 2007. Genetie variability and divergence studies in seed traits and oil content of Jatropha Uatropha curcas L.) accessions. Biomass Bioenergy 31, 437-592.
Keuls, M., 1952. The use of the studentized range in connection with an analysis of variance. Euphytica 1, 112-122.
Krisnangkura, K., 1986. A simple method for estimation of Cetane index of vegetable oil methyl esters. J. Am. Oil Chem. Soc. 63, 552-553.
L6pez Pereira, M., Sadras, V.O., Trapani, N., 1999. Genetie improvement of sunflower in Argentina between 1930 and 1995 1. Yield and its components. Field Crops Res. 62 (2-3), 157-166.
Laviola, B.G., Silva, S.D., Juh.isz, AC., Rocha, R.B., de Oliveira, R.j., Albrecht, j.C., Alves, A.A., Rosado, T.B., 2014. Agronomie performance and genetic gain by selection of physic nut in three Brazilian regions. Pesquisa Agropecu. Bras. 49 (5), 356-363.
Makkar, H., Becker, K., Sporer, F., Wink, M., 1997. Studies on nutritive potential and toxic constituents of different provenances of Jatropha curcas. J. Agric. Food. Chem. 45 (8), 3152-3157.
Montes,J., Technow, F., Bohlinger, B., Becker, K., 2013. Seed quality diversity, trait associations and grouping of accessions in]atropha curcas L. Ind. Crops Prad. 51, 178-185.
Murphy, G., Hurtado, R., Fern.indez Long, M.E., Serio, L., Faroni, A., Spescha, L., Maio, S., Barnat.in, 1., 2008. Atlas Agroclim.itico de la Argentina. Ed Facultad de Agronomia. Universidad de Buenos Aires, pp. 160 pp.
Naresh, B., Reddy, M.S., Vijayalakshmi, P., Reddy, V., Devi, P., 2012.
Physico-chemical screening of accessions of]atropha curcas for biodiesel production. Biomass Bioenergy 40, 155-161.
Nzikou,j.M., Matas, L., Mbemba, F., Ndangui, C.B., Pambou-Tobi, N.P.G., Kimbonguila, A., Silou, T., Linder, M., Desobry, S., 2009. Characteristics and composition of]atropha curcas oils, variety Congo-Brazzaville. Res. J. Appl. Sei., Eng. Technol. 1 (3), 154-159.
Oliveira,]., Leite, P.M., de Souza, L.B., Mello, V.M., Silva, E.C., Rubim,J.C., Meneghetti, S.M.P., Suarez, P.A.Z., 2009. Characteristics and composition of
Jatropha gossypiifolia and]atropha curcas L. oils and application for biodiesel production. Biomass Bioenergy 33 (3), 449-453.
Pallas, B., Mialet-Serra, 1., Rouan, L., Clément-Vidal, A., Caliman, J,P., Dingkuhn, M., 2013. Effect of source/sink ratios on yield components, growth dynamics and structural characteristics of oil palm (Elaeis guineensis) bunches. Tree Physiol. 33 (4), 409-424.
Rao, G.R., Korwar, G.R., Shanker, A.K., Ramakrishna, Y.S., 2008. Genetie associations, variability and diversity in seed characters, growth, reproductive phenology and yield in]atropha curcas (L.) accessions. Trees - Struc. Funct. 22 (5), 697-709.
Rathbauer, J., Sonnleitner, A., Pirot, R., Zeller, R., Bacovsky, D., 2012.
Characterisation of Jatropha curcas seeds and oil from Mali. Biomass Bioenergy 47, 201-210.
Rodrigues, J., Miranda, 1., Gominho, J., Vasconcelos, M., Barradas, G., Pereira, H., Bianchi-de-Aguiar, F., Ferreira-Dias, S., 2013. Variability in oil content and composition and storage stability of seeds from]atropha curcas L. grown in Mozambique. lnd. Crops Prad. 50, 828-837.
Rondanini, D., Savin, R., Hall, A.J., 2003. Dynamics of fruit growth and oil quality of sunflower (Helianthus annuus L.) exposed ta brief intervals of high temperature during grain filling. Field Crops Res. 83 ( 1 ), 79-90.
Rondanini, D.P., Castro, D.N., Searles, P.S., Rousseaux, M.C., 2014. Contrasting patterns of fatty acid composition and oil accumulation during fruit growth in several olive varieties and locations in a non-mediterranean region. Eur. J. Agron. 52, 237-246.
Rotundo, J., Westgate, M.E., 2009. Meta-analysis of environmental effects on
soybean seed composition. Field Crops Res. 110 (2), 147-156.
Sadras, V.O., 2007. Evolutionary aspects of the trade-offbetween seed size and number in crops. Field Crops Res. 100 (2-3), 125-138.
Seiter, G., 1986. Analysis of the relationships of environmental factors with seed oil and fatty acid concentrations of wild annual sunflower. Field Crops Res. 15 ( 1 ), 57-72.
Senger, E., Martin, M., Dongmeza, E., Montes, J.M., 2016. Genetie variation and genotype by environment interaction injatropha curcas L. germplasm evaluated in different environments of Cameroon. Biomass Bioenergy 91, 10-16.
Silva, L.J., Fernandes dos Santos Dias, D.C., do Carma Milagres, C., dos Santos Dias, LA., 2012. Relationship between fruit maduration stage and physiological quality of physic nut Uatropha curcas L.) seeds Ciência e Agrotecnologia. Lavras 36 ( 1 ), 39-44.
Singer, S.D., Zou, J., Weselake, R.J., 2016. Abiotic factors influence plant storage lipid accumulation and composition. Plant Sei. 243, 1-9.
Singh, R.P., Prasad, P.V., Reddy, I<.R., 2013. Chapter two - impacts of changing climate and climate variability on seed production and seed industry. In: Donald Sparks, L. (Ed.), Ad van ces in Agronomy, vol. 118. Academic Press, pp. 49-110.
Sinha, P., Aminul, M.1., Negi, M.S., Tripathi, S.B., 2015. Changes in oil content and fatty acid composition in]atropha curcas during seed development. Ind. Crops Prad. 77, 508-510.
Subramanyam, K., Dowlathabad, M.R., Devanna, N., Subramanyam, K., 2010.
Eco-geographical variation of seed traits, oil content and categorization of
Jatropha curcas (L.) accessions Ecology. Environ. Conserv. 16 (1), 29-33.
Trémoliéres, A, Dubacq, J.P., Drapier, D., 1982. Unsaturated fatty acids in maturing seeds of sunflower and rape: regulation by temperature and light intensity. Phytochemistry 21 (1), 41-45.
Triboi, E., Triboi-Blondel, AM., 2002. Productivity and grain or seed composition: a new approach to an old problem-invited paper. Eur. J. Agron. 16, 163-186.
Vallejos, M., Rondanini, D.P., Wassner, D.F., 2011. Water relationships of castor bean (Ricinus communis L.) seeds related to final seed dry weight and physiological maturity. Eur. J. Agron. 35, 93-101.
Van Eijck, J., Romijn, H., Balkema, A., Faaij, A., 2014. Global experience with jatropha cultivation for bioenergy: an assessment of socio-economic and environmental aspects. Renew. Sustain. Energy Rev. 32, 869-889.
Wani, S.P., Garg, I<.I<., Chanderenger, G., 2016. Water needs and productivity of
Jatropha curcas in India: myths and facts. Biofuels Bioprod. Bioref. 10, 240-254.
Wardlaw, J.F., Dunstone, R.L., 1984. Effect of temperature on seed development in jojoba (Simmondsia chinensis (Link) Shneider): I dry matter changes. Aust. J. Agric. Res. 35, 685-691.