a publisher's https://oatao.univ-toulouse.fr/27043
https://doi.org/10.29008/ETC2017-143
Chandramouli, Sathyanarayanan and Gojon, Romain and Fridh, Jens and Mihaescu, Mihai Numerical Characterization of Entropy Noise With a Density Based Solver. (2017) In: 12th European Conference on Turbomachinery Fluid dynamics & Thermodynamics (ETC12), 3 April 2017 - 7 April 2017 (Stockholm, Sweden).
Paper ID: ETC2017-143 Proceedings of 12th European Conference on Turbomachinery Fluid dynamics & Thermodynamics ETC12, April 3-7, 2017; Stockholm, Sweden
NUMERICAL CHARACTERIZATION OF ENTROPY NOISE
WITH A DENSITY BASED SOLVER
Sathyanarayanan Chandramouli, Romain Gojon, Jens Fridh, Mihai Mihaescu
Departments of Mechanics & Energy Technology Royal Institute of Technology (KTH) Linn´e FLOW Centre, Stockholm, Sweden
[email protected], [email protected], [email protected], [email protected]
ABSTRACT
In this work, dbnsTurbFoam, a new coupled density based solver, written in the frame-work of foam-extend, is considered. The solver is first assessed on two canonical compress-ible flow scenarios, namely the Sod’s shock tube and the ONERA S8 transonic channel. Results are compared with analytical formulations and experiments, respectively. 2-D Unsteady Reynolds Averaged Navier-Stokes simulations and 3-D Large Eddy Simulations of the flow within the passages of a geometrically simplified High Pressure Turbine Noz-zle Guide Vane are then performed. Results are compared against experimental data in order to justify the geometrical simplifications made. Finally, the case of a sinusoidal tem-perature forcing at the inlet is considered in order to study the phenomenon of indirect combustion noise. Notably, the impact of the forcing on the vortex shedding dynamics and on the losses is discussed.
KEYWORDS
dbnsTurbFoam, transonic blade passage, indirect combustion noise NOMENCLATURE
H High of the ONERA transonic chanel (m)
CaxAxial chord (m)
St Strouhal number (-)
Mis Isentropic Mach number (-)
INTRODUCTION
The high speed compressible flow within turbomachinery blade passages produces an ar-ray of complex interactions. A physical insight into these processes is of importance for the thermal, structural and acoustic design of its components. Experimental tests to characterize compressible flow phenomena are expensive, and are often pushed towards the final stages of component design. With the advent of high fidelity Computational Fluid Dynamics codes, numerical simulations are gaining importance in the early stages of the product design and de-velopment. The purpose of the present work is to validate the new density based, open source solver dbnsTurbFoam (Rusche et al., 2014). The solver is first validated on two canonical com-pressible flow scenarios, namely a Sod’s shock tube (Sod, 1978) and a shock wave-turbulent boundary layer interaction in a transonic channel flow (D´elery et al., 1978). In the second part, the solver is used to simulate the flow through a geometrically simplified High Pressure Tur-bine Nozzle Guide Vane (HPT-NGV) cascade for which experimental results were acquired by
Yasa et al. (2010). A 2-D Unsteady Reynolds Averaged Navier-Stokes simulation (URANS) and a 3-D Large Eddy Simulation (LES) are conducted and compared to experimental results. Finally, an attempt is made to analyze the mechanism of the indirect combustion noise by using a fluctuating temperature at the inlet.
COUPLED DENSITY BASED SOLVER
The present work employs the newly released coupled density based solver dbnsTurbFoam developed within foam-extend frame-work (Rusche et al., 2014) available at https://sourceforge.net /p/openfoam-extend/foam-extend-3.1/ci/3c5ba8da44948851ffdcddc1a944a9ae5cf407a2/tree /applications/solvers/compressible/dbnsTurbFoam/. It is an open-source, cell-centered, finite volume software. The high speed compressible flow phenomena studied in this work are char-acterized by non-linear waves and strong interactions between shocks and turbulence. Coupled density based solvers respect the strong inter-dependence of flow variables in compressible flu-ids, resulting in robust and accurate solutions.
Numerical schemes
The simulations are performed by solving the compressible Navier-Stokes equations. The advective terms are discretized using the Local Lax-Friedrichs scheme. It is a central scheme of second order accuracy, with an adaptive addition of numerical viscosity based on the maxi-mum local wave speed. Moreover, in order to avoid spurious oscillations near shocks, a Barth-Jespersen’s flux limiter is applied in regions of the flow with large gradients. A conservative, second order central scheme was chosen to discretize the viscous terms. For the temporal dis-cretization, an explicit four-stage, low storage, Runge-Kutta algorithm is used (Blazek, 2015). In this work, 1-D Euler, 2-D URANS and 3-D LES simulations are performed. The SST k − ω based on the formulations described by Menter and Esch (2001) was employed for the com-pressible URANS simulations. The turbulence model is reported to work well in separated flows and in free-stream (Pope, 2001). The LES employs a one equation SGS turbulent ki-netic energy transport equation to compute the sub-grid scale eddy viscosity. With this scheme, De Villiers (2007) reports an improved performance over algebraic sub-grid scale models in flows with large scale unsteadiness.
Sod’s shock tube
High speed compressible flows entail the presence of shocks and other non-linear waves propagating in different directions. The 1-D shock tube is a representative test case to attest the solver against capturing these flow features. The case presented by Sod (1978) is a standard shock tube problem with normalized domain dimensions and flow field variables. dbnsTurb-Foam is used to solve the 1-D Euler equations across the flow domain. The results for this case are obtained on a computational domain discretized into 800 segments. Figure 1 shows the results for density at the initial time and at a time t = 0.15s. For the latter case, the analytical solution is also shown (Anderson, 1990). An excellent agreement was obtained in terms of the simulated wave speeds. The simulation results were also characterized by desirable levels of low numerical dissipation and non-existent Gibbs oscillations.
Transonic channel
In order to capture the complex interaction processes in turbulent, high speed compressible flows, the 2-D ONERA S8 channel is chosen. Experiments were conducted by D´elery et al.
0 0.5 1 x (a) 0 0.5 1 D en si ty 0 0.5 1 x (b) 0 0.5 1 D en si ty
Figure 1: Density at (a) t = 0s and (b) t = 0.15s.
(1978) in order to investigate shock wave-turbulent boundary layer interactions. Such interac-tions are triggered either by an external impinging shock wave on a boundary layer, or when a supersonic confined flow reached a sharp restriction, leading to the formation of a shock wave. The latter are observed to occur in the transonic flows within turbo-machinery passages. In the present work, based on the predominantly 2-D nature of the flow field reported from ex-periments, 2-D compressible URANS simulations are performed for solver validation. Three different structured grids containing up to 1.6 millions of hexahedral cells are considered. A near wall distance of y+
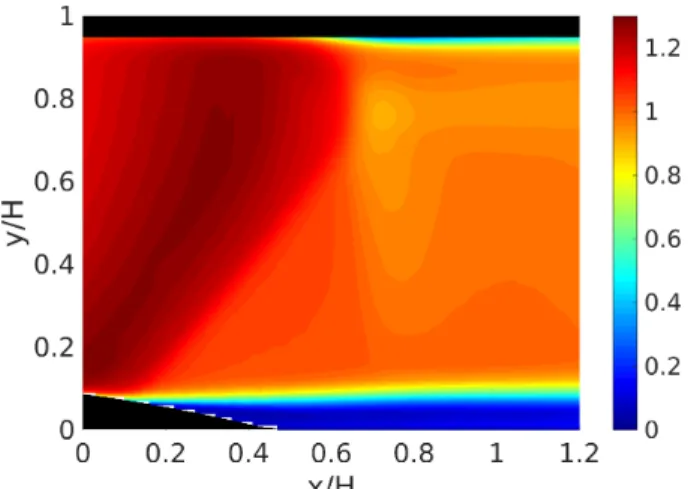
∼ 20 is maintained. Adiabatic walls are considered and a wall function, described by Menter and Esch (2001), is used. At the inlet, the total pressure and total temper-ature are set to 95000 Pa and 300 K. At the outlet, a static pressure of 61000 Pa is imposed in order to model the effect of the adjustable throat in the experiment (D´elery et al., 1978). For example, for the medium grid containing 0.8 millions of nodes, the mean Mach field is repre-sented in Figure 2. The lambda shock pattern observed experimentally is recovered. The mean fields, notably in terms of maximum Mach number in the domain and shock location, are found to be in good agreement with the experimental results (D´elery et al., 1978).
Figure 2: Mean Mach number field for the medium grid.
experimental results, respectively. The present solver seems therefore suitable to study high speed, compressible fluid, flows like the flow in a high pressure turbine nozzle guide vane. High pressure turbine nozzle guide vane
Experimental setup
Experiments were conducted by Yasa et al. (2010) to characterize the aerodynamic losses occurring in a High Pressure Turbine Nozzle Guide Vane (HPT-NGV) cascade. The experi-ments were conducted in an annular sector test rig for sub-sonic and transonic off-design con-ditions. A detailed description of the test rig facility can be found in Saha (2014). The facility consists of an annular sector with a 36 degrees opening, containing five airfoils. All flow field measurements were recorded around the central airfoil in order to avoid influences from the side walls. The axial chord of an airfoil, Cax, is used to indicate the position of the various
mea-surement planes. In this study, the data for transonic off-design conditions are the blade loading on the central airfoil at mid-height, on the pressure and suction sides (pneumatic pressure taps), a circumferential static pressure distribution 0.4Cax downstream from the cascade (pressure
taps), and a total pressure measurements in the wake 0.071Caxand 0.48Cax downstream from
the cascade (calibrated 5-hole probes) (Yasa et al., 2010). Numerical setup
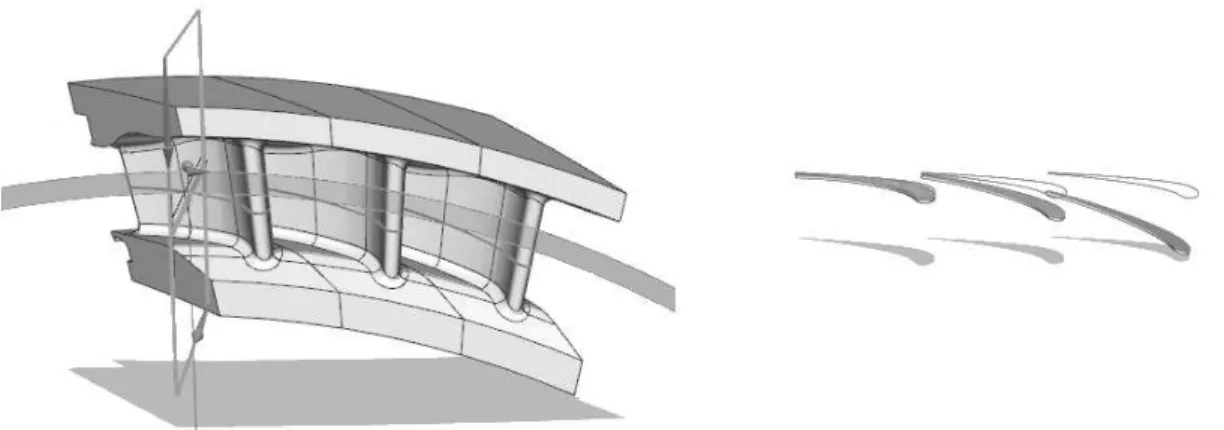
A full 3-D simulation of the six blades in the cascade is avoided by considering periodicity of the flow in the circumferential direction, reported in the central vanes of the cascade (Yasa et al., 2010). A further approximation in the design of the computational domain is made by considering a 2-D linear cascade representation of the the 3-D annular sector. This approxima-tion can be made when the height of the annulus enclosing the guide vanes is small compared to the inner radius of the cascade (Atassi et al., 2006). In the present cascade the annulus height is an order of magnitude lower than the inner radius, justifying the process of unwrapping the sector cascade to a linear cascade. The associated CAD work is illustrated in Figure 3.
Figure 3: 3-D representation of three airfoils in the annular cascade (left) and unwrapping process (right).
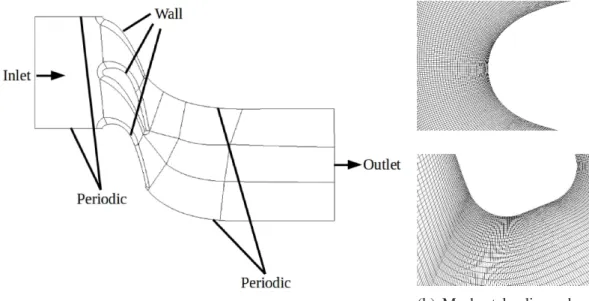
The linear cascade obtained is enclosed in a computational domain shown in Figure 4(a). Block-structured grids are used in order to accurately capture the flow gradients, with the cell faces aligned with the flow. The mesh topology is added in Figure 4(a) in order to see the
blocking structure. For the grid, the near wall distance is set to y+
∼ 20 and the the cell aspect ratio at the wall is kept below 35, yielding a 2-D grid containing 550000 hexahedral cells. Two views of the final mesh are represented in figure 4(b), close to the leading and the trailing edges. For the 3-D LES, the 2-D domain was extruded in the transverse direction across 30 planes, yielding a 3-D grid containing 16.5 millions of tetrahedral nodes. The distance between each of the transverse planes is maintained below the taylor micro-scale. Periodic boundary conditions are applied at the extruded faces to model a channel of infinite width. As for the transonic channel, adiabatic walls are considered and a wall function, described by Menter and Esch (2001), is used. Periodic boundary conditions are used on the lateral boundaries to simulate an infinite linear cascade. It can moreover be noted that the blocking strategy is not perfectly symmetric downstream of the blade, leading the need to use an interpolation algorithm before applying the periodic boundary. It has therefore be chosen to simulate two blade passages in order to have one entire passage solved with the best accuracy possible. Finally, sponge zones with grid stretching are used near the inlet and the outlet boundaries in order to avoid spurious reflections.
At the inlet, a total pressure of P01 = 187100Pa and a total temperature of T01= 305K are
imposed and the flow is considered perpendicular to the inlet boundary. At the outlet, the face averaged static pressure is maintained at P2 = 104370Pa. Those conditions correspond to the
experimental transonic off-design conditions (Yasa et al., 2010).
(a) Structure of the blocks and boundary conditions.
(b) Mesh at leading edge (top) and trailing edge (bottom).
Figure 4: Mesh properties.
Results
A 2-D compressible URANS simulation is performed first. The results are then used to initialize the 3-D LES. For the latter simulation, Figure 5 illustrates the instantaneous Mach number field at mid-span. A subsonic acceleration is noticed up to the throat of the passage, following by Prandtl-Meyer expansion waves which accelerate the supersonic flow up to a Mach of 1.1 at around 0.70Cax. A normal shock then decelerates the flow to just below sonic speed.
Strong interactions between the shock and the vane wake are observed.
Figure 5: Snapshot of the Mach number at mid-span for the 3-D LES.
(a) Mean static pressure field for the 3-D LES.
0 0.2 0.4 0.6 0.8 1 x/C ax 0 0.2 0.4 0.6 0.8 1 1.2 Mis 0 0.5 1 1.5 2 2.5 Vane Phase 0.8 0.85 0.9 0.95 1 1.05 1.1 Mis
(b) Isentropic Mach number (top) at pres-sure and suction sides and (bottom) at 0.4Cax
downstream from the cascade. • Experimental results, −− 2-D URANS results and — 3-D LES results.
Figure 6: Mean pressure field and isentropic Mach number.
the 3-D LES computation is presented in Figure 6(a). The isentropic Mach number along the blade is shown at the top of Figure 6(b) as a function of the axial normalized coordinate. On the pressure side, a very good agreement is visible between simulation results and experimental ones. Indeed, both predict the monotonous pressure drop with the axial distance. On the suction side, the loading involves several distinct flow regions. First, a continuous subsonic expansion is observed up to the throat of the vane. Then, a supersonic expansion is observed, increasing the flow Mach number. Finally, a normal shock placed at around 0.70Cax lowers the flow
speed to just below the sonic limit. The 2-D URANS results follow experimental data closely up to the throat, and small differences are observed in the divergent section of the passage. The 3-D LES results deviate slightly from experimental ones in the convergent section of the passage, while following the experimental results closely in the divergent section. Notably, in the two simulations, the simulated normal shock is placed at the same location as in the experiment. At the bottom of Figure 6(b), the isentropic Mach number at a plane located 0.4Cax
downstream from the cascade is plotted against the circumferential vane phase. The simulation results agree with the experimental results. Moreover, the 3-D LES results seems to follow better the experimental results compared to the 2-D URANS results. However, the 3-D LES results are not exactly periodic. This is due to a physical simulation time lower for the 3-D LES compared to the 2-D URANS, leading to less converged mean static pressure fields.
(a) Mean total pressure field for the 3-D LES.
-0.2 0 0.2 0.4 0.6 Vane phase 0.8 0.85 0.9 0.95 1 1.05 p 0 /p 01 -0.5 0 0.5 Vane phase 0.8 0.85 0.9 0.95 1 1.05 p 0 /p 01
(b) Total pressure in the wake at 0.071Cax
(top) and 0.48Cax (bottom) downstream from
the cascade. • Experimental results, −− 2-D URANS results and — 3-D LES results.
Figure 7: Mean total pressure field normalized by the inlet total pressure P01.
distribution normalized against the inlet total pressure and plotted against the circumferential vane phase at two downstream planes. The wake is increasing in its extent further downstream from the vane trailing edge. Further, due to extensive mixing at the wake shear layers, the total pressure losses are greatly reduced downstream from the trailing edge of the vane. In general, a good agreement of the LES and URANS computations with experimental results is observed, in terms of the wake width and maximum total pressure losses.
Overall, a good agreement with experiments is reached for the 2-D URANS and 3-D LES computations. This result justifies the linear cascade hypothesis to predict the flow field near the central region of the NGV. The 3-D LES setup can therefore be used to study indirect combustion noise.
INDIRECT COMBUSTION NOISE
The largest noise disturbances for commercial, subsonic aeroplanes with turbofan engines occur at take-off and traditionally have been linked with jet noise and fan noise. Reduction of those sources has been the main focus, so far, of aero-engine noise research. Significant jet noise reductions have been achieved by increasing the bypass ratio, together with more subtle changes such as using serrated nozzle lips (i.e. chevrons). Moreover, fan noise has been reduced by several advances in innovative fan blade design. Naturally, with the sustained reduction of those noise components, the relative importance of other noise sources has increased and to-day one must address several other sources in order to reach the new noise reduction targets. For modern aero-engines, one of the dominant noise source and the least studied is combustion noise. Besides, in order to reduce NOx emissions (Schildmacher et al., 2007), lean pre-mixed combustion has been introduced in modern aero-engines. However, lean combustion gener-ates low frequency entropy perturbations which are convected dowstream, in the combustion chamber. On one hand, the entropy perturbations have associated density fluctuations at the flame. Those density fluctuations then propagate through the engine as acoustic waves (Duran et al., 2014). This is the direct noise generation mechanism. On the other hand, the entropy waves, under the influence of a strong velocity gradient in the high pressure turbine, act as an acoustic source (Marble and Candel, 1977). The acoustic waves thus generated constitute indirect combustion noise. Under transonic flow conditions, it has been reported that indirect combustion noise is one order of magnitude higher than direct combustion noise (Leyko et al., 2009). Moreover, Motheau et al. (2014) show that indirect combustion noise propagated in the upstream direction can impact the thermoacoustic behavior of the combustion chamber. Finally, Papadogiannis et al. (2016) show that most of the indirect combustion noise is radiated from the stator stage because the distorted entropy perturbations are transmitted less effectively through the subsequent rotor stages. This result enforces the choice of the present work to study a single stator stage.
Fluctuating temperature at the inlet
In this work, instead of simulating the realistic flame dynamics, we simulate the flow through the cascade with a low frequency sinusoidal entropy packet introduced at the inlet to study indirect combustion noise. Similar simulations have already been conducted by Papado-giannis et al. (2016). The frequency of the forcing is equal to 2200 Hz, yielding a corresponding wavelength equal to 0.4Cax and its amplitude is set to 15 K. Those parameters are similar to
those used in Papadogiannis et al. (2016). The frequency of 2200Hz is one order of magnitude higher that a realistic low frequency combustor noise, around 100Hz. However, Papadogiannis
et al. (2016) found that this frequency was approximately the limit of the validity of the compact theory of Cumpsty and Marble (1977) for 2-D configurations. Thus, at this frequency, the same noise production mechanisms should arise.
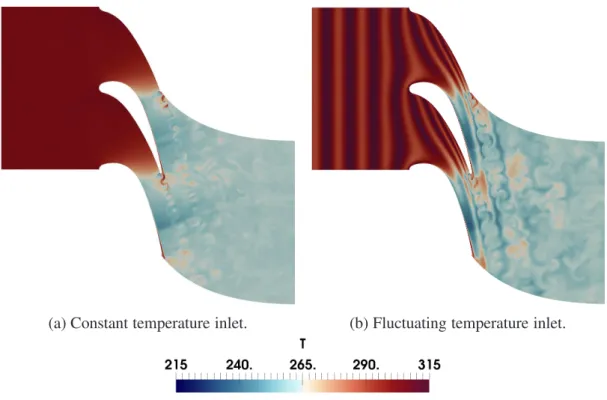
Two 3-D LES simulations have been conducted, with and without fluctuating temperature inlet. Snapshots of the temperature in the mid-span plane are represented in Figure 8. In Fig-ure 8(a), the case with a constant temperatFig-ure inlet is displayed. Expansion waves at the throat and a normal shock at around 0.70Cax are visible. The vortex shedding from the trailing edge
can also be seen. The case with a fluctuating temperature inlet is displayed in Figure 8(b). The temperature field reveals the forcing imposed at the inlet, with vertical stripes. As those entropy waves approach the airfoil, they get distorted by the accelerating flow in the vane, becoming aligned with the flow field at the end of the vane. An interaction between those entropy waves and the vortex shedding is then observed. On one hand, the entropy waves seem to be affected by the vortex shedding, with a loss of organization of the wave as it passes through the vor-tex shedding. This interaction may explain why entropy waves are transmitted less effectively through the subsequent rotor stages, as observed by Papadogiannis et al. (2016). On the other hand, the vortex shedding seems affected by the presence of those entropy waves, with a thicker and amplified vortex shedding pattern compared to the case with a constant temperature inlet.
(a) Constant temperature inlet. (b) Fluctuating temperature inlet.
Figure 8: Snapshots of the temperature at mid-span.
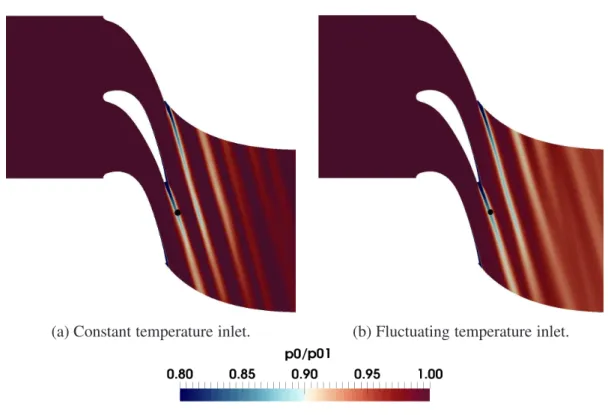
In order to see the influence of the inlet forcing on the flow fields, the mean total pressure fields are represented in Figure 9 for the two 3-D LES. For the case of a fluctuating temperature inlet, the thicker and amplified vortex shedding pattern leads to bigger levels of turbulence in the wake, and thus to higher losses compared to the case with a constant temperature inlet. Moreover, in the case of a fluctuating temperature inlet, the animation corresponding to Figure 8 permits to visualize a periodic earlier detachment of the boundary layer on the suction side, at the inlet forcing frequency. This earlier detachment leads to an overall lower deviation of the flow through the HPT-NGV, as it can be observed in Figure 9.
(a) Constant temperature inlet. (b) Fluctuating temperature inlet.
Figure 9: Mean total pressure fields normalized by the inlet total pressure P01at mid-span.
The vortex shedding frequency is studied by looking at velocity spectra in the wake, at the point represented in Figure 9 by a black dot. This point is localized downstream of the blade, in the wake. The vertical velocity uy is considered, as it is the velocity component with the biggest
amplitude at this location. The spectra are represented in Figure 10 as functions of the Strouhal number where the length scale is the trailing edge diameter D = 0.0022m and the velocity scale is chosen equal to the exit mach number of 0.95, as it can be observed at the bottom of Figure 6(b). 10-2 10-1 St 0 10 20 30 40 50 60 PSD(U y )
Figure 10: Velocity spectra at a point downstream of the blade, in the wake; — constant temperature inlet and—fluctuating temperature inlet.
A strong peak corresponding to the vortex shedding frequency can be observed at a Strouhal number St = 0.14, corresponding to a frequency of 19.5kHz. This frequency is in excellent agreement with the experimental Strouhal frequency of 19.7kHz found for those operating con-ditions with a fast response Kulite probe (Yasa et al., 2010). Finally, it can be observed that
the peak amplitude is 3dB higher for the case with fluctuating temperature inlet compared to the case with constant temperature inlet, confirming the amplification of the vortex shedding mechanism observed in Figure 8.
CONCLUSIONS
The new solver used in this work is successfully attested against the 1-D Sod’s shock tube. Notably, the predicted traveling wave speeds are in good agreement with analytical results. Fol-lowing this, the transonic flow within the ONERA S8 channel is simulated. 2-D compressible URANS simulations are able to predict the occurrence of the lambda shock structure. Finally, the solver is used to simulate the flow within the passages of the High Pressure Turbine Nozzle Guide Vane. 2-D URANS and 3-D LES are performed and a good agreement with experiments is reached for both simulations. This result justifies the linear cascade hypothesis to predict the flow field near the central region of the NGV. Finally, a fluctuating temperature inlet, simulat-ing planar entropy perturbations from the combustion chamber, is imposed in order to study indirect combustion noise. The influence of this forcing on the vortex shedding dynamics are sought. Notably, the frequency of the vortex shedding does not change but the vortex shedding pattern is amplified and becomes thicker compared to the case with a constant temperature inlet. In the future, spectra of temperature and pressure will be presented and several decomposition techniques will be applied to the flow variables in order to analyze the production mechanism of indirect combustion noise. Moreover, a study of the influence of the frequency will be per-formed in order to see how the frequency influence the production mechanism of the indirect combustion noise.
ACKNOWLEDGEMENTS
We would like to acknowledge M.Sc. students Asuka Gabriele Pietroniro and Alessandro Ceci for performing the CAD work and installing the solver. We also acknowledge PDC staff at KTH and the Department of Mechanics for providing access to computing facilities.
REFERENCES
Anderson, J. (1990). Modern compressible flow: with historical perspective, volume 12. McGraw-Hill New York.
Atassi, H., Ali, A., and Atassi, O. (2006). Interaction of acoustic and vortical disturbances with an annular cascade in a swirling flow. In Unsteady Aerodynamics, Aeroacoustics and
Aeroelasticity of Turbomachines, pages 247–259.
Blazek, J. (2015). Computational fluid dynamics: principles and applications. Butterworth-Heinemann.
Cumpsty, N. and Marble, F. (1977). The interaction of entropy fluctuations with turbine blade rows; a mechanism of turbojet engine noise. 357, (1690):323–344.
De Villiers, E. (2007). The potential of large eddy simulation for the modelling of wall bounded flows. PhD thesis, Imperial College of Science, Technology and Medicine.
D´elery, J., Copy, C., and Reisz, J. (1978). Analyse au v´elocim`etre laser bidirectionnel d’une interaction choc-couche limite turbulente avec d´ecollement ´etendu. Rapport Technique, (37/7078).
Duran, I., Moreau, S., Nicoud, F., Livebardon, T., Bouty, E., and Poinsot, T. (2014). Combustion noise in modern aero-engines. AerospaceLab, pages 1–11.
Leyko, M., Nicoud, F., Moreau, S., and Poinsot, T. (2009). Numerical and analytical investiga-tion of the indirect combusinvestiga-tion noise in a nozzle. C. R. Mecanique, 337(6):415–425.
Marble, F. and Candel, S. (1977). Acoustic disturbance from gas non-uniformities convected through a nozzle. J. Sound. Vib., 55(2):225–243.
Menter, F. and Esch, T. (2001). Elements of industrial heat transfer predictions. In 16th
Brazil-ian Congress of Mechanical Engineering, pages 26–30.
Motheau, E., Nicoud, F., and Poinsot, T. (2014). Mixed acoustic–entropy combustion instabili-ties in gas turbines. J. Fluid Mech., 749:542–576.
Papadogiannis, D., Wang, G., Moreau, S., Duchaine, F., Gicquel, L., and Nicoud, F. (2016). Assessment of the indirect combustion noise generated in a transonic high-pressure turbine stage. J. Eng. Gas Turbines Power, 138(4):041503.
Pope, S. (2001). Turbulent flows.
Rusche, H., Jasak, H., and Sunjo, K. (2014). Coupled density-based solver for high-speed compressible flows. 9th OpenFOAM Workshop.
Saha, R. (2014). Aerodynamic investigation of leading edge contouring and external cooling on a transonic turbine vane. PhD thesis, KTH Royal Institute of Technology.
Schildmacher, K., Hoffmann, A., Selle, L., Koch, R., Schulz, C., Bauer, H., Poinsot, T., Krebs, W., and Prade, B. (2007). Unsteady flame and flow field interaction of a premixed model gas turbine burner. P. Combust. Inst, 31(2):3197–3205.
Sod, G. (1978). A survey of several finite difference methods for systems of nonlinear hyper-bolic conservation laws. J. Comput. Phys., 27(1):1–31.
Yasa, T., Paniagua, G., Fridh, J., and Vogt, D. (2010). Performance of a nozzle guide vane in subsonic and transonic regimes tested in an annular sector. In ASME Turbo Expo 2010, pages 1457–1467.