SIZE AND TEMPERATURE-DEPENDENT VARIATIONS IN INTERMOLT DURATION AND 1
SIZE INCREMENT AT MOLT OF NORTHERN SHRIMP, PANDALUS BOREALIS 2 3 DOUNIA DAOUD a, b, c* , YVAN LAMBERT b , CELINE AUDET a , DENIS CHABOT b 4 5 6 a
Institut des Sciences de la Mer de Rimouski, Univers 7
8
b
Fisheries and Oceans Canada, Institut Maurice-Lamontagne, 850 route de la mer, Mont-9
Canada, G5H 3Z4 10
c
Shippagan (N.-B.), Canada, E8S 1J2 11
12
* Corresponding author. Tel.: +1-506-336 6618; fax: +1-506-336 6601. E-mail address: 13
dounia.daoud@irzc.umcs.ca 14
*Manuscript
INTRODUCTION 15
16
Northern shrimp (Pandalus borealis), a commercially important species in Canadian waters, is a 17
cold-water decapod widely distributed in the Northwest Atlantic and in the North Pacific . 18
It is a protandric hermaphrodite species; each individual first matures and functions as a male, goes through 19
a transition phase, and becomes a female. Along the latitudinal gradient extending from the Gulf of Maine 20
to the Davis Strait, shrimp populations differ in abundance and in several life history traits (Apollonio et al. 21
1986; Lysy and Dvinina 1991; Anderson 1999; Anderson and Piatt 1999; Koeller 2000). Longevity, length 22
at sex change, and maximum length of males and females increase with latitude while growth rate and 23
proportion of spawning females relative to non-spawning females decrease. Although some results may 24
contradict this general observation (Koeller 2006), temperature appears to play a major role in structuring 25
these populations through its influence on growth patterns, length at sex change, and ovigerous period 26
which are all interrelated. These important latitudinal changes suggest future potential effects of climate 27
changes on shrimp population dynamics (Koeller et al. 2009). 28
Growth in crustaceans is characterized by a succession of molts (ecdycis) separated by intermolt 29
periods (IP), with each of these two phases often exhibiting very different responses to intrinsic and 30
extrinsic factors (Hartnoll 1982). Size and temperature are generally seen as the most important parameters 31
influencing IP and molt increment (MI) (Kinne 1970; Hartnoll 1982). Usually, small individuals molt more 32
frequently (Benayoun and Fowler 1980) and have larger relative MI than larger individuals of the same 33
species (Hartnoll 1982). Temperature or seasonal fluctuations in temperature directly influence IP but 34
temperature effect on MI is less predictable (Comeau and Savoie 2001; Hartnoll 2001). In most studies, MI 35
was weakly or not influenced by temperature (Hartnoll 1982; Iguchi and Ikeda 1995; Hart 2001; Sudo 36
2003). However, decreases and increases in MI with increasing temperatures have been observed in 37
different species (Paglianti and Gherardi 2004; Kulmiye and Mavuti 2005). 38
Different population and growth models have been developed for the study of shrimp population 39
dynamics . However, no systematic study of the growth characteristics (IP 40
and MI) of post-larval stages of P. borealis has been conducted in relation to important influential factors. 41
Moreover, the absence of anatomical permanent structures that can be used to estimate age results in 42
uncertainties in age determination (i.e. growth) in shrimp, especially for older developmental stages 43
(Apollonio et al. 1986; Savard et al. 1994; Aschan 2000; Hansen and Aschan 2000). 44
The development of growth models relies on precise measurements of both IP and MI at the 45
individual level, which are hardly obtainable in natural environment. Experimental work may represent the 46
best approach to develop models based on these two components, which characterize crustacean growth. 47
For example, the growth rate of Antarctic krill, Euphausia superba, obtained from the measurement of IP 48
and growth increment at molt in controlled experiments was central to the development of growth models 49
in relation to sex, length and temperature for this species (Kawaguchi et al. 2006; Tarling et al. 2006). In 50
the present study, laboratory experiments were used to measure growth of captive northern shrimp in 51
relation to temperature. Growth of juveniles, males and females was assessed as ontogenetic changes in the 52
distribution and vertical migration range influence the range of temperatures encountered by the different 53
developmental stages of a population (Shumway et al. 1985). Growth characteristics, including IP, MI in 54
size and mass, and tissue mass allocation in juvenile, male, and female shrimp were evaluated at three 55
P. borealis is commonly found
56
in Canadian waters. Predicted growth based on IP and MI at different temperatures was also compared to 57
the growth of northern shrimp populations found in different temperature regimes. 58
59
MATERIAL AND METHODS 60
61
Shrimp capture and rearing conditions 62
63
Growth experiments were conducted at the aquaculture facilities of the Maurice Lamontagne 64
Institute (Fisheries and Oceans Canada, Mont- tween 2002 and 2005. Adult shrimp (15-30 65
mm in cephalothorax length, CL) were caught using a rigid frame trawl in the St. Lawrence Estuary (80-66
160 m depth) near Rimouski ( each year between 2001 and 2003. Following capture, 67
shrimp were transported to the MLI and kept in 670 l rectangular tanks under natural photoperiod at a 68
temperature of 5 69
were caught in the spring of 2003 (April). They were maintained in stabulation until all females had 70
released their larvae. In mid-July of 2003, male and non-ovigerous female shrimp were randomly assigned 71
and acclimated to tanks that were gradually adjusted to the three experimental temperature treatments (2, 5, 72
and 8 ). The experiment began in August 2003. Shrimp were fed ad libitum three times a week with a 73
diet consisting of equal parts of finely chopped Atlantic and Pacific krill, capelin and shrimp. Remaining 74
food was cleaned before each feeding period. 75
Juveniles used in the experiments were raised in the laboratory. Ovigerous females caught in the 76
St. Lawrence Estuary in the fall of 2002 and spring of 2003 and 2004 were isolated in May of 2003 and 77
2004 in tanks until hatching of the larvae. Larvae were kept in 80 l plankton-Kreisel tanks (Aiken and 78
Waddy 1989) ad libitum with live brine shrimp nauplii (Artemia salinas) until they reached
79
juvenile stages. Juveniles (4-12 mm CL) were then randomly assigned to 80 l Kreisel tanks adjusted to the 80
81
experiment on juveniles in their second year of live began in June 2004 and the one on juveniles in their 82
first year of life in March 2005. Juveniles were fed three to five times a week depending on their age, using 83
the same diet as for the adults. Remaining food was cleaned before each feeding period. 84
85
Experimental setup 86
87
Experiments were conducted in 3 recirculated seawater tanks (1340 l); one for each of the three 88
experimental temperatures. Each tank had a head tank with a capacity of 125 l, a sand filter and a heat 89
pump to regulate water temperature. Seawater flow to the tank was ~ 30 l min-1
, whereas new seawater 90
flow to the head tank was ~ 2.5 l min-1(100% of seawater renewed every 10h). Experiments with juveniles 91
(8-12 mm CL) and adults were conducted in compartmentalized baskets immersed in the tanks in order to 92
follow individual shrimp. Compartments used for juveniles (8-12 mm CL) were 16.5 x 12 x 10 cm while 93
those for adults were 35 x 30 x 35 cm. Vertical tray incubators connected to the seawater systems were 94
used for the experiments with smaller juveniles in the 4-8 mm CL size range. Each incubator had 8 trays 95
divided in 9 compartments (13 x 10 x 5.5 cm). Seawater inlet in tanks, baskets and compartments were 96
designed (openings and netting) and positioned to provide a uniform water circulation. Compartments were 97
used essentially to monitor individual shrimp. All statistical analyses were based on individual shrimp as 98
the experimental unit. 99
Two to four adults individually identified with a Visual Implant Tag (Northwest Marine 100
Technology, Shaw Island, Washington) fixed to the cephalothorax were placed together in each 101
compartment. Although tags were lost at molting, the low number of shrimp per compartment allowed 102
individual identification and post-molt 103
number were noted when shrimp were introduced in the compartments. Experiments with juveniles were 104
conducted with only one specimen per compartment. No manipulations (tagging and measurements) were 105
made on live juveniles. All shrimp were fed in excess during the experiments with the diet previously 106
described. 107
Between 2003 and 2005, IP, CL and mass increments as well as the distribution of total mass 108
between the different tissues (hepatopancreas, muscle, gonads, and remaining tissues, mostly carapace, 109
collectively referred to as carcass) were measured for juvenile and adult shirmp during a molt cycle. 110
-22 mm CL; n=70) and females 111
(21-27 mm CL; n=45) and for juveniles in their first (5-8 mm CL; n = 69) and second (7-11 mm CL; n = 112
41) year of life. 113
A sample of juvenile and adult shrimp was taken in order to determine initial CL-mass 114
relationships and initial relative contribution of tissue masses (hepatopancreas, muscle, gonad, and carcass) 115
to the total mass of shrimp. For this group representing initial conditions, adults were randomly selected 116
from each tank at all temperatures (total n = 135) prior to the beginning of the experiment (i.e. transfer of 117
shrimp into compartments). Juveniles (total n = 58) of the initial sample were individually raised at each 118
temperature and euthanized 15 days after the first molt that occurred in the compartments. CL, M, and 119
tissue masses were noted for juveniles with CL > 8 mm while CL and M only were noted for smaller 120
121
for juveniles (video camera [SPOT INSIGHT V 3.2] mounted on a stereomicroscope [WILD 122
HEERBRUGG] and connected to a frame grabber, used together with image analysis software [Image-Pro 123
Plus, ver. 4.1.1.2]). 124
Compartments were checked daily for molts. At the first ecdysis, the exuvia was discarded and the 125
date noted as the starting time of the IP of interest. Adults were weighed 15 days following the first ecdysis 126
(premolt mass for determination of the growth in mass between two molts). Premolt mass of juveniles was 127
not measured directly to minimize the influence of manipulations on growth performance, considering the 128
shorter IP in juveniles. Following the second ecdysis, the exuvia was recovered, measured, and the size was 129
used as premolt CL. Initial M of juveniles was estimated from their premolt CL, using the relationship 130
between CL and M obtained from the initial group sampled at the start of the experiment. Juveniles and 131
adults were killed and dissected 15 days after the second ecdysis. For each shrimp, final CL, M, as well as 132
muscle, hepatopancreas, gonad and carcass masses were measured. The only exception was for juveniles in 133
the 4-8 mm CL range for which only CL and M were measured. 134
135
Data calculation and statistical analyses 136
137
IP was defined as the duration in days between two successive molts. 138
The relative size increment at molt (MIS) was calculated as:
139
MIS= 100 x (CL2-CL1) / CL1
140
where CL1and CL2are the premolt and postmolt CL, respectively.
141
The relative mass increment at molt (MIM) was calculated as.
142
MIM= 100 x (M2-M1) / M1
143
where M1 and M2are the pre-molt and post-molt values of total mass, obtained 15 days following
144
the first and second ecdysis, respectively. M1 was measured directly in adults and estimated for juveniles
145
with the M-CL relationship of the initial juvenile group. 146
The specific growth rate (Ricker 1975) in size (SGRS) and mass (SGRM) were also calculated as:
147
SGRS= (logCL2-logCL1) / IP
SGRM= (logM2-logM1) / IP
149
The distribution of total mass in the different tissues was examined by calculating relative mass 150
indices as described in Brillon et al. (2005). Hepatopancreas (HSI), muscle (MSI), gonads (GSI) and 151
carcass (CSI) masses were expressed as percentage of somatic mass (total mass less the mass of the 152
gonads). 153
Values of IP, MI, SGR and relative tissue mass indices (HSI, MSI, GSI and CSI) were compared 154
between temperatures and developmental stages (juvenile, male, and female) using 2-way ANOVA with 155
(Sokal and Rohlf 1995). When the interaction was 156
significant, the comparisons of adjusted means that were of interest (i.e. stages at each temperature and 157
temperatures at each stage, 18 comparisons) were done by a series of one-degree-of-freedom tests (t-test), 158
and the significance level was adjusted for the number of comparisons of interest (critical value = 0.0028 159
((1-0.95)1/18
) according to the Dunn- (Sokal and Rohlf 1995). Graphical examination of the 160
data and Brown-Forsythe tests were used to examine homogeneity of variances. When normality of data 161
and homogeneity of variances were not met, ANOVA were performed on log-transformed, square root-162
transformed or rank-transformed data (Quinn and Keough 2002). If these transformations were not 163
sufficient to meet the criteria for an ANOVA, separate 1-way ANOVAs were performed for each stage to 164
compare the three temperatures. In this case, the criteria for an ANOVA were met after log-165
transformations. 166
Regression analysis was used to estimate IP and MISin relation to pre-molt size (CL in mm) and
167
temperature. Multiple regression models were used to predict the evolution of size at age at fixed 168
temperatures of 2, 5, and 8o
C. Mean size at age (CL) with confidence intervals for each temperature were 169
generated with a Monte Carlo analysis using 1000 iterations of random values from a normal distribution of 170
the parameter estimates of the regression models (parameter esti S. The
171
projections of size at age began with age 1. The starting values for sizes at age 1 at each temperature were 172
173
2, 5, an 174
reached sizes of approximately 21-23 mm in the last quarter of the year (Skuladottir et al. 2005; Koeller 175
2006). At the female stage, the ovigerous period was taken into account by setting spawning time between 176
day of the year 200 and 250 (Koeller et al. 2009) and using as IP, the duration of the ovigerous period at the 177
different temperatures. The duration of the ovigerous period was fixed at 236, 177, and 135 days at 2, 5, 178
and 8 (Brillon et al. 2005).
179
Finally, estimations of sizes at age for populations of northern shrimp in different locations and 180
subjected to variable bottom temperatures were compared to the projections of size at age obtained from the 181
multiple regressions models for IP and MIS. Age, which is usually based on hatching date in the different
182
populations, was standardized using January 1st
as starting date. 183
All statistical analyses were carried out with SAS software (SAS Institute version 8.2, Cary, NC). 184
Monte Carlo analyses were done using PopTools, an add-in tool for PC versions of Microsoft Excel 185
downloadable from: http://www.cse.csiro.au/poptools/. 186
187
RESULTS 188
189
Growth in size and mass during a molt cycle 190
191
For each developmental stage, mean initial CL was similar (1-192
temperatures (Table 1). Mean initial mass of male and female shrimp was also identical (1-way ANOVA, p 193
194
obtained from the following relationship between initial CL (range = 6.17 9.01 mm) and M : 195
Log (M) = -3.103 + 2.882 Log (CL) 196
Significant effects of temperature and developmental stage on IP and MI were observed for shrimp 197
monitored during a complete molt cycle. IP was influenced by both temperature and developmental stage 198
and the interaction was significant (2-way ANOVA, Temp x Stage, F4, 219 = 8.68, p < 0.0001). IP
199
significantly decreased with increasing temperature for juveniles, males, and females (Fig. 1). Pairwise 200
comparisons for each developmental stage indicated significant differences between each temperature (p < 201
-202 Sidak test; p = 203 -204
iles, differences in IP were less 205
206
identical for males and females at the 3 temperatures (p > 0.33) but approximately twice as long as in 207
juveniles for each temperature (Pairwise comparisons p < 0.0001). 208
Increases in CL and M at the 3 temperatures were different for juveniles, males, and females (Fig. 209
2) with significant interactions between developmental stage and temperature for both CL and M (2-way 210
ANOVA, MIS: F4, 164= 2.48, p < 0.05; MIM: F4, 164= 7.10, p < 0.0001). Mean MISranged between 3.5 and
211
5.3% for juveniles and males without any significant effect of temperature. In females, MIS ranged between
212
1.4 and 3.7% and was significantly lower at 213
significant increase in MIM from 18.6 to 27.2% was observed for juvenile shrimp raised at temperatures
214
M ranged between 3.9 and 7.7% with a
215
s Mwas lower (1.1 to 4.2%) and
216
not different between temperatures (p > 0.016) (Fig. 2). No difference in MIS was observed between
217
Swas lower in
218
females than in juveniles and males (p < 0.0023). At each temperature, MIM differed between
219
developmental stages (pairwise comparisons: p < 0.0001) with the exception of males and females which 220
had similar MIS
221
Specific growth rate obtained from CL and mass increments at molt and IP were used to describe 222
the combined effects of these two components of growth. There was a significant interaction between 223
temperature and developmental stage for both SGRS and SGRM (2-way ANOVA, Temp x Stage, F4, 164 =
224
2.91 and 26.64, p < 0.05 and 0.0001, respectively). In juvenile shrimp, both SGRS and SGRM increased
225
with temperature (Fig. 3) with significant differences between each of the three temperatures (pairwise 226
comparisons: p < 0.0001). In males, a significant increase in SGRS
227
0.0015). However, no difference in SGRS
228
detected (Fig. 3). SGRMfor males was similar at the 3 temperatures (p > 0.02), whereas SGRS and SGRM
for females were not influenced by temperature (p > 0.0068). At each temperature, SGRSand SGRM were
230
also significantly higher in juveniles than in adults (p < 0.0003). 231
Hepatopancreas, muscle and carcass masses constituted 5.8-8.3%, 34.7-43.7% and 43.4-50.5% of 232
the shrimp mass, respectively (Table 2). Gonad mass represented less than 0.3-0.4% of male mass while 233
female GSI ranged between 1 and 2.6% at the beginning of the experiment and was below 0.8% at the end 234
of the experiment. 235
Analysis of variance on the different tissue masses indicated significant interactions between 236
temperature and developmental stages for initial HSI (2-way ANOVA, Temp x Stage, F4, 182= 2.43, p <
237
0.05), initial CSI (F4, 179 = 2.99, p < 0.03), final MSI (F4, 106 = 3.85, p < 0.006), and final CSI (Temp x
238
Stage, F4, 105 = 7.28, p < 0.0001). Thus, a posteriori comparisons were conducted among temperatures at
239
each developmental stage and among stages for each temperature for these variables. Initial HSI differed 240
241
than in juveniles at each temperature (p < 0.001) (Table 2). Initial MSI was not different between 242
temperatures (2-way ANOVA, F2, 182= 2.46, p > 0.08) but was significantly influenced by developmental
243
stage (2-way ANOVA, F2, 182= 248.96, p < 0.0001) with MSI being lower in juveniles than in adults. Initial
244
CSI only differed between temperatures fo 245
246
higher in juveniles than in adults (p < 0.0001). Initial GSI for adult shrimp was significantly influenced by 247
sex (2-way ANOVA, F1, 128= 424.32, p < 0.0001) with initial female GSI being 3.3 to 7.8 times higher than
248
in males at the different temperatures (Table 2). 249
At the end of the experiment, HSI was similar across temperatures and developmental stages (2-250
way ANOVA, p > 0.76). Some differences were observed in final MSI and final CSI. However, no 251
significant distinct pattern associated with either temperature or developmental stage was detected. Final 252
GSI in males decreased with temperature (1-way ANOVA, F2,46 = 4.27, p = 0.02) with a significant
253 -way ANOVA, F2,34= 254 255 0.016). 256
257
Growth models 258
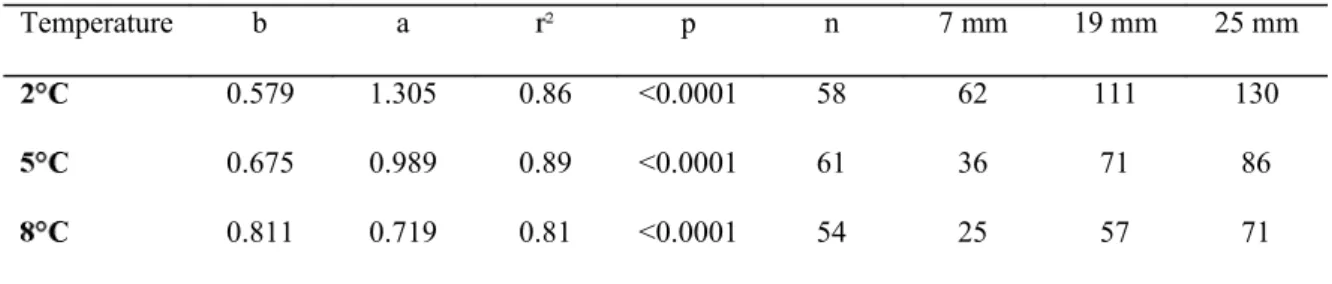
Significant relationships were observed between intermolt duration and shrimp size at the 3 259
temperatures (Fig. 4). The slopes of the regressions on log transformed data differed between all 260
temperatures (p>0.0001), the steepness of slopes increasing with temperature (Table 3). Comparisons of 261
262
-induced differences in IP were proportionally 263
greater for smaller shrimp. While a 2.5 fold difference in IP was observed in juvenile shrimp (7 mm CL) 264
265
multiple regression model using size (i.e. pre-molt CL) and temperature as dependent variables explained 266
87% of the variability in intermolt duration (Table 4). Size and temperature explained 52% and 35% 267
268
MIS was less dependent on pre-molt size and temperature. A significant relationship (p<0.05)
269
between MIS and
pre-270
model, both size (i.e. pre-molt CL) and temperature had a significant effect on size increment at molt 271
although explaining only 12% of the variability in MIS(9.4% for ClIand 2.3% for temperature, Table 4).
272
Projections of size at age based on IP and MIS
273
mm in CL at the age of 5 while th 274
21 and 25 mm was only reached at the age of 9 (Fig. 5). Variations in the size at age estimated from modal 275
analysis of length frequency distributions for populations found in different temperature conditions (Table 276
5) are in good agreement with the projections based on IP and MISfor the different temperatures (Fig. 6).
277 278
for the pro 279
280
observed and projected size at age are observed for younger ages (below age 2 to 3); growth rates appearing 281
282
lower compared to sizes at age for natural populations exposed to the lowest temperatures (Barents Sea and 283
Davis Strait populations). 284
DISCUSSION 285
286
This study represents the first assessment of the growth characteristics of P. borealis over most of 287
its size range. The laboratory experiments allowed the determination of the growth parameters MI and IP 288
for juvenile and adult P. borealis in the size range of 5 to 27 mm CL at temperatures (2 289
covering the temperature range where P. borealis is usually found .
290
Observed patterns of variations in IP and MI with size and temperature corroborate the general results 291
observed in many crustacean species. IP decreased with increasing temperature at all developmental stages 292
and increased with pre-molt size in all treatments, juveniles showing the highest molting frequency. MI was 293
also influenced by shrimp size, with greater size increments in juveniles than in males and females. 294
However, temperature had a smaller effect on MI and this effect was different between developmental 295
stages. MIM was 4-fold higher in juveniles than in males and females whereas MIS only differed
296
Sof P. borealis was also of relatively
297
small amplitude over the range of temperature conditions tested. Variations in specific growth rates, which 298
integrate both IP and MI, with developmental stages, clearly demonstrate the positive effect of temperature 299
on the growth of P. borealis and the decrease in growth with increasing size. SGRSfor juveniles and males
300
significantly increased with temperature and SGRSof juveniles was significantly higher than in adults.
301
The present study indicates a pronounced effect of temperature on IP while MIS changed little,
302
indicating that the main influence of temperature on growth rate of P. borealis is through IP. Hence, the 303
shortening of IP results in a faster growth at higher temperature. Hartnoll (1982) reported various examples 304
of crustaceans in which an increase in temperature shortened IP and decreased or had no effect on CL 305
increments per molt. Wainwright and Armstrong (1993) showed a declining probability of molt for mature 306
Dungeness crab, Cancer magister, compared to juveniles. Temperature has been shown to strongly 307
influence IP and to have a negligible influence on MI for C. magister. Moreover, higher temperature may 308
result in faster growth even in cases when MI decreases with increasing temperature, if higher molt 309
frequency compensates for reduced MI (Paglianti and Gherardi 2004). This lengthened IP duration with 310
lower temperature may reflect the greater time needed for the accumulation of sufficient energy reserves for 311
molting. A similar response in growth was observed in the arctic-boreal species, Sclerocrangon boreas. 312
Size-specific MI did not vary 313
shorter at the highest temperature regime (Ingram 1979 in Sainte-Marie et al. 2006). In Neomysis integer 314
(2-12 mm) a decrease of IP from 20 to 5 days and a increase of MISfrom 4 to 12 % were observed between
315
(Winkler and Greve 2002). Studying the impact of temperature on growth rates along the 316
developmental stages of this species, the authors concluded that temperature affected growth of N. integer 317
by principally controlling intermolt periods. In juvenile tiger prawn, Penaeus esculentus, and mysid, 318
Acanthomysis robusta, it was also concluded that the increase of IP with decreasing temperature was the
319
major factor controlling juvenile growth rate (O'Brien 1994). 320
Increases in mass at the different temperatures were not associated with differential investment in 321
hepatopancreas, muscle, gonads or carcass. Even if differences were observed in some of the tissue mass 322
indices, there was no systematic pattern of variation with temperature indicating potential variations in 323
seasonal energy allocation or reproductive investment associated with temperature in the present study. 324 Initial values 325 326 327 328 329
As spawning occurs just after molting (Brillon et 330
al. 2005), the egg mass spawn by mature females was most probably lost before the sampling and weighing 331
of the shrimp (15 days after the molt). 332
The multiple regression models examining size and temperature effects on the growth of P. 333
borealis explained significant proportions of the variation in IP and MIS. Both temperature and pre-molt
334
size accounted for important proportions of the variation in IP (35% and 52%, respectively). However, both 335
factors only accounted for 12% of the variation in MIS. Other factors not measured in the present study may
336
influence size increment at molt. For example, food supply, which may influence growth (Hartnoll 2001), 337
was not specifically measured in the present study. In our experiments, shrimp were always fed in excess. 338
In Antarctic krill, growth rates have been related to food quantity and quality (Ross et al. 2000; Atkinson et 339
al. 2006). However, it was demonstrated that food did not influence the IP (Tarling et al. 2006). In P. 340
borealis which feeds on pelagic organisms, benthic polychaetes, and detritus from sediments, lipid content
341
exhibited marked seasonal oscillations while growth in carapace length showed only comparatively weak 342
seasonality (Hopkins et al. 1993). This suggests that in natural environment, temperature may have a larger 343
influence on IP and MISthan food availability in northern shrimp but further studies are necessary to assess
344
their relative importance. 345
Regression models indicate that the growth trajectory of individual shrimp should largely be 346
influenced by environmental conditions during the juvenile stage. The juvenile stage is the most sensitive to 347
variations in temperature conditions, differences in IP with temperature being more important for smaller 348
shrimp sizes. The slower growth observed for females at all temperatures in the present study, the costs of 349
energy maintenance for females during the ovigerous period (Brillon et al. 2005) 350
would suggest that the growth of shrimp following sex change 351
will be reduced and almost independent of temperature (for the temperature range studied). Molting events 352
in females are limited by the reproductive cycle. Females of P. borealis molt in fall just before mating and 353
spawning, carry their eggs for a period of 6 to 10 months and molt again in spring following the release of 354
the larvae (Shumway et al. 1985; Koeller et al. 2009). The duration of the ovigerous period which varies 355
from 236 to 135 days at temperatu 356
non-ovigerous females at the same temperatures. Moreover, based on our measurements of IP, reproducing 357
females could not complete more than 1 or 2 molt cycles during the 2 to 6 months when they do not carry 358
eggs. The reproductive cycle therefore limits molting frequency to 2 or 3 cycles per year in reproducing 359
females, and hence limits their growth rate. Thus, the asymptotic female size of the population (i.e. 360
maximum size) could be largely determined by the size of shrimp following sex change. Shumway et al. 361
(1985) suggested that growth rate increased during sex change. However, no specific study compared the 362
growth of males in the process of sex change to that of males of similar size delaying the initiation of sex 363
change. 364
Most studies on the growth of northern shrimp have been carried out on populations in the open 365
sea by the identification and tracking of modes (cohorts) using length-frequency distributions (Skuladottir 366
. As in most crustaceans, the difficulty of separating 367
the components of growth (MI and frequency) has prevented the complete description of this fundamental 368
process in natural populations (Ehrhardt 2008). Although laboratory work cannot completely mimic natural 369
conditions, the present study clearly delineate the relative importance of IP and MI in the growth of 370
northern shrimp. Moreover, projections of size at age at different temperatures based on regression models 371
relating IP and MISto size and temperature are in good agreement with sizes at age estimated from modal
372
analysis of length distributions of populations in different temperature regimes. 373
Apparent divergence in observed growth rate for age 2 and 3 shrimp in natural populations and 374
predicted growth using IP and MIS was examined by comparing predicted growth of juveniles in the
375
present study to annual length increment of juvenile shrimp found at different bottom temperatures in West 376
Greenland (Wieland 2005). In West Greenland, annual length increments for age 2 and 3 showed 377
378
Increments ranged from 2.7 to 4.7 mm CL per year at age 2 (11-14 mm CL) and from 1.5 to 3.7 mm CL per 379
year at age 3 (15-19 mm CL) (Wieland 2005). Predicted size increments for juveniles of the same sizes at 2 380
381
CL per year for age 3. Thus, predicted increments for sizes below 14 mm CL may have been slightly 382
underestimated in the present study. Comparable or higher size increments for juveniles of that size are 383
384
correspondence in increments per year is observed. 385
Specific comparisons between estimated sizes at age in natural populations and projected sizes at 386
age at a constant temperature are difficult to interpret. In natural populations, ontogenetic, seasonal, and 387
diurnal migration patterns can result in large differences between temperatures experienced by free-ranging 388
shrimp in different parts of their life cycle and the mean temperatures used as selected temperatures by the 389
populations. Moreover, as already mentioned, uncertainties in age determination of shrimp in natural 390
conditions can lead to inaccuracies in the determination of size at age. 391
Temperature regimes reported for the different populations represent mean bottom temperatures 392
encountered during annual surveys. These temperatures may differ from average ambient conditions to 393
which northern shrimp are subjected, as they do not account for diurnal vertical migration, seasonal, spatial 394
and ontogenetic migrations. In the natural environment, differential distribution of juveniles, males and 395
females has often been observed. In most areas, juvenile shrimp are usually observed inshore in shallower 396
waters where they are exposed to different and more variable temperatures (Shumway et al. 1985; Simard 397
and Savard 1990). In Flemish Cap, many studies reviewed by Skuladottir et al. (2005) noted the prevalence 398
of smaller males at shallower depth and females at greater depths. In some populations, ovigerous females 399
also migrate during fall and winter from offshore to nearshore colder waters 400
2000). This behaviour is suggested to be an adaptation to improve the match between egg hatching and the 401
phytoplankton bloom (Koeller et al. 2009). Diurnal vertical migration has also been observed in many 402
populations with some differences in the extent of the migration depending on shrimp size (Shumway et al. 403
. 404
Sampling bias due to the ontogenetic distribution pattern of shrimp and inaccuracies in the 405
methods used to determine size at age may also explain some of the differences between predicted and 406
observed sizes at age. For example, differences in the length of shrimp from the same cohort sampled in 407
different depth in the Barents Sea indicate the importance of sampling design to accurately reflect size 408
frequency distribution which is used to determine size at age (Aschan 2000). Moreover, the absence of 409
permanent anatomical structure allowing individual determination of age is increasing the difficulty in 410
determining and interpreting age and growth. 411
Given all the uncertainties in determining size at age and the influence of temperature on growth 412
derived from these measures in natural populations, the present study offers an alternative in predicting 413
growth response of shrimp populations to modifications of their environment. In the context of large-scale 414
climatic change it has already been anticipated that P. borealis will be affected by changes in both the 415
timing of spring bloom and bottom temperatures (Koeller et al. 2009). The present study clearly shows the 416
influence of temperature on growth, which will have direct impacts on many life history characteristics of 417
the populations. Growth rate will influence maximum size of males, size at sex change, maximum female 418
size, and fecundity. Moreover, temperature through its influence on intermolt duration might affect the 419
timing of spawning as well. 420
Our results provide insights for the interpretation of growth patterns of populations in the wild. In 421
seasonally and annually varying environments, different cohorts of postlarvae, settling at different times of 422
the year (different temperatures), will contribute differentially to the recruitment of shrimp (Staples and 423
Heales 1991). The temperature regime encountered during the juvenile stage (i.e. first 2-3 years) should 424
drive the growth trajectory of the population as temperature effects on intermolt duration and size 425
increment at molt are more important for juvenile than adult stages. Further studies of juvenile growth in 426
controlled conditions (i.e. CL between 5-15 mm) are necessary to validate growth measured in the present 427
study for that size range. Moreover, a better knowledge of juvenile distribution and migration is necessary 428
to understand growth trajectories of shrimp populations in natural environment and predict the impact of 429
large-scale change in the environment on shrimp population dynamics. 430
431
ACKNOWLEDGEMENTS 432
We are very grateful to L. Savard for instigating the research program on shrimp from which 433
funding was obtained. Funds were provided by the department of Fisheries and Oceans under the Science 434
strategic fund program on Growth and Recruitment of Northern Shrimp and by the shrimp fishermen 435
associations of Quebec and New-Brunswick under the DFO-Group B Fishermen co-management 436
agreement. Assistance from M. Peloquin in the design and construction of the experimental setup is 437
-Boulianne 438
for their help in conducting the experiments. We are very grateful to B. Sainte-Marie and two anonymous 439
reviewers for helpful comments on an earlier version of the paper. Special thanks to J. Plourde for his great 440
help with analyses using SAS. All experiments were conducted in compliance with the current laws of the 441
Canadian Council on Animal Care. 442
BIBLIOGRAPHY 444
445
Aiken DE, Waddy SL (1989) Culture of the American lobster, Homarus americanus. In: Bogden AD (ed) 446
Cold-water aquaculture in Canada. The Canadian Institute for Research on Regional Development, 447
Moncton, Canada, pp 79-122 448
Anderson PJ (1999) Pandalid shrimp as indicator of ocean climate regime shift. NAFO SCR doc. 99/80 No. 449
N4152. 450
Anderson PJ, Piatt JF. 1999. Community reorganization in the Gulf of Alaska following ocean climate 451
regime shift. Mar. Ecol. Prog. Ser. 189: 117-123. doi: 10.3354/meps189117. 452
Apollonio S, Stevenson DK, Dunton EE (1986) Effects of temperature on the biology of the northern 453
shrimp, Pandalus borealis, in the Gulf of Maine. NOAA Tech. Rep. 42: 22 pp 454
Aschan M (2000) Spatial variability in length frequency distribution and growth of shrimp (Pandalus 455
borealis Kroyer 1838) in the Barents Sea. J Northwest Atl Fish Sci 27: 93-105
456
Atkinson A, Shreeve RS, Hirst AG, Rothery P, Tarling TA, Pond DW, Korb RE, Murphy EJ, and Watkins 457
JL (2006) Natural growth rates in Antarctic krill (Euphausia superba): II. Predictive models based 458
on food, temperature, body length, sex, and maturity stage. Limnol Oceanogr 51: 973-987 459
Benayoun G, Fowler SW (1980) Long-term observation on the moulting frequency of the shrimp Lysmata 460
seticaudata. Mar Biol 59: 219-223
461
Pandalus borealis. Mar Ecol
462
Prog Ser 83: 167-183 463
The biology of Pandalus. Adv Mar Biol 38: 55-245 464
Brillon S, Lambert Y, Dodson J (2005) Egg survival, embryonic development, and larval characteristics of 465
northern shrimp (Pandalus borealis) females subject to different temperature and feeding 466
conditions. Mar Biol 147: 895-911 467
Clark SH, Cadrin SX, Schick DF, Diodati PJ, Armstrong MP, McCarron D (2000) The Gulf of Maine 468
northern shrimp (Pandalus borealis) fishery: a review of the record. J Northw Atl Fish Sci 27: 469
193-226 470
Comeau M, Savoie F (2001) Growth increment and molt frequency of the American lobster (Homarus 471
americanus) in the southwestern Gulf of St. Lawrence. J Crustac Biol 21: 923-936
472
Ehrhardt NM (2008) Estimating growth of the Florida spiny lobster, Panulirus argus, from molt frequency 473
and size increment data derived from tag and recapture experiments. Fish Res 93: 332-337 474
Fu C, Quinn TJ, Shirley TC (2001) The role of sex change, growth and mortality in Pandalus population 475
dynamics and management. ICES J Mar Sci 58: 607-621 476
Hansen HO, Aschan M (2000) Growth, size- and age-at-maturity of shrimp, Pandalus borealis, at Svalbard 477
related to environmental parameters. J Northw Atl Fish Sci 27: 83-91 478
Hart RC (2001) Rapid estimation of in situ growth rates of Caridina nilotica (Crustacea: Decapoda) in 479
Lake Victoria: Description and pilot application of a simple, field-compatible technique. Limnol 480
Oceanogr 46: 692-698 481
Hartnoll RG (1982) Growth. In: Abele LG (ed) The biology of Crustacea. Academic Press, New York, pp 482
11-96 483
Hartnoll RG (2001) Growth in Crustacea - twenty years on. Hydrobiologia 449: 111-122 484
Hopkins CCE, Sargent JR, and Nilssen EM (1993) Total lipid content, and lipid and fatty acid composition 485
of the deep-water prawn Pandalus borealis from Balsfjord, northern Norway: growth and feeding 486
relationships. Mar Ecol Prog Ser 96: 217-228 487
Iguchi N, Ikeda T (1995) Growth, metabolism and growth efficiency of a euphausiid crustacean Euphausia 488
pacifica in the southern Japan Sea, as influenced by temperature. J Plankton Res 17: 1757-1769
489
Kawaguchi S, Candy SG, King R,Naganobu M, and Nicol S (2006) Modelling growth of Antarctic krill. I. 490
Growth trends with sex, length, season, and region. Mar Ecol Prog Ser 306: 1-15 491
Kinne O (1970) Environmental factors, part 2. In: Ecology M (ed) Temperature, animals, invertebrates. 492
Wiley Interscience, London, U.K., pp 443-486 493
Koeller P (2006) Inferring shrimp (Pandalus borealis) growth characteristics from life history stage 494
structure analysis. J Shellfish Res 25: 595-608 495
Koeller P, Fuentes-Yaco C, Platt T, Sathyendranath S, Richards A, Ouellet P, Orr D, Skuladottir U, 496
Wieland K, Savard L, Aschan M. 2009. Basin-scale coherence in phenology of shrimps and 497
phytoplankton in the north Atlantic Ocean. Science (Wash D C) 324: 791-793. doi: 498
10.1126/science.1170987. 499
Koeller PA (2000) Relative importance of abiotic and biotic factors to the management of the northern 500
shrimp (Pandalus borealis) fishery on the Scotian Shelf. J Northw Atl Fish Sci 27: 21-33 501
Kulmiye AJ, Mavuti KM (2005) Growth and moulting of captive Panulirus homarus homarus in Kenya, 502
western Indian Ocean. N Z J Mar Freshw Res 39: 539-549 503
Lysy AY, Dvinina EA (1991) On relation of the deep sea shrimp size with oceanographic conditions in the 504
Barents sea. ICES CM. 1991/k :52 505
O'Brien CJ (1994) The effects of temperature and salinity on growth and survival of juvenile tiger prawns 506
Penaeus esculentus (Haswell). J Exp Mar Biol Ecol 183: 133-145
507
Paglianti A, Gherardi F (2004) Combined effects of temperature and diet on growth and survival of young-508
of-year crayfish: a comparison between indigenous and invasive species. J Crustac Biol 24: 140-509
148 510
Quinn GP, Keough MJ (2002) Experimental design and data analysis for biologists. Cambridge University 511
Press, Cambridge, UK 512
Ricker WE (1975) Computation and interpretation of biological statistics of fish populations. Bull Fish Res 513
Board Can 191: 382 pp. 514
Ross RM, Quetin LB, Baker KS, Vernet M, and Smith RC (2000) Growth limitation in young Euphausia 515
superba under field conditions. Limnol Oceanogr 45: 31-43
516
Sainte- (2006) Observations on the growth of the sculptured shrimp,
517
Sclerocrangon boreas (Decapoda: Caridea). J Crustac Biol 26: 55-62
518
Savard L, Parsons DG, Carlsson DM (1994) Estimation of age and growth of northern shrimp (Pandalus 519
borealis) in Davis Strait (NAFO subareas 0+1) using cluster and modal analyses. J Northw Atl
520
Fish Sci 16: 63-74 521
Shumway SE, Perkins HC, Schick DF, Stickney AP (1985) Synopsis of biological data on the pink shrimp, 522
Pandalus borealis Kroeyer, 1838. FAO Fisheries Synopsis 144: 57 pp.
523
Simard Y, Savard L. 1990. Variability, spatial patterns and scales of similarity in size-frequency 524
distributions of the northern shrimp (Pandalus borealis) and its migrations in the Gulf of St. 525
Lawrence. Can J Fish Aquat Sci 47(4): 794-804. doi: 10.1139/f90-092. 526
Skuladottir U, Palsson J, Bragason GS, Brynjolfsson S (1991) The variation in size and age at change of 527
sex, maximum length and length of ovigerous period of the shrimp, Pandalus borealis, at different 528
temperatures in the Icelandic waters. ICES CM 1991/k : 5 529
Skuladottir U, Petursson G, Brynjolfsson SH (2005). The biology of northern shrimp (Pandalus borealis) 530
on the Flemish Cap. J Northw Atl Fish Sci 37: 147-164. doi: 10.2960/J.v37.m571. 531
Sokal RR, Rohlf FJ (1995) Biometry The principles and practice of statistics in biological research. 532
Freeman and Co., New York 533
Staples DJ, Heales DS (1991) Temperature and salinity optima for growth and survival of juvenile banana 534
prawns Penaeus merguiensis. J Exp Mar Biol Ecol 154: 251-274 535
Sudo H (2003) Effect of temperature on growth, sexual maturity and reproduction of Acanthomysis robusta 536
(Crustacea: Mysidacea) reared in the laboratory. Mar biol 143: 1095-1107 537
Tarling TA, Shreeve RS, Hirst AG, Atkinson A, Pond DW, Murphy EJ, and Watkins JL (2006) Natural 538
growth rates in Antarctic krill (Euphausia superba): I. Improving methodology and predicting 539
intermolt period. Limnol Oceanogr 51: 959-972 540
Wainwright TC, Armstrong DA (1993) Growth patterns in the dungeness crab (Cancer magister Dana): 541
synthesis of data and comparison of models. J Crustac Biol 13: 36-50 542
Wieland K (2005) Changes in recruitment, growth, and stock size of northern shrimp (Pandalus borealis) 543
at West Greenland: temperature and density-dependent effects at released predation pressure. 544
ICES J Mar Sci 62: 1454-1462 545
Winkler G, Greve W. 2002. Laboratory studies of the effect of temperature on growth, moulting and 546
reproduction in the co-occurring mysids Neomysis integer and Praunus flexuosus. Mar Ecol Prog 547
Ser 235: 177-188. doi: 10.3354/meps235177. 548
549 550
Fig. 1 Box-plots of intermolt period (IP) for juvenile, male and female northern shrimp P. borealis at 2, 5, 552
The median and the 25th
and the 75th
percentiles are represented. Whiskers below and above the 553
box indicate the 10th and the 90th percentiles. Different letters indicate significant (p < 0.05) differences 554
between temperatures for each developmental stage. 555
Fig. 2 Box-plots of molt increment in CL (MIS) and in total mass (MIM) for juvenile, male and female
556
northern shrimp P. borealis The median and the 25th
and the 75th
percentiles are 557
represented. Whiskers below and above the box indicate the 10thand the 90thpercentiles. Different letters 558
indicate significant (p < 0.05) differences between temperatures for each developmental stage. 559
Fig. 3 Box-plots of specific growth rates in CL (SGRS) and in total mass (SGRM) for juvenile, male and
560
female northern shrimp, P. borealis The median and the 25th
and the 75th
percentiles are 561
represented. Whiskers below and above the box indicate the 10thand the 90thpercentiles. Different letters 562
indicate significant (p < 0.05) differences between temperatures for each developmental stage. 563
Fig. 4 Relationships between intermolt duration (IP), size increment at molt (MIS) and pre-molt
564
c P. borealis. Relationships between IP and
565
CL are presented as power functions (Y=aXb) and the relationship between MI and CL as a linear 566
regression (Y=a+bX). The relationship between MISand CL was significant (p < 0.05)
567
Fig. 5 Predicted size at age (CL in mm) for northern shrimp P. borealis using multiple regression equations 568
relating intermolt duration and size increment at molt to pre-molt size and temperature for constant 569
tempe Mean size at age and upper and lower 95% confidence intervals estimated 570
with the Monte Carlo analysis are presented. 571
Fig. 6 Size at age for populations of northern shrimp, P. borealis, found in different locations and 572
temperature regimes. Numbers correspond to locations and average bottom temperatures for different 573
574
grey curves. 575
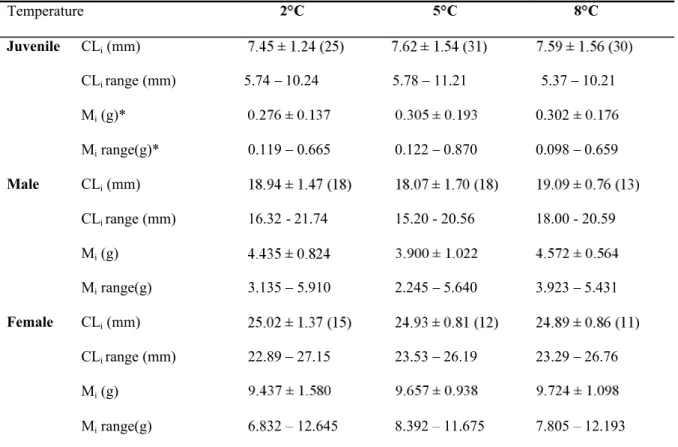
Table 1. Size (CLi) and mass (Mi) of juveniles, males and females at the beginning of the intermolt period.
Mean values, SD, range of values, and number of samples in parenthesis are presented. For both CLiand
Mi, no significant differences were observed (p > 0.05) between temperatures at each developmental stage.
Temperature Juvenile CLi(mm) CLi range (mm) 5.74 10.24 5.78 11.21 5.37 10.21 Mi(g)* 0.302 Mirange(g)* 0.119 0.665 0.122 0.870 0.098 0.659 Male CLi(mm) CLi range (mm) 16.32 - 21.74 15.20 - 20.56 18.00 - 20.59 Mi(g) Mirange(g) 3.135 5.910 2.245 5.640 3.923 5.431 Female CLi(mm) CLi range (mm) 22.89 27.15 23.53 26.19 23.29 26.76 Mi(g) Mirange(g) 6.832 12.645 8.392 11.675 7.805 12.193
*values estimated with the CL-mass relationship: Log(M) = -3.103 + 2.882 Log(CL), n = 146, r2= 0.94. Table
Table 2. Changes in relative masses of body compartments (%) observed during one complete molt cycle at three temperatures for juvenile, male and female shrimp. Mean values, SD, and number of samples in parenthesis are presented for the hepatopancreas (HSI), muscle (MSI), gonads (GSI), and carcass (CSI) indices. Different letters indicate significant differences between temperatures for each developmental stage.
Indices HSI MSI CSI GSI
Initial .85 (20) b a b a C a b b ab b 23)b a a Final a b ) b 18) a b b 0.36 ab b a a b 12) b a b b
Table 3. Regression parameters of the relationships between intermolt duration and pre-molt CL (log transformed data
duration (days) at specific CL of 7, 19, and 25 mm are presented.
Temperature b a p n 7 mm 19 mm 25 mm
0.579 1.305 0.86 <0.0001 58 62 111 130
0.675 0.989 0.89 <0.0001 61 36 71 86
Table 4. Multiple regression models relating intermolt duration (IP) and size increment at molt (MIS) to
pre-molt cephalothorax length (CLI) and temperature (T). For each variable, coefficient estimate, standard
error (SE) of the coefficient, F value, and probability level (p) are presented. Model r2and the partial r2are also presented. Coefficient SE F p Partial r2 Model r2 Log IP Intercept 1.2961 0.0289 13.91 < 0.0001 Log CLI 0.6806 0.0236 5.77 < 0.0001 0.515 0.515 T -0.0555 0.0023 3.94 < 0.0001 0.353 0.868 MIs Intercept 5.0458 0.5646 79.87 < 0.0001 CLI -0.0988 0.0244 16.36 < 0.0001 0.094 0.094 T 0.1715 0.0749 5.24 0.0233 0.027 0.122
Table 5. P. borealis is distributed. In
the different studies, bottom temperatures were obtained from annual shrimp surveys usually conducted at the same time of the year.
Location Years Temperature Reference
Barents Sea 1 1990-1993 1- Skuladottir et al. (2005)
Davis Strait 2 1978-1986 1- Parsons et al. (1989)
Hopedale Channel 3 1981-1987 2- Parsons et al. (1989)
Flemish Cap 4 1993-1999 Skuladottir et al. (2005) Iceland 5 1981-1989 Skuladottir et al. (2005) Gullmarsfjorden 6 1980-1985 4- Bergstrom (1992) Gulf of Maine 7 1969-1986-1990-1991 5.5- Clark et al. (2000)