HAL Id: hal-02933713
https://hal.archives-ouvertes.fr/hal-02933713
Submitted on 14 Sep 2020
HAL is a multi-disciplinary open access archive for the deposit and dissemination of sci-entific research documents, whether they are pub-lished or not. The documents may come from teaching and research institutions in France or abroad, or from public or private research centers.
L’archive ouverte pluridisciplinaire HAL, est destinée au dépôt et à la diffusion de documents scientifiques de niveau recherche, publiés ou non, émanant des établissements d’enseignement et de recherche français ou étrangers, des laboratoires publics ou privés.
Chloé Larre, Yann Morizet, Antoine Bézos, Christèle Guivel, Carole La,
Nicolas Mangold
To cite this version:
Chloé Larre, Yann Morizet, Antoine Bézos, Christèle Guivel, Carole La, et al.. Particular H 2 O dissolution mechanism in iron-rich melt: Application to martian basaltic melt genesis. Journal of Raman Spectroscopy, Wiley, 2019, 51 (3), pp.493-507. �10.1002/jrs.5787�. �hal-02933713�
For Peer Review
1
Particular H
2O dissolution mechanism in iron-rich melt:
2application to martian basaltic melt genesis.
3 Chloé Larre*1, Yann Morizet1, Antoine Bézos1, Christèle Guivel1, Carole La1, and Nicolas
4 Mangold1
5
6 1 Laboratoire de Planétologie et Géodynamique (LPG), Université de Nantes, UMR-CNRS
7 6112, Nantes, Pays de la Loire, FRANCE
8 * Corresponding author information:
9 - email contact: chloe.larre@univ-nantes.fr
10 - tel: +33 (0) 2 5112 5455
11
12 Abstract
13 Martian basalts are different from Earth by their iron-rich abundance with 18 wt % FeOtot in
14 average for Mars upper crust. The H2O behavior in this atypical melt composition is not well
15 understood. We have synthesized H2O-bearing martian basaltic glasses (> 15.5 wt % FeOini)
16 under high pressures (0.5-1.5 GPa) and temperatures (> 1500 °C) conditions. We used Raman
17 spectra to investigate the effect of H2O as well as the high FeOtot content on the molecular
18 structure of Fe-rich glasses.
19 Increasing Fecontent appears to inhibit the dissolution of H2O in the melt. We observed the
20 formation of Free OH groups at 3660 cm-1 at relatively low H
2O content (1 wt %) in Fe-rich
21 glasses whereas it only appears at high H2O content (~6.5 wt %) for Fe-poor glasses. We
22 suggest that the Free OH are bonded to Fe2+ cations in the melt forming isolating clusters of
23 Fe(OH)2. Such configurations is suspected to induce an increase in the melt polymerization;
3 4 5 6 7 8 9 10 11 12 13 14 15 16 17 18 19 20 21 22 23 24 25 26 27 28 29 30 31 32 33 34 35 36 37 38 39 40 41 42 43 44 45 46 47 48 49 50 51 52 53 54 55 56 57 58 59 60
For Peer Review
24 however, we did not clearly observe it and further investigation is requested. The major
25 implication of these results is the possibility to form an immiscible hydrated Fe-rich phase that
26 will favor formation of Fe-oxides at Mars surface.
27 1. Introduction
28 Many evidences of features related to liquid flows and aqueous phases at the surface of Mars
29 led to the conclusion that water was present in its youth (e.g., [1-3]). To stabilize liquid water
30 at the surface of Mars, an atmosphere thicker and denser than the present one is needed [4-7].
31 Such primitive atmosphere would either require: 1) volatiles from large extra-terrestrial impacts
32 or 2) volatiles degassing from the interior of the planet through volcanism. Indeed, Mars went
33 through an intense volcanic activity during the Noachian (> 3.7 Ga), resulting in large provinces
34 of igneous basaltic rocks covering the surface [8-12].
35 The quantification of the volatile fluxes from a planetary mantle to its atmosphere depends
36 chiefly on the volatile content at the source and their respective solubility in the magmatic
37 system. During volcanic eruptions, volatile species such as CO2, H2O and SO2 (for the most
38 important) are degassed into the atmosphere. The behavior of volatile species has been widely
39 investigated for the different terrestrial melt compositions: 1) CO2, H2O and SO42- for basaltic
40 melt compositions (e.g., [13-16]); 2) CO2 and H2O for silica-poor melts (e.g., [17-20]). While
41 studies have focused their work on the volatile solubility in Earth magmatic systems, only few
42 of them have focused on the solubility of volatile elements in martian magmas to constrain the
43 volatile geochemical cycle of Mars. From geochemical modeling and meteorite analyses,
44 estimations of the H2O in a martian melt have been proposed although values are very scattered
45 from thousands of ppm to 2 wt % H2O [21 - 23].
46 Martian interior can be characterized by a wide range of redox conditions: from IW (i.e., Iron
47 Wüstite) to above the QFM buffer (i.e., Quart-Fayalite-Magnetite) [24-26]. Experimental
3 4 5 6 7 8 9 10 11 12 13 14 15 16 17 18 19 20 21 22 23 24 25 26 27 28 29 30 31 32 33 34 35 36 37 38 39 40 41 42 43 44 45 46 47 48 49 50 51 52 53 54 55 56 57 58 59 60
For Peer Review
48 studies on martian melt were mainly focused on the C behavior under oxidizing and reducing
49 conditions (e.g., [27-30]). Studies of the crystallization sequence for martian melt analogues in
50 presence of H2O have been proposed [31-33] and the water content determined. However, the
51 H2O quantification established in those studies cannot reflect the solubility of H2O in an
iron-52 rich melt. Up to now, there is no experimental study scrutinizing the H2O dissolution
53 mechanisms for iron-rich glass.
54 The Raman spectroscopy is a dedicated tool used to investigate qualitatively and quantitatively
55 both crystallized and amorphous materials. Spectroscopic studies were achieved to establish
56 calibrations from Raman spectra in crystallized materials (e.g., [34-36]). Many studies on
57 amorphous materials based on the investigation of CO2 and S behaviors in a silicate melt have
58 led to subsequent calibrations (e.g. [37-39]). Calibrations to quantify the H2O in melts by
59 Raman spectroscopy have been proposed by [40-43]. Nonetheless, the behavior of volatile
60 species dissolved in an iron-rich melt prevailing on Mars has been merely addressed by Raman
61 spectroscopy.
62 In the present study we investigated the behavior of H2O in an iron-rich melt. We synthesized
63 Fe-rich basalt glasses (15.5 and 23.5 wt % FeOini) under high-pressure conditions (0.5-1.5 GPa)
64 in equilibrium with a H2O fluid phase (up to 3 wt % starting H2O content). The results obtained
65 on Fe-rich glasses are compared to a Fe-poor terrestrial basalt analogue (~ 9 wt %). Experiments
66 at high H2O content (> 6 wt %) have also been performed on the terrestrial analogue
67 composition. The silicate structure of the obtained glasses has been characterized by Raman
68 spectroscopy. Fe2+ and FeO
tot (total iron) wet chemistry analyses have been performed in order
69 to discuss the interplay of the Fe coordination state and the H2O dissolution mechanism. The
70 growth of Free OH molecular groups is observed at very low H2O content in Fe-rich basaltic
71 glasses and the possible impact of these molecular clusters on element transportation within
72 Mars interiors is discussed.
3 4 5 6 7 8 9 10 11 12 13 14 15 16 17 18 19 20 21 22 23 24 25 26 27 28 29 30 31 32 33 34 35 36 37 38 39 40 41 42 43 44 45 46 47 48 49 50 51 52 53 54 55 56 57 58 59 60
For Peer Review
73 2. Methods
74 2.1. Starting Material
75 Investigated synthetic compositions were prepared in the SiO2-Al2O3-FeO-MgO-CaO-Na2O
76 system from a mixture of oxides and carbonate (Na2CO3). The Fe-rich synthetic basaltic
77 compositions were made according to basaltic rocks identified at the surface of Mars by the
78 Spirit and Curiosity rovers at Gusev and Gale craters, respectively [7, 12]. The two Fe-rich
79 synthetic basaltic compositions were prepared with 15.5 and 23.5 wt % FeO and were referred
80 as GC and CL respectively. A natural Popping Rock 2𝜋𝐷43 glass (i.e., PR, ~9 wt % FeOtot)
81 has also been studied to investigate the H2O behavior in a terrestrial analogue. The glass
82 chemical compositions are reported in Table 1.
83 The natural Popping Rock and the synthetic compositions were crushed in an agate mortar for
84 homogenization. Some powders were decarbonated at 850°C for at least 4 hours in a 1 atm
85 furnace (i.e., GCD and PR samples). The wet chemistry results of the starting materials showed
86 that iron is mostly under Fe3+ state, Fe2+ / ∑Fe at 0.03 and 0.02 for GC and CL starting powders,
87 respectively (see Table 1). Prior to the high pressure experiments, the Fe is almost fully
88 oxidized.
89 The initial degree of polymerization representing the silicate network tetrahedral units
90 interconnection, calculated according to Brooker et al. [18], is represented by the NBO/T
91 parameter (i.e., Non-Bridging Oxygen per Tetrahedron) in the Table 1. For this calculation, Fe
92 is considered as Fe3+ in the mixtures and therefore as a network former cation like Si4+ or Al3+.
93 The studied compositions have comparable NBO/T with 0.38, 0.56 and 0.33, for PR, GC and
94 CL, respectively; which represents slightly depolymerized composition.
95 2.2. High pressure experiments
3 4 5 6 7 8 9 10 11 12 13 14 15 16 17 18 19 20 21 22 23 24 25 26 27 28 29 30 31 32 33 34 35 36 37 38 39 40 41 42 43 44 45 46 47 48 49 50 51 52 53 54 55 56 57 58 59 60
For Peer Review
96 Pure H2O was added with a micro-syringe in several proportions (1.0 to 6.5 wt %) at the bottom
97 of a Pt capsule before loading the starting powder. The capsules were welded shut and weighed
98 to check for mass loss before and after the experiment. No evidence for weight loss was
99 observed from the recovered capsules.
100 The experiments were carried out using piston-cylinder apparatus in the pressure range of
0.5-101 1.5 GPa (~80 – 120 km in depth for Mars) and 1500 – 1600 °C for temperature range. A ¾ inch
102 talc-pyrex assembly was used. Previous work [44] showed that using talc-pyrex assemblies
103 apply intrinsic fO2 conditions close to QFM+1 buffer. Temperature was controlled with a
B-104 type thermocouple (PtRh6—PtRh30) with an accuracy of ±5°C. The accuracy on pressure was
105 ±10 % and a 10 % friction correction was applied during the experiment. The run duration
106 varied between 1 and 6 hours. Quenching was achieved by cutting off the power and the quench
107 rate was measured and estimated to be above 80°C/s.
108 2.3. Analytical methods
109 2.3.1. Spectroscopic methods
110 The Fourier Transform Infrared spectroscopy (i.e., FTIR) was used for several samples.
111 The acquisitions were acquired with a IR microscope attached to a Nicolet FTIR 5700, with a
112 X15 Cassegrain objective. The analysis conditions were: a white light source, an InSb detector
113 and CaF2 beamsplitter. Acquisitions were performed in the near IR area between 3000 – 6000
114 cm-1 with a spectral resolution of 4 cm-1. Each sample is an accumulation of 100 repetitive
115 scans. The samples were not polished due to their small sizes. Measurements of the thickness
116 of each glass chips were realized with a digitometer (with an accuracy of ±1 µm) to link the
117 absorption to the H2O content using the Beer-Lambert approximation [13, 14].
118 3 4 5 6 7 8 9 10 11 12 13 14 15 16 17 18 19 20 21 22 23 24 25 26 27 28 29 30 31 32 33 34 35 36 37 38 39 40 41 42 43 44 45 46 47 48 49 50 51 52 53 54 55 56 57 58 59 60
For Peer Review
119 We used a Jobin-Yvon Labram HR800 Raman spectrometer equipped with a 532 nm
120 solid-state laser at the Laboratory of Planetology and Geodynamic (LPG, Nantes University,
121 France). The output power was set at 50 mW to prevent sample damage. We used a grating of
122 1200 grooves/mm corresponding to a spectral resolution of ~0.8 cm-1. The acquisition time was
123 typically 30 sec with 6 repetitive scans. Spectra were acquired in a non-confocal mode with a
124 slit aperture of 200 µm and a spot size estimated ~1 µm in diameter. A X50 Olympus objective
125 was used. At least 5 spectra were acquired on each sample to investigate the homogeneity of
126 the recovered sample with respect to the dissolved H2O. The studied spectral range was between
127 200 and 1250 cm-1 and between 2600 and 4000 cm-1, covering the area of the silicate network
128 and the H2O vibrations, respectively.
129 H2O dissolved in silicate glasses exhibits Raman vibrations corresponding to the vibrations
130 stretch and bending (ν1 and ν2) of H2Omol and OH- represented by an envelope with a peak
131 maximum at ~3550 cm-1. A shoulder at 3660 cm-1 can be observed and is attributed to Free OH
132 groups vibrations [45-47]. We tested several calibrations to quantify H2O in glasses: [40, 41,
133 43]; using the ratio between the HF area (i.e., high frequency) band in the 800 – 1200 cm-1 and
134 the H2O band at 3550 cm-1 [40, 43] and the intensity of the same band [41]. Although, these
135 calibrations were not fully tested to quantify H2O in Fe-rich basaltic glasses; at a given
136 composition, the H2O content can be compared from one sample to another.
137 2.3.2. SEM and EPMA analysis
138 We performed Electron Probe Micro-Analysis (EPMA) and Secondary Electron Microscopy
139 (SEM) equipped with Energy Dispersive Spectroscopy to determine the major elements
140 compositions of our glasses. The SEM analyses were performed with a JEOL JSM 5800LV
141 with a beam current at 5 nA and a voltage at 15 kV, at Institut des Matériaux Jean Rouxel of
142 Nantes (IMN, France).
3 4 5 6 7 8 9 10 11 12 13 14 15 16 17 18 19 20 21 22 23 24 25 26 27 28 29 30 31 32 33 34 35 36 37 38 39 40 41 42 43 44 45 46 47 48 49 50 51 52 53 54 55 56 57 58 59 60
For Peer Review
143 The EPMA analyses were made using a Cameca SX 100 at IFREMER of Brest (France). A spot
144 size of 10 µm and a beam current at 6 nA were chosen for the glass components. The acquisition
145 time was 10 s on the sample and 5 s on the background. The standards chosen for our analysis
146 were: wollastonite (Si, Ca), corindon (Al), TiMn oxide, andradite (Fe), NiO, albite (Na),
147 forsterite (Mg), apatite (P), orthose (K), Cr2O3 oxide. The associated error is on the order of 2
148 % in relative to the measured value (see Table 2).
149 We can see in the Table 2, that the PR-3H-6h sample has experienced a strong Fe loss (2.7 wt
150 % FeOtot) during the experiment considering that the FeOtot in the PR composition is ~9 wt %.
151 This Fe-loss has previously been observed [48] and it is known from experimental study that
152 the Fe can form an alloy with the Pt capsule. Even knowing the loss of Fe during experiments,
153 the Fe-enrichment of the capsules has not proven its efficiency either. Then the Fe-loss cannot
154 be accurately controlled in high pressure and temperature experiments. However, all the
155 experiments have experienced depletion with respect to Fe. The following results are then
156 considering the FeOtot after the experiments.
157
158 2.3.3. Colorimetric determination of the Fe2+ / ∑Fe ratio
159 The Fe2+ / ∑Fe ratios were measured using the colorimetric method of Wilson [49] recently
160 modified by Schuessler et al. [50]. About 3 mg of samples were weighted in 7 mL crystal
161 polypropylene beakers with a precision of 10-3 mg and dissolved for 3 days at room temperature
162 in 1 mL of concentrated HF and 1 mL of 0.139 mol. L-1 ammonium vanadate (V5+). As the
163 digestion progresses in such low pH solutions, the Fe2+ released from the silicate matrix reacts
164 immediately with the V5+ to form Fe3+ and V4+. This reaction, which prevents any accidental
165 and irreversible oxidation of Fe2+ into Fe3+ [49], may be reversed if the pH of the solution is
166 raised up to 5. Once the digestions were completed, 5 mL of beryllium sulfate solution (500
3 4 5 6 7 8 9 10 11 12 13 14 15 16 17 18 19 20 21 22 23 24 25 26 27 28 29 30 31 32 33 34 35 36 37 38 39 40 41 42 43 44 45 46 47 48 49 50 51 52 53 54 55 56 57 58 59 60
For Peer Review
167 g.L-1) was added to the beakers in order to neutralize the excess of HF and breakdown all
168 insoluble fluorides. The final solutions for FeO colorimetric measurement were prepared in
169 volumetric flasks filled with 10 mL of ammonium acetate buffer solution at 500 g.mol-1 (to
170 raises pH up to 5), 5 mL of 2:2’-dipyridil solution as the ferrous colorimetric reagent and
ultra-171 pure water to filled up to 100 mL. The FeOtot. analytical solutions were prepared by adding
172 between 5 to 10 mg of hydroxylamine hydrochloride to an aliquot of the ferrous analytical
173 solutions [50]. This strong reducing agent ensure the quantitative reduction of all remaining
174 Fe3+ into Fe2+. The colorimetric measurements were made with the UV/VIS spectrophotometer
175 CARY UV500 (Varian). The optical density measurements were done at 525 nm where the
176 ferrous 2.2’ -dipyridil complex absorption is maximum [49]. The peaks heights were measured
177 relative to the baseline at 700 nm and the Fe2+ / ∑Fe ratios were determined by dividing the
178 absorbance ratios corrected for the procedural blanks. The results of the Fe2+ / ∑Fe
179 measurements on the international reference material JB-2 (Fe2+ / ∑Fe = 0.78 ±0.005, N=19)
180 are in good agreement with the recommended values (i.e., 0.78, [51]).
181
182 3. Results
183 3.1. Raman spectra
184 The Raman spectra obtained on H2O-bearing glasses synthesized at 1 GPa are represented in
185 Fig. 1A. The Raman spectra were treated with Labspec 6© software and a 5-degree polynomial
186 fit which goes through entrenched points (200 – 250 cm-1, ~600, ~800 and > 1150 cm-1) to
187 subtract the baseline is used [41]. The spectra are arranged according to their FeOtot. We
188 distinguish two parts: the HF region 800 – 1200 cm-1 and the LF region 200 – 600 cm-1. The
189 800 – 1200 cm-1 region represents the stretching of the silicate network (ν
1). The region between
190 200 and 600 cm-1 in amorphous material is still not well constrained owing to the complexity
3 4 5 6 7 8 9 10 11 12 13 14 15 16 17 18 19 20 21 22 23 24 25 26 27 28 29 30 31 32 33 34 35 36 37 38 39 40 41 42 43 44 45 46 47 48 49 50 51 52 53 54 55 56 57 58 59 60
For Peer Review
191 of the many vibrations occurring and overlapping together. Previous studies [52] have shown
192 that the LF region is a complex mixture between bending of tetrahedron from the silicate
193 network (e.g., Al, Si, Ti or Fe in tetrahedral coordination) and bending of tetrahedron in relation
194 to cation network modifiers (e.g., Mg, Ca, Na, K and Fe in octahedral coordination). Although
195 in the subsequent discussion, we will address in more detail the HF region, we observe that the
196 LF region is more intense than the HF region for the PR-6Hb and PR-3H-6h, with 4.5 and 2.7
197 wt % FeOtot respectively. There is an opposite behavior for the Fe-rich synthetic glasses (e.g.,
198 GC-3H-6h, GC-H2O-4h, GCD-3H-6h, CL-3H-6h). In the PR samples (PR-3H-6h and PR-6Hb),
199 the HF region is asymmetric and exhibits three main features: 850, ~1000 and 1050 cm-1. The
200 most intense peak is localized around 1000 cm-1. In the GC samples (GC-H
2O-4h and
GCD-201 3H-6h) peaks at 850 and 1050 cm-1 are smoothen but distinguishable. An intense peak around
202 950 cm-1 is present for GC synthetic glasses. Finally, for CL-3H-6h, the HF region shape is
203 almost symmetric with an intense peak centered at 950 cm-1. A Lorentzian-shape peak is
204 observed between the LF and HF region a 670 cm-1 for the iron-rich sample CL-3H-6h and the
205 Popping Rock PR-6Hb.
206 3.2. H2O quantification by Raman spectroscopy
207 Raman spectra of glasses synthesized 1 GPa are shown in Fig. 1B in the H2O vibration region
208 between 3400 and 3700 cm-1. Acquisitions were also performed between 4000 and 4300 cm-1
209 to investigate the possible presence of H2 at 4135 cm-1 [53] but no signal was found. A main
210 broad feature is observed at 3550 cm-1. At 3660 cm-1, we can observe a shoulder only presents
211 for the CL-3H-6h and PR-6H-b samples corresponding to Free OH species.
212 The quantification of H2O in our samples was performed using the calibration of Mercier et al.
213 [41] and according to the following equation (1):
214 (1) 𝐻2𝑂 (𝑤𝑡 % ) = 𝐼 𝐻𝐼 𝐻𝐹2𝑂𝑡𝑜𝑡 ×1𝑎 3 4 5 6 7 8 9 10 11 12 13 14 15 16 17 18 19 20 21 22 23 24 25 26 27 28 29 30 31 32 33 34 35 36 37 38 39 40 41 42 43 44 45 46 47 48 49 50 51 52 53 54 55 56 57 58 59 60
For Peer Review
215 With I H2Otot the maximum peak intensity at 3550 cm-1, HF the intensity taken at 960 cm-1
216 and a the correlation coefficient chosen for a basaltic composition (i.e., 0.26).
217 Quantifications have been done on at least 5 spectra. The estimated error on the quantification
218 method is ± 0.06 wt % H2O [41]. Therefore, the H2O errors mentioned in Table 2 are a
219 combination of 1) the error relative to the H2O homogeneity in the glass if above the error
220 calibration provided by Mercier et al. [41], 2) the calibration error (0.1 wt %) if H2O
221 homogeneity is lower than this value.
222 In Fig. 1B, spectra are normalized according to the concomitant HF peak intensity in Fig. 1A.
223 The PR glass with 4.5 wt % FeOtot dissolves 6.5 wt % H2O and shows the highest peak at 3550
224 cm-1 (i.e., PR-6Hb). The peak intensity is decreasing towards higher FeO
tot contents: for the
225 CL-3H-6h (with 16.0 wt % FeOtot) 0.9 wt % H2O is recovered. The highest 3550 cm-1 peak
226 intensity corresponds to the highest H2O content.
227 The derived H2O contents are reported in Table 2. High water content experiments at 1 GPa
228 have been measured for the PR composition with 4.1 and then 6.5 wt % H2O dissolved in the
229 melt with 5.7 and 6.5 wt % H2Oini, respectively (i.e., PR-6H-4h and PR-6Hb). Experiment with
230 0.9 wt % H2Oini, at 1 GPa, has been tested for the GC composition (i.e., GC-1H-4h sample).
231 Almost all the H2O initially added is recovered in the melt: 0.8 wt % H2O. Experiments with
232 more than 3 wt % H2O for the synthetic martian basalt compositions were performed at 1 GPa
233 but no quenched glass could be obtained. At 1.5 GPa, 0.8 wt % H2O is determined in
GCD-3H-234 6h-1.5GPa, with ~3 wt % H2Oini. Finally, at low pressure 0.9 wt % H2O is dissolved in the same
235 starting composition (i.e., GCD).
236 3.3. H2O quantification by FTIR versus Raman
237 FTIR spectroscopy has been conducted on several glass samples in order to investigate the
238 applicability of the Mercier et al. [41] calibration on Fe-rich basalts. Not all samples could be
3 4 5 6 7 8 9 10 11 12 13 14 15 16 17 18 19 20 21 22 23 24 25 26 27 28 29 30 31 32 33 34 35 36 37 38 39 40 41 42 43 44 45 46 47 48 49 50 51 52 53 54 55 56 57 58 59 60
For Peer Review
239 analyzed because of 1) sample size (small glass chips < 1mm); 2) quenched crystals at the rim
240 of the samples. Only pure glass chips with a size > 2 mm have been analyzed: 3H-6h,
GC-241 1H-4h, GCD-3H-6h, PR-3H-6h, PR-6H-4h and PR-6Hb. The determination of water content
242 by FTIR follows the Beer-Lambert equation [13, 14]:
243 (2) 𝐶𝐻2𝑂= 100 × 𝑀𝑀 × 𝐴𝑑 × 𝜌 × 𝜀
244 Where C is the H2Omol or OH- content in wt %, A the height of the band for OH- (4500 cm-1) or
245 H2Omol (5200 cm-1), MM the molar mass in g/mol (H2O or OH), d the thickness in cm, ρ the
246 density in g/L and ε the linear molar absorption coefficient in L/mol/cm.
247 For PR samples, we used the extinction coefficients derived from Ohlhosrt et al. [54] 0.56
248 L/mol/cm for both the peak at 4500 and 5200 cm-1. For our Fe-rich we used the extinction
249 coefficient given by Stolper [55] considering that the studied basalts are closer in composition
250 to ours. The molar absorptivity coefficients are 0.98 and 1.76 L/mol/cm for 4500 and 5200 cm-1,
251 respectively.
252 Glass density measurements were not possible considering the size of our glass chips. It was
253 calculated using the calibration of Schiavi et al. [43]; which takes into account the chemical
254 composition and is applicable to Fe-rich glass compositions.
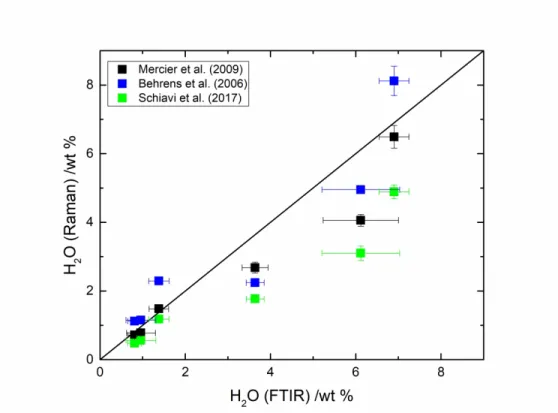
255 In Fig. 2, we observe that the H2O quantified with Mercier et al. [41] provided better
256 correspondence to the FTIR results. At low H2O content, for Fe-rich glasses, the H2O
257 quantification by Mercier et al. [41] is close to the 1:1 line. As an example, for the GC-3H-6h
258 sample, 1.4 wt % and 1.5 wt % H2O are determined by FTIR and Raman, respectively. At higher
259 H2O content (> 2 wt %), the results are more scattered, but still in reasonable agreement with
260 the FTIR results. For the water-rich sample (PR-6Hb), 6.9 wt % H2O is determined by FTIR,
261 where 6.5 is calculated by the method of Mercier et al. [41]. There is a strong discrepancy for
262 PR-6H-4h with 4.1 wt % H2O determined by Raman whereas 6.1 wt % is determined by FTIR.
3 4 5 6 7 8 9 10 11 12 13 14 15 16 17 18 19 20 21 22 23 24 25 26 27 28 29 30 31 32 33 34 35 36 37 38 39 40 41 42 43 44 45 46 47 48 49 50 51 52 53 54 55 56 57 58 59 60
For Peer Review
263 However, this sample has the highest error bar due to possible heterogeneity in the H2O
264 distribution with the glass.
265 In Fig. 2, the calibration provided by Behrens et al. [40] slightly overestimates the water content
266 for Fe-rich glasses at low H2O content. For GC-1H-4h, 1.1 wt % H2O is quantified with Raman
267 and 1.0 wt % by FTIR; although 0.9 wt % H2O was initially added before the experiment. The
268 discrepancy becomes more important at high H2O content in PR-6Hb glass: 8.1 wt % H2O by
269 Raman with 6.5 wt % H2Oini. However, it should be emphasized that the calibration is accurate
270 to 4.7 wt % H2O; and at higher content, the error in determining the amount of H2O will be
271 larger.
272 The calibration established by Schiavi et al. [43] shows good results for low H2O content in
273 Fig. 2 with 0.7 wt % for GC-1H-4h against 1.0 wt % H2O by FTIR. However, with increasing
274 H2O content, there is an increasing deviation with the FTIR results. This difference can be
275 ascribed by the high Fe content of basalts in Schiavi et al. [43] (FeOtot, > 7 wt %) compared to
276 our Fe-poor basalts (< 6 wt % FeOtot).
277 The comparison provided in Fig. 2 suggests that we can reasonably assess that the Raman
278 calibration established by Mercier et al. [41] is more appropriate to quantify H2O in our Fe-rich
279 and Fe-poor basaltic glasses. The results from all H2O quantifications by IR and Raman
280 spectroscopies are reported in the Table S1 (Supporting Information).
281
282 4. Discussion
283 4.1. H2O content in Fe-rich basalts
284 Differences between H2O dissolved in the melt and H2Oini can be observed for PR samples
285 (Table 2). For 5.7 wt % H2O added in PR-6H-4h experiment, less than 4 wt % H2O is dissolved.
3 4 5 6 7 8 9 10 11 12 13 14 15 16 17 18 19 20 21 22 23 24 25 26 27 28 29 30 31 32 33 34 35 36 37 38 39 40 41 42 43 44 45 46 47 48 49 50 51 52 53 54 55 56 57 58 59 60
For Peer Review
286 For 6.5 wt %, ~6.5 wt % H2O is recovered in the PR glass. Under these conditions (i.e. 1 GPa),
287 H2O solubility is close 7 wt % [56]. The difference between initial and final amount of H2O for
288 PR glasses is explained by the thermodynamic equilibrium of the H2O species in the liquid and
289 fluid phase [57]; by extension, there is a partitioning of H2O between the fluid phase and the
290 melt phase.
291 Some mixtures were not decarbonated and CO2 was present in the fluid phase during the
292 experiments. However after the experiments, no CO32- signal at 1080 cm-1 was observed by
293 Raman spectroscopy [37], implying that only hundreds ppm of CO2 could be dissolved. It is
294 consistent with previous studies that estimated the CO2 solubility in these iron-rich melt at ~0.3
295 wt % under oxidized conditions [27, 28].
296 The presented results in Fig. 1B and Table 2, suggest that increasing Fe content will induce a
297 substantial decrease in the H2O dissolution. For instance, if we compare the PR-3H-6h and
298 GCD-3H-6h samples with 2.9 and 2.7 wt % H2Oini, the total H2O dissolved in the melt is 2.8
299 and 0.7 wt % H2O, respectively. For those two experiments made at identical intensive
300 conditions and with no CO2 present, there is a difference of ~2 wt % between H2O dissolved
301 and the H2O initially loaded in the sample charge. The most likely hypothesis to explain this
302 difference is the change in the Fe content: ~13 wt % for GC samples and 5 wt % FeOtot for PR.
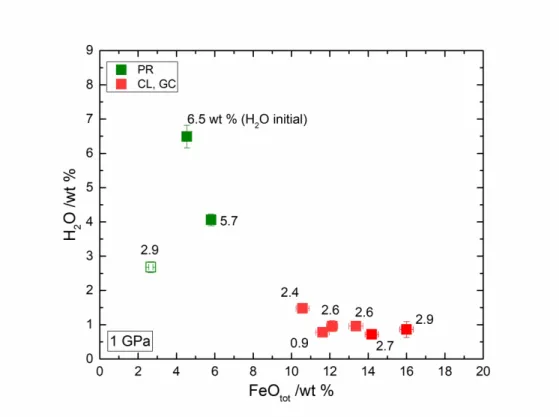
303 We have presented the H2O dissolved as a function of the FeOtot for 1 GPa experiments in Fig.
304 3. We observe a decrease of the H2O content from 6.5 wt % H2O at 5 wt % FeOtot for PR-6Hb,
305 to less than 1 wt % at 16 wt % FeOtot for CL-3H-6h (see Table 2). Hence, increasing the FeOtot
306 in the melt composition seems to hamper the H2O dissolution. This trend has also been shown
307 in the recent work of Hou et al. [57] investigating the immiscibility of an Fe-rich melt in
308 presence of H2O.
309 4.2. Peculiar H2O dissolution mechanisms in Fe-rich basalt
3 4 5 6 7 8 9 10 11 12 13 14 15 16 17 18 19 20 21 22 23 24 25 26 27 28 29 30 31 32 33 34 35 36 37 38 39 40 41 42 43 44 45 46 47 48 49 50 51 52 53 54 55 56 57 58 59 60
For Peer Review
310 Previous spectroscopic investigations [13, 45, 46, 54] have shown that H2O can dissolve in
311 silicate glasses as two main species: 1) hydroxyl groups (i.e., OH) or 2) molecular H2O (i.e.,
312 H2Omol). At low H2O content, OH is the predominant species to be formed in silicate glasses
313 owing to the water dissociation reaction:
314 (3) 𝐻2𝑂𝑚𝑒𝑙𝑡+ 𝑂2 ― → 2𝑂𝐻― 𝑚𝑒𝑙𝑡
315 This dissolution mechanism induces a depolymerization of the silicate network through the
316 formation of silanol groups (SiOH):
317 (4) 𝑆𝑖 ― 𝑂 ― 𝑆𝑖 + 𝐻2𝑂𝑓𝑙 → 2 𝑆𝑖𝑂𝐻
318 At higher H2O content, H2Omol becomes the dominant species whereas OH remains almost
319 constant. An additional H2O dissolution mechanism has been inferred in recent studies based
320 on Raman and NMR spectroscopic results [46, 58] and corresponds to the formation of Free
321 OH groups. It has been suggested that the formation of Free OH will induce a polymerization
322 of the silicate melt structure as the network modifying cation charges are consumed by the OH
-323 negative charges according to the following equation (5):
324 (5) 2𝑆𝑖 ― 𝑂― 𝑀𝑛 + + 𝐻
2𝑂𝑓𝑙𝑢𝑖𝑑 → 𝑆𝑖 ― 𝑂 ― 𝑆𝑖 + 𝑀𝑛 +𝑂𝐻𝑛
325 With M for cations (i.e., Ca, Mg, Fe) and n representing the charge of the cation.
326 A shoulder at 3660 cm-1 corresponding to Free OH vibrations [45-47] is observed for the
Fe-327 rich glass (CL-3H-6h) and the water-rich terrestrial analogue (PR-6Hb) in Fig. 1B. Coupled
328 with the shoulder at 3660 cm-1, a peculiar peak at 670 cm-1 has been detected for those two
329 spectra (Fig. 1A) with a Lorentzian shape. The occurrence of the 3660 and 670 cm-1 peaks
330 appear correlated, although the assignment of the 670 cm-1 peak to a peculiar vibration remains
331 to be determined. In the study of Di Genova et al. [42], Raman spectra acquired on Fe-rich
332 basaltic glasses exhibit a specific peak at ~690 cm-1 that is correlated with nanolite particles due
3 4 5 6 7 8 9 10 11 12 13 14 15 16 17 18 19 20 21 22 23 24 25 26 27 28 29 30 31 32 33 34 35 36 37 38 39 40 41 42 43 44 45 46 47 48 49 50 51 52 53 54 55 56 57 58 59 60
For Peer Review
333 to high Fe content, but also due to high H2O content. Furthermore, we have noticed that some
334 other experiments showed the same peaks: GC-H2O-chiller, GC-H2O-4h and
GCD-3H-6h-335 1.5GPa.
336 To determine the proportion of the 3660 cm-1 peak, we carried out spectrum simulation using 4
337 peaks: 3 Gaussians and one Voigt (combination of a Gaussian and a Lorentzian component).
338 Values of simulations are reported in the Supporting Information in Table S2. Typical
339 simulations for PR-6Hb and 3H-6h are shown in Fig. 4. In the simulations in Fig. 4,
CL-340 3H-6h sample exhibits ~17 % of Free OH and only 2 % is calculated for PR-6Hb.
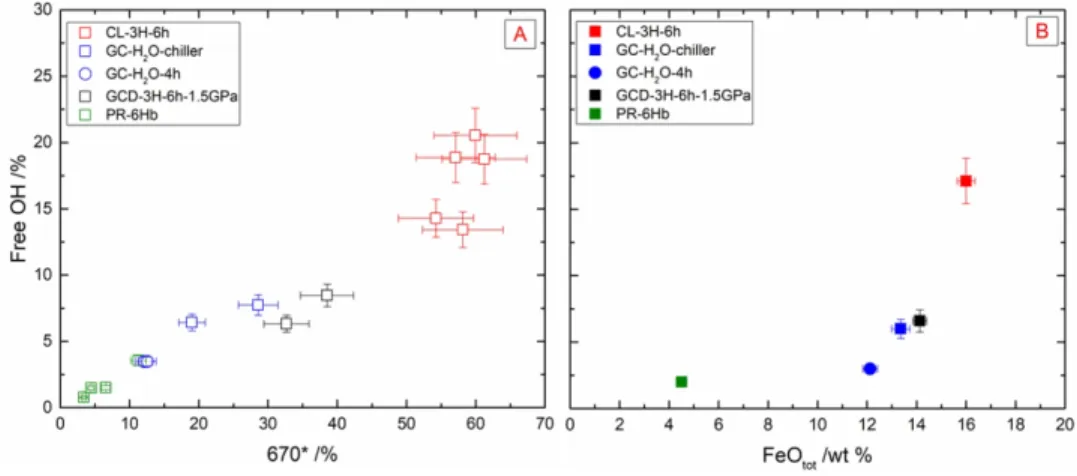
341 In Fig. 5A, we have reported the proportions of Free OH as a function of the proportion of the
342 670 cm-1 peak (i.e., 670* corresponding to the ratio between the 670 cm-1 area and the total area
343 of H2O) for the samples: CL-3H-6h,PR-6Hb, GC-H2O-chiller, GC-H2O-4h and
GCD-3H-6h-344 1.5GPa. Each data reported in this graph corresponds to the proportion determined from the
345 simulation of a given spectrum. In Fig. 5A, we observe a correlation between the percentage of
346 Free OH and the 670 cm-1 peak. The increase of the 670 cm-1 is correlated to an increase in Free
347 OH. For PR-6Hb, we measure the 670*= 6 % and Free OH= 2 %. For CL-3H-6h, we obtain
348 670* ~60 % and 20 % of Free OH.
349 In Fig. 5B, the Free OH percentages are represented against the FeOtot. The Free OH fraction
350 appears also correlated to the FeOtot in the sample. The Fe-rich sample, CL-3H-6h with 16.0 wt
351 % FeOtot, presents ~17 % of Free OH. The GC and GCD samples exhibit values from 3 to 7 %
352 of Free OH, with ~12 and ~14 wt % FeOtot, respectively. On the other hand, PR-6Hb with 4.5
353 wt % FeOtot, shows only 2 % of Free OH.
354 Previous works have shown that the formation of Free OH is observed 1) when H2O is
355 dissolving in a strongly depolymerized composition [57], 2) with high H2O concentrations [45],
356 and 3) in aqueous solutions [47]. The presence of Free OH is rather surprising in Fe-rich glasses
3 4 5 6 7 8 9 10 11 12 13 14 15 16 17 18 19 20 21 22 23 24 25 26 27 28 29 30 31 32 33 34 35 36 37 38 39 40 41 42 43 44 45 46 47 48 49 50 51 52 53 54 55 56 57 58 59 60
For Peer Review
357 investigated here considering that the total H2O content dissolved does not exceed 1 wt %. One
358 possible reason for the existence of Free OH groups in Fe-rich glasses could be ascribed to the
359 structural role of iron within the glass. Recovered Fe-rich glasses (i.e., GC and CL) from high
360 pressure experiments have a Fe ratio between Fe2+ / ∑Fe = 0.4 and 0.6, respectively (see Table
361 2) suggesting that Fe plays a network modifying role [59] within the glass when under its Fe2+
362 state. Although additional work is clearly needed to better characterize the correlation between
363 the Free OH groups the Fe redox state; it is possible that Fe2+ has a high affinity to form isolated
364 complexes with OH.
365 The observation of Free OH in Fe-rich melt at low H2O content (~1 wt %) has implications on
366 the mineralogical composition at the Mars surface. The formation of Free OH molecular
367 clusters could constitute a precursor for an immiscible Fe-rich phase; in a similar manner to the
368 immiscibility observed between carbonatite and silicate melts owing to the formation of Free
369 carbonates [60]. Previous spatial missions identified multiple forms of Fe-oxides, mostly
370 hematite and magnetite at the surface of Mars [61-63]. The separation of Fe-(OH)2 rich phase
371 could favor the formation of Fe-oxides by weathering of the basalt at the surface.
372 4.3. Evolution of the silicate network signature as a function of the Fe redox state
373 estimation
374 The presence of Free OH should induce a change on the overall silicate network considering
375 that Fe2+ cations are scavenged by the OH species. Therefore, the deficit of positive charges
376 from the network modifying cations should induce an increase in the degree of polymerization
377 according to the reaction (6):
378 (6) 2𝑄𝑛+𝐹𝑒2 + + 𝐻
2𝑂 = 2 𝑄𝑛 + 1+𝐹𝑒(𝑂𝐻)2
379 This reaction equivalent to Eq. 5 shows that Qn species proportions are changing due to the
380 formation of Free OH clusters. For instance, Q3 species should merge to form Q4 species upon
3 4 5 6 7 8 9 10 11 12 13 14 15 16 17 18 19 20 21 22 23 24 25 26 27 28 29 30 31 32 33 34 35 36 37 38 39 40 41 42 43 44 45 46 47 48 49 50 51 52 53 54 55 56 57 58 59 60
For Peer Review
381 the dissolution of water as Free OH clusters. This change is likely to be observed by Raman
382 spectroscopy.
383 The HF region is a composition of several Gaussians peaks [60] referred to a Qn species with,
384 n the number of bridging O varying from 0 to 4. We conducted spectrum deconvolution of the
385 HF region that are exhibited in Fig. 6. The results from the deconvolutions are reported in the
386 Table S2 (Supporting Information). The deconvolutions of the Raman spectra for PR-6H-4h,
387 GCD-3H-6h and CL-3H-6h (i.e. synthetic martian basalts) are reported in Fig. 6. The
388 assignment of each Gaussian line is based on previous works [64]: Q4 at 1080 cm-1, Q3 at ~1020
389 cm-1, Q2 at ~950 cm-1 and Q1 at ~880 cm-1.
390 For the PR-6H-4h sample, the deconvolution shows that the Q3 (~1010 cm-1) is the most intense
391 peak whereas the GCD sample shows a more intense peak at lower Raman shift with the Q2
392 (~950 cm-1), leading to less polymerized network. Then, for the CL sample, we can see that the
393 Q2 peak is more intense but the Q3 is almost at the same height.
394 Regarding solely at the Fe2+ content reported in Fig. 6, we can see an increase of the Fe2+ content
395 in the melt from the PR-6H-4h toward CL-3H-6h. Indeed, if the GCD sample is the most
396 oxidized, the bulk Fe2+ is higher as compared to the PR sample: 5.4 and 4.2 wt % Fe2+,
397 respectively. The presence of high Fe2+ content enhances the depolymerization of the structure,
398 which is confirmed by the deconvolution of the GCD glass in Fig. 6. Then, the low content of
399 Fe2+ coupled with the high SiO
2 content (> 51 wt %) of the PR-6H-4h sample enable a
400 polymerization of the silicate glass. We can see that the iron-rich composition (CL sample) is
401 richer in Fe2+ species (9.8 wt %). Hence, we expected a more depolymerized structure correlated
402 with the high Fe2+ in the melt. However, the opposite behavior is observed from subsequent
403 simulation reported in Fig. 6.
3 4 5 6 7 8 9 10 11 12 13 14 15 16 17 18 19 20 21 22 23 24 25 26 27 28 29 30 31 32 33 34 35 36 37 38 39 40 41 42 43 44 45 46 47 48 49 50 51 52 53 54 55 56 57 58 59 60
For Peer Review
404 In order to discriminate the possible effect of Free OH related to Fe2+ on the degree of
405 polymerization, we represent in the Fig. 7 the ratio of Q4 over the sum of Qn species as a function
406 of Fe2+ normalized by the H
2O content. We choose to show the change in Q4 species as this is
407 the most polymerized unit (4 bridging oxygens) and the trend is the best obtained between the
408 Qn species; however, trends for the other species can be found in the Fig. S1 (Supporting
409 information). The deconvolution of glasses obtained at all pressures associated with a relative
410 error of 10 % are reported in Fig. 7. The Fig. 7 shows two major information. 1) Increasing Fe2+
411 in the glass induces a decrease in the fraction of Q4 (from 0.23 to 0.16 between Fe2+/H
2O ~1 to
412 11) and therefore a depolymerization of the glass. These results appear consistent with the
413 suggested role of Fe2+ as a network modifier. 2) Free OH species have only a limited effect on
414 the degree of polymerization for PR-6H-4h (without Free OH) and PR-6Hb (with Free OH)
415 Q4/∑Qn = 0.23 and 0.26. The same applies for 6h without Free OH and
GCD-3H-416 1.5G with Free OH: 0.18 and 0.19, respectively.
417 We expected measurable effect of Free OH with the increase of the polymerization degree
418 observed in Fig. 6 (CL-3H-6h). Several aspects could explain the absence of effect shown in
419 Fig. 7: 1) although the Free OH are visible in Raman spectra, their abundance is small compared
420 to the H2Otot.; Thus the effect on the degree of polymerization is not visible or within error the
421 Qn simulation, 2) it is also possible that the Free OH species are not exclusively linked to Fe2+
422 and other cations such as Mg2+ and Ca2+ form Free OH clusters. However, the trend observed
423 in Fig. 5B strongly favors an affinity of OH- with Fe2+.
424
425 Summary
426 In the present work, we have shown that Fe concentration in glass has a non-negligible effect
427 on the H2O dissolution within the melt structure. Increasing the Fe content appears to induce a
3 4 5 6 7 8 9 10 11 12 13 14 15 16 17 18 19 20 21 22 23 24 25 26 27 28 29 30 31 32 33 34 35 36 37 38 39 40 41 42 43 44 45 46 47 48 49 50 51 52 53 54 55 56 57 58 59 60
For Peer Review
428 decrease in the H2O dissolution. This result has major implications for Mars, notably for the
429 transport of H2O in Fe-rich melt from the mantle to the surface that will be less efficient than
430 on Earth.
431 We inferred the formation of Free OH in Fe-rich glasses (i.e., martian basalt analogues) at
432 relatively low H2O content (~1 wt %) whereas such molecular groups appear at very high H2O
433 content for terrestrial basaltic glasses (> 6 wt %). The presence of Free OH molecular clusters
434 seems to be dependent on the Fe content by increasing with FeOtot. In detail, Free OH species
435 are likely to be correlated to the Fe2+ in Fe-rich composition. Free OH are supposed to induce
436 a polymerization effect on the silicate network; although further work is currently needed to
437 investigate the exact molecular configuration in the surrounding of cations forming Free OH
438 groups. The possibility for Free OH in the vicinity of Fe2+ cations represents a precursor for
439 producing Fe-rich mineral phases through weathering of the erupted Fe-rich basalts, which will
440 be consistent with Fe-oxides found at Mars surface.
441
442 Acknowledgements:
443 The author is thankful for the Centre National d’Etudes Spatiales (CNES), the Région Pays de
444 la Loire and the Programme National de Planétologie for funding the present work. We also
445 want to acknowledge the Laboratoire de Planétologie et Géodynamique, the IFREMER of Brest
446 and the Institut des Matériaux Jean Rouxel of Nantes to allow us to perform our experiments
447 and analyses. 448 449 450 3 4 5 6 7 8 9 10 11 12 13 14 15 16 17 18 19 20 21 22 23 24 25 26 27 28 29 30 31 32 33 34 35 36 37 38 39 40 41 42 43 44 45 46 47 48 49 50 51 52 53 54 55 56 57 58 59 60
For Peer Review
451 References
452 [1] Squyres, S.W., Grotzinger, J.P., Arvidson, R.E., Bell III, J.F., Calvin, W., Christensen, P.R.
453 et al. In Situ evidence for an ancient aqueous environment at Meridiani Planum, Mars. Science.
454 2004a; 306, 1709-1714.
455 [2] Squyres, S.W., Arvidson, R.E., Bell III, J.F., Brückner, J., Cabol, N.A., Calvin, W., Carr,
456 M.H., Christensen, P.R. et al., The Opportunity Rovers’s Athena Science investigation at
457 Meridiani Planum, Mars. Science. 2004b; 303, 1698-1703.
458 [3] Tosca, N.J. and Knoll, A.H., Juvenile chemical sediments and the long term persistence of
459 water at the surface of Mars. Earth Planet. Sci. Lett. 2009; 286, 379 – 386.
460 [4] Gross, S.H., McGovern, W.E., Rasool, S.I., Mars: Upper Atmosphere. Science. 1966; 151,
461 1216-1221.
462 [5] Dreibus, G. and Wänke, H., Mars, a volatile-rich planet. Meteoritics. 1985; 20, 367-381.
463 [6] Carr, M.H., Recharge of the early atmosphere of Mars by impact-induced release of CO2.
464 Icarus, 1989; 79, 311-327.
465 [7] Mangold, N., and others,Classification scheme for sedimentary and igneous rocks in Gale
466 crater, Mars. Icarus. 2017; 284, 1-17.
467 [8] Bandfield, J.L., Hamilton, V.E., Christensen, P.R., A global view of Martian surface
468 composition from MGS-TES. Science. 2000; 287, 1626-1630.
469 [9] McSween, H.Y., Taylor, G.J., Wyatt, M.B., Elemental Composition of the Martian Crust.
470 Science. 2009; 324, 736-739. 3 4 5 6 7 8 9 10 11 12 13 14 15 16 17 18 19 20 21 22 23 24 25 26 27 28 29 30 31 32 33 34 35 36 37 38 39 40 41 42 43 44 45 46 47 48 49 50 51 52 53 54 55 56 57 58 59 60
For Peer Review
471 [10] Baratoux, D., Toplis, M.J., Monnereau, M., Sautter, V., The petrological expression of
472 early Mars volcanism. J. Geophys. Res.: Planets. 2013; 118, 59-64.
473 [11] Sautter, V. and others, Magmatic complexity on early Mars as seen through a combination
474 of orbital, in-situ and meteorite data. Lithos. 2016; 254-255, 36-52.
475 [12] Cousin, A., Sautter, V., Payré, V., Forni, O., Mangold, N., Gasnault, O., Le Deit, L.,
476 Johnson, J., Maurice, S., Salvatore, M., Wiens, R.C., Gasda, P., Rapin, W., Classification of
477 igneous rocks analyzed by ChemCam at Gale Crater, Mars. Icarus. 2017; 288, 265-283.
478 [13] Dixon, J. E., & Stolper, E. M., An experimental study of water and carbon dioxide
479 solubilities in mid-ocean ridge basaltic liquids. Part II. J. Petrol. 1995; 36, 1633–1646.
480 [14] Morizet, Y., Paris, M., Gaillard, F., Scaillet, B., C-O-H fluid solubility in haplobasalt under
481 reducing conditions: An experimental study. Chem. Geol. 2010; 279, 1-16.
482 [15] Jugo, J., Luth, R.W., Richards, J.P., An experimental study of the sulfur content in basaltic
483 melts saturated with immiscible sulfide luquids at 1300°C and 1.0 GPa. J. Petrol. 2005; 46, 783
484 – 798.
485 [16] Shishkina, T. A., Botcharnikov, R. E., Holtz, F., Almeev, R. R., Jazwa, A. M., & Jakubiak,
486 A. A., Compositional and pressure effects on the solubility of H2O and CO2 in mafic melts.
487 Chem. Geol. 2014; 388, 112–129.
488 [17] Brey, G., & Green, D. H., Solubility of CO2 in Olivine Melilitite at High Pressures and
489 Role of CO2 in the Earth’s Upper Mantle. Contrib. Mineral. Petrol. 1976; 55, 217–230.
3 4 5 6 7 8 9 10 11 12 13 14 15 16 17 18 19 20 21 22 23 24 25 26 27 28 29 30 31 32 33 34 35 36 37 38 39 40 41 42 43 44 45 46 47 48 49 50 51 52 53 54 55 56 57 58 59 60
For Peer Review
490 [18] Brooker, R. A., Kohn, S. C., Holloway, J. R., & Mcmillan, P. F., Structural controls on
491 the solubility of CO2 in silicate melts Part I : bulk solubility data. Chem. Geol. 2001; 174, 225–
492 239.
493 [19] Moussallam, Y., Morizet, Y., Massuyeau, M., Laumonier, M., Gaillard, F., CO2 solubility
494 in kimberlite melts. Chem. Geol.2014; 418, 198 – 205.
495 [20] Moussallam, Y., Morizet, Y., Gaillard, F., Unconventional H2O-CO2 solubility in
496 kimberlite defines the depth of pipe root zone. Earth Planet. Sci. Lett. 2016; 447, 151 – 160.
497 [21] Filiberto, J., Experimental constraints on the parental liquid of the Chassigny meteorite: A
498 possible link between the Chassigny meteorite and a Martian Gusev basalt. Geochim.
499 Cosmochim. Acta. 2008; 72, 690-701.
500 [22] McCubbin, F. M., Hauri, E. H., Elardo, S. M., Vander Kaaden, K. E., Wang, J., & Shearer,
501 C. K., Hydrous melting of the martian mantle produced both depleted and enriched shergottites.
502 Geology. 2012; 40, 683–686.
503 [23] Weis, F.A., Bellucci, J.J., Skogby, H., Stalder, R., Nemchin, A.A., Whitehouse, M.J.,
504 Water content in the Martian mantle: A Nakhla perspective. Geochim. Cosmochim. Acta. 2017;
505 212, 84 – 98.
506 [24] Wadhwa, M., Redox state of Mars’ upper mantle and crust from Eu anomalies in
507 Shergottite pyroxenes. Science. 2001; 23, 1527 – 1530.
508 [25] Herd, C.D.K., The oxygen fugacity of olivine-phyric martian basalts and the components
509 within the mantle and crust of Mars. Meteorit. Planet. Sci. 2003; 38, 1793 – 1805.
3 4 5 6 7 8 9 10 11 12 13 14 15 16 17 18 19 20 21 22 23 24 25 26 27 28 29 30 31 32 33 34 35 36 37 38 39 40 41 42 43 44 45 46 47 48 49 50 51 52 53 54 55 56 57 58 59 60
For Peer Review
510 [26] Schmidt, M.E., Schrader, C.M., McCoy, T.J., The primary fO2 of basalts examined by the
511 Spirit rover in Gusev Crater, Mars: Evidence for multiple redox states in the martian interior.
512 Earth Planet. Sci. Lett. 2013; 384, 198 – 208.
513 [27] Stanley, B.D., Hirschmann, M.M., Withers, A.C., CO2 solubility in Martian basalts and
514 Martian atmospheric evolution. Geochim. Cosmochim. Acta. 2011; 75, 5987 – 6003.
515 [28] Stanley, B.D., Schaub, D.R., Hirschmann, M.M., CO2 solubility in primitive martian
516 basalts similar to Yamato 980459, the effect of composition on CO2 solubility of basalts, and
517 the evolution of the martian atmosphere. Am. Min. 2012; 97, 1841 – 1848.
518 [29] Stanley, B.D., Hirschmann, M.M., Withers, A.C. (2014): Solubility of C-O-H volatiles in
519 graphite-saturated martian basalts. Geochim. Cosmochim. Acta, 129, 545 – 76.
520 [30] Armstrong, L.S., Hirschmann, M.M, Stanley, B.D., Falksen, E.G., Jacobsen, S.D.,
521 Speciation and solubility of reduced C-O-H-N volatiles in mafic melts: Implications for
522 volcanism, atmospheric evolution, and deep volatile cycles in the terrestrial planets. Geochim.
523 Cosmochim. Acta. 2015; 171, 283 – 302.
524 [31] Médard, E., Grove, T. L., Early hydrous melting and degassing of the Martian interior. J.
525 Geophys. Res.:Planets. 2006; 111, E11003.
526 [32] McCubbin, F.M., Nekvasil, H., Harrington, A.D., Elardo, S.M., Lindsley, D.H.,
527 Compositional diversity and stratification of the Martian crust: Inferences from crystallization
528 experiments on the picrobasalt Humphrey from Gusev Crater, Mars. J. Geophys. Res. 2008;
529 113, 1 – 16. 3 4 5 6 7 8 9 10 11 12 13 14 15 16 17 18 19 20 21 22 23 24 25 26 27 28 29 30 31 32 33 34 35 36 37 38 39 40 41 42 43 44 45 46 47 48 49 50 51 52 53 54 55 56 57 58 59 60
For Peer Review
530 [33] Nekvasil, H., McCubbin, F.M., Harrington, A., Elardo, S., Lindsley, D.H., Linking the
531 Chassigny meteorite and the Martian surface rock Backstay: Insights into igneous crustal
532 differenciation processes on Mars. Meteorit. Planet. Sci. 2009; 44, 853 – 869.
533 [34] Noguchi, N., Shinoda, K., and Masuda, K., Quantitative analysis of binary mineral
534 mixtures using Raman microspectroscopy: Calibration curves for silica and calcium carbonate
535 minerals and application to an opaline silica nodule of volcanic origin. J. Mineral. Petrol. Sci.
536 2009; 104, 253-262.
537 [35] Kristova, P., Hopkinson, L., Rutt, K., Hunter, H., Cressey, G., Quantitative analyses of
538 powdered multi-minerallic carbonate aggregates using a portable Raman spectrometer. Am.
539 Min. 2013; 98, 401- 409.
540 [36] Larre, C., Morizet, Y., Guillot-Deudon, C., Baron, F., Mangold, N., Quantitative Raman
541 calibration of sulfate-bearing polymineralic mixtures: a S quantification in sedimentary rocks
542 on Mars. Min. Mag. 2018; 1-38.
543 [37] Morizet, Y., Brooker, R.A., Iacono-Marziano, G., Kjarsgaard, B.A., Quantification of
544 dissolved CO2 in silicate glasses using micro-Raman spectroscopy. Am. Min. 2013a; 98,
1788-545 1802.
546 [38] Morizet, Y., Gennaro, E., Jego, S., Zajacz, Z., Iacono-Marziano, G., Pichavant, M., Di
547 Carlo, I., Ferraina, C., Lesne, P., A Raman calibration for the quantification of SO42- groups
548 dissolved in silicate glasses: Application to natural melt inclusions. Am. Min. 2017a; 102,
2065-549 2076.
550 [39] Zajacz, Z., Halter, W., Malfait, W.J., Bachmann, O., Bodnar, R.J., Hirschmann, M.M.,
551 Mandeville, C.W., Morizet, Y., Müntener, O., Ulmer, P., Webster, J.D., A
composition-3 4 5 6 7 8 9 10 11 12 13 14 15 16 17 18 19 20 21 22 23 24 25 26 27 28 29 30 31 32 33 34 35 36 37 38 39 40 41 42 43 44 45 46 47 48 49 50 51 52 53 54 55 56 57 58 59 60
For Peer Review
552 independent quantitative determination of the water content in silicate glasses and silicate melt
553 inclusions by confocal Raman spectroscopy. Contrib. Mineral. Petrol. 2005; 150, 631-642.
554 [40] Behrens, H., Roux, J., Neuville, D. R., & Siemann, M., Quantification of dissolved H2O
555 in silicate glasses using confocal microRaman spectroscopy. Chem. Geol, 2006; 229, 96–112.
556 [41] Mercier, M., Di Muro, A., Giordano, D., Métrich, N., Lesne, P., Pichavant, M., Scaillet,
557 B., Clocchiatti, R., Montagnac, G., Influence of glass polymerization and oxidation on
micro-558 Raman water analysis in alumino-silicate glasses. Geochim. Cosmochim. Acta.2009; 73,
197-559 217.
560 [42] Di Genova, D., Sicola, S., Romano, C., Vona, A., Fanara, S., Spina, L., Effect of iron and
561 nanolites on Raman spectra of volcanic glasses: A reassessment of existing strategies to
562 estimate the water content. Chem. Geol. 2017; 475, 76-86.
563 [43] Schiavi, F., Bolfan-Casanova, N., Withers, A.C., Médard, E., Laumonier, M., Laporte, D.,
564 Flaherty, T., Gomez-Ulla, A., Water quantification in silicate glasses by Raman spectroscopy:
565 Correcting for the effects of confocality, density and ferric iron. Chem. Geol. 2018; 483, 312 –
566 331.
567 [44] Kägi, R., Müntener, O., Ulmer, P., Ottolini, L., Piston-cylinder experiments of H2O
568 undersaturated Fe-bearing systems: An experimental setup approaching fO2 conditions of
569 natural calc-alkaline magmas. Am. Min. 2005; 90, 708 – 717.
570 [45] Mysen, B.O. and Virgo, D., Volatiles in silicate melts at high pressure and temperature:
571 interaction between OH groups and Si4+, Al3+, Ca2+, Na+ and H+. Chem. Geol. 1986; 57,
303-572 331. 3 4 5 6 7 8 9 10 11 12 13 14 15 16 17 18 19 20 21 22 23 24 25 26 27 28 29 30 31 32 33 34 35 36 37 38 39 40 41 42 43 44 45 46 47 48 49 50 51 52 53 54 55 56 57 58 59 60
For Peer Review
573 [46] Mysen, B.O. and Cody, G.D., Solution mechanisms of H2O in depolymerized peralkaline
574 melts. Geochim. Cosmochim. Acta. 2005; 69, 5557 – 5566.
575 [47] Corridoni, T., Sodo, A., Bruni, F., Ricci, M.A., Nardone, M., Probing water dynamics with
576 OH-. Chem. Phys. 2007; 336, 183-187.
577 [48] Brugier, Y.-.A., Alletti, M., Pichavant, M., Fe pre-enrichment: A new method to counteract
578 iron loss in experiments on basaltic melts. Am. Min. 2015; 100, 2106 – 2111.
579 [49] Wilson, A.D., The micro-determination of Fe2+ in silicate minerals by a volumetric and a
580 colorimetric method. Analyst. 1960; 85, 823 – 827.
581 [50] Schuessler J.A., Botcharnikov R.E., Behrens H., Misiti V. and Freda C., Oxidation state
582 of iron in hydrous phono-tephritic melts. Am. Min. 2008; 93, 1493-1504.
583 [51] Govindaraju, K., 1994 Compilation of working values and sample description for 383
584 geostandards. Geostand. Newsl. 1994; 18, 1 – 158.
585 [52] McMillan, P. and Piriou, B., The structures and vibrational spectra of crystals and glasses
586 in the silica-alumina system. J. Non-Cryst. Solids. 1982; 53, 279-298.
587 [53] Freund, F., Wengeler, H., Kathrein, H., Knobel, R., Oberheuser, G., Maiti, G.C., Reil, D.,
588 Knipping, U., Kötz, J., Hydrogen and carbon derived from dissolved H2O and CO2 in minerals
589 and melts. Bull. Mineral. 1982; 106, 185 – 200.
590 [54] Ohlhorst, S., Behrens, H., Holtz, F., Compositional dependence of molar absorptivities of
591 near-infrared OH- and H2O bands in rhyolitic to basaltic glasses. Chem. Geol. 2001; 174, 5 –
592 20. 3 4 5 6 7 8 9 10 11 12 13 14 15 16 17 18 19 20 21 22 23 24 25 26 27 28 29 30 31 32 33 34 35 36 37 38 39 40 41 42 43 44 45 46 47 48 49 50 51 52 53 54 55 56 57 58 59 60
For Peer Review
593 [55] Stolper, E., Water in silicate glasses: An infrared spectroscopic study. Contrib. Mineral.
594 Petrol. 1982; 81, 1 – 17.
595 [56] Newman, S. and Lowenstern, J.B., VolatileCalc: a silicate melt-H2O-CO2 solution model
596 written in Visual Basic for excel. Comput. Geosci. 2001; 28, 597 – 604.[57] Papale, P.,
597 Modeling of the solubility of a two-component H2O + CO2 fluid in silicate liquids. Am. Min.
598 1999; 84, 477 – 492.
599 [57] Hou, T., Charlier, B., Holtz, F., Veksler, I., Zhang, Z., Thomas, R., Namur, O., Immiscible
600 hydrous Fe-Ca-P melt and the origin of iron oxide-apatite ore depostits. Nat. Commun. 2018;
601 9, 1-8.
602 [58] Xue, X., and Kanzaki, M., Dissolution mechanisms of water in depolymerized silicate
603 melts: Constraints from 1H and 29Si NMR spectroscopy and ab initio calculations. Geochim.
604 Cosmochim. Acta. 2004; 68, 5027 – 5057.
605 [59] Mysen B.O. Relations between Structure, Redox, Equilibria of Iron, and Properties of
606 Magmatic Liquids. Adv. Phys. Geochem. 1991; 9, 41-98.
607 [60] Morizet, Y., Florian, P., Paris, M., Gaillard, F., O17 NMR evidence of free ionic clusters
608 Mn+ CO
32- in silicate glasses: Precursors for carbonate-silicate liquids immiscibility. Am. Min.
609 2017b; 102, 1561 – 1564.
610 [61] Morris, R.V. et al., Mineralogy at Gusev Crater from the Mössbauer Spectrometer on the
611 Spirit Rover. Science. 2004; 305, 833 – 836.
612 [62] Bribing, J.-P., Langevin, Y., Mustard, J.F., Poulet, F., Arvidson, R., Gendrin, A., Gondet,
613 B., Mangold, N., Pinet, P., Forget, F. and the OMEGA team, Global mineralogical and aqueous
614 Mars history derived from OMEGA/Mars Express Data. Science. 2006; 312, 400 – 403.
3 4 5 6 7 8 9 10 11 12 13 14 15 16 17 18 19 20 21 22 23 24 25 26 27 28 29 30 31 32 33 34 35 36 37 38 39 40 41 42 43 44 45 46 47 48 49 50 51 52 53 54 55 56 57 58 59 60
For Peer Review
615 [63] Le Deit, L., Le Mouélic, S., Bourgeois, O., Combe, J.-P., Mège, Sotin, C., Gendrin, A.,
616 Hauber, E., Mangold, N., Bribing J.-P., Ferric oxides in East Candor Chasma, Valles Marineris
617 (Mars) inferred from analysis of OMEGA/Mars Express data : Identification and geological
618 interpretation. J. Geophys. Res. 2008; 113, 1 – 18.
619 [64] Mysen, B.O., Virgo, D., Seifert, F.A., The structure of silicate melts: implications for
620 chemical and physical properties of natural magma. Rev. Geophys. Space Phys. 1982; 20, 353
621 – 383. 622 623 624 625 626 627 628 629 630 631 632 633 3 4 5 6 7 8 9 10 11 12 13 14 15 16 17 18 19 20 21 22 23 24 25 26 27 28 29 30 31 32 33 34 35 36 37 38 39 40 41 42 43 44 45 46 47 48 49 50 51 52 53 54 55 56 57 58 59 60
For Peer Review
634 Tables:
635 Table 1: Starting compositions for PR (natural glass of Popping Rock) an Earth basalt analogue, CL and 636 GC synthetic martian basalts.
637 638 639 640 641 642 643 644 645 646 647 648 649 650 651 652 653 654 655 Oxides (wt %) PR a GC b CLb SiO2 50.3 48.1 46.5 TiO2 1.8 Al2O3 14.8 10.2 8.2 FeO 8.8 15.5 23.5 Fe2O3 1.3 MnO 0.2 MgO 7.7 13.1 9.8 CaO 10.8 8.1 7.6 Na2O 2.9 4.9 4.3 K2O 0.7 P2O5 0.3 Total 99.6 100.0 100.0 NBO/T c 0.38 0.56 0.33 d 𝐹𝑒2 + ∑𝐹𝑒 0.03 (1) 0.02 (1) Notes :
a Natural glass of Popping Rock
b Synthetic analogues to Martian basalt (> 15 wt % FeO)
c Calculated on the basis of Fe in its tetrahedral coordination (i.e. Fe3+), acting as a
network former like Si, Al and Ti tetrahedron. NBO/T parameter ranging from 0 to 4. Calculations made on an anhydrous basis
d𝐹𝑒 Ratio calculated from wet chemistry analyses for decarbonated powders. 2 +
∑𝐹𝑒
Standards errors (1 σ) are reported in brackets at 10-2
3 4 5 6 7 8 9 10 11 12 13 14 15 16 17 18 19 20 21 22 23 24 25 26 27 28 29 30 31 32 33 34 35 36 37 38 39 40 41 42 43 44 45 46 47 48 49 50 51 52 53 54 55 56 57 58 59 60
For Peer Review
30 656 657 CO2 (wt %) 3.5 3.5 3.5 3.5 3.1 P (GPa) 1 1 1 1 1 1.5 0.5 1 1 1 1 T (°C) 1600 1600 1600 1600 1600 1600 1600 1600 1600 1600 1500 t (h) 1 4 6 4 6 6 6 6 6 4 1 SiO2 48.6 (8) 50.1 (3) 50.9 (3) 51.1 (3) 48.5 (2) 47.8 (4) 49.4 (2) 50.9 (2) 54.8 (3) 51.2 (3) 51.14 (20) TiO2 1.9 (1) 1.7 (1) 1.51 (6) Al2O3 11.5 (5) 10.7 (4) 10.8 (2) 10.6 (2) 10.2 (2) 10.4 (20) 10.9(1) 8.7 (2) 15.2 (3) 14.5 (3) 14.49 (11) FeOtot 13.4 (4) 12.1 (3) 10.6 (3) 11.6 (3) 14.2 (3) 14.1 (3) 13.4(1) 16.0 (4) 2.7 (1) 5.8 (2) 4.54 (11) MnO 0.1 (0) 0.1 (0) 0.11 (2) MgO (1.0)12.7 12.7 (4) 12.8 (3) 12.9 (3) 12.3 (3) 12.0 (3) 11.3(1) 10.0 (1) 7.9 (2) 7.4 (2) 8.45 (21) CaO 5.9 (1) 5.6 (3) 5.9 (2) 6.0 (1) 6.9 (3) 6.6 (2) 7.6(1) 5.6 (2) 10.7 (2) 10.1 (3) 10.71 (18) Na2O 3.6 (3) 4.0 (6) 4.3 (2) 4.5 (1) 4.2 (3) 3.7 (3) 5.1(1) 4.0 (2) 3.0 (1) 2.5 (1) 3.13 (5) K2O 0.7 (0) 0.7 (0) 0.61 (3) P2O5 0.3 (1) 0.3(1) 0.26 (3) Total 95.6 95.2 95.3 96.8 96.4 94.7 97.8 95.3 95.2 92.8 93.61 H2Ofinal (wt %) 1.0 (1) 1.0 (2) 1.5 (1) 0.8 (1) 0.7 (1) 0.8(1) 0.9 (1) 0.9 (2) 2.7 (2) 4.1 (2) 6.5 (3) Free OH (%) 6.0 3.0 6.6 17.1 2.0 b 𝐹𝑒2 + ∑𝐹𝑒 0.47 0.49 0.53 0.57 0.37 0.46 0.44 0.58 0.83 0.70 0.82 Notes:a Final chemical compositions determined by SEM only b 𝐹𝑒 Ratio calculated from wet chemistry analyses
2 + ∑𝐹𝑒 3 4 5 6 7 8 9 10 11 12 13 14 15 16 17 18 19 20 21 22 23 24 25 26 27 28 29 30 31 32 33 34 35 36 37 38 39 40 41 42 43 44 45 46 47 48 49 50 51 52 53 54 55 56 57 58
For Peer Review
658 Table 2: Experimental settings for the different samples (P, T, t, H2O content). Chemical compositions of the samples 659 determined by EPMA and SEM analyses. Final content of H2O and FeOtot are also reported, associated with wet 660 chemistry results. The Free OH percentages are added for samples presenting the features at 3660 cm-1. The 661 calculation of Free OH percentages is made on the deconvolution of the H2O area. Detailed of deconvolutions are 662 reported in the Table S2 (Supporting Information). Standards errors (1 σ) are reported in brackets at 10-1. The 663 associated standard errors of wet chemistry measurements are 0.01.
664
665 Supporting Information Tables:
PR-3H-6h PR-6H-4h PR-6Hb GC-3H-6h GC-1H-4h GCD-3H-6h
ε4500 * 0.56 a 0.56 0.56 0.98 b 0.98 0.98
ε5200 0.56 0.56 0.56 1.76 1.76 1.76
Density ** (g/L) 2789 2765 2722 2815 2832 2833
H2O wt % (FTIR) 3.6 (3) 6.1 (9) 6.9 (4) 1.4 (2) 1.0 (3) 0.8 (2) H2O from Raman spectroscopy (% wt):
Mercier et al. [41] 2.7 (2) 4.1 (2) 6.5 (3) 1.5 (1) 0.8 (1) 0.7 (1)
Behrens et al. [40] 2.2 (1) 5.0 (1) 8.1 (4) 2.3 (1) 1.1 (1) 1.1 (1)
Schiavi et al. [43] 1.4 (1) 3.0 (1) 4.9 (3) 1.4 (2) 0.7 (2) 0.7 (2)
Notes :
* : extinction coefficient L/mol/cm
** : calculated according to Schiavi et al. [43] a: From Ohlhorst et al. [54]
b: From Stolper [55]
666
667 Table S1: FTIR and Raman H2O quantifications. Description of the parameters chosen for FTIR calculations. 668 669 670 671 672 3 4 5 6 7 8 9 10 11 12 13 14 15 16 17 18 19 20 21 22 23 24 25 26 27 28 29 30 31 32 33 34 35 36 37 38 39 40 41 42 43 44 45 46 47 48 49 50 51 52 53 54 55 56 57 58 59 60
For Peer Review
32 674
675 Table S2: Deconvolution results for each sample in the HF (800 – 1250 cm-1) region and the H
2O region (3000 – 4000 cm-1). For each deconvolution, the 676 position peak is first described, then the FWHM (i.e., Full Width at Half Maximum) and the area percentage (area %). The addition of D1 to D3 coupled with 677 the Free OH peak represents the entire H2O vibration.
GC-H2O-chiller GC-H4h2O- GC-3H-6h GC-1H-4h 3H-6hGCD- GCD-3H-6h-1.5G GCD-2H-0.5G CL-3H-6h PR-3H-6h PR-6H-4h PR-6Hb Q1 Position (cm-1) FWHM Area % 884 80 20 887 81 20 874 82 18 886 78 20 877 78 22 882 82 20 875 77 18 882 84 20 879 84 15 885 79 15 905 70 14 Q2 Position (cm-1) FWHM Area % 948 82 33 951 86 32 940 81 32 951 83 32 940 87 33 946 87 32 940 76 34 947 83 34 951 78 26 950 82 28 969 69 31 Q3 Position (cm-1) FWHM Area % 1011 82 29 1014 88 29 1001 90 29 1012 82 28 1001 94 27 1009 87 29 999 81 29 1011 83 31 1007 74 32 1005 77 34 1020 66 31 HF region Q4 Position (cm-1) FWHM Area % 1079 86 19 1082 91 20 1073 90 21 1081 83 19 1072 90 18 1076 90 19 1065 79 19 1075 84 16 1077 72 25 1077 83 23 1078 63 26 D1 Position (cm-1) FWHM Area % 3357 208 16 3252 200 23 3278 222 16 3380 219 28 3323 126 40 3374 284 20 3398 126 18 3477 220 28 3410 201 42 3278 356 24 3279 228 19 D2 Position (cm-1) FWHM Area % 3473 146 30 3478 220 40 3391 109 23 3480 129 31 3446 122 50 3514 160 32 3558 137 82 3590 130 55 3573 149 58 3447 176 32 3459 184 29 D3 Position (cm-1) FWHM Area % 3581 130 48 3590 130 34 3556 179 61 3596 116 41 3571 133 10 3606 130 42 3576 141 44 3586 148 50 H2 O region Free OH Position (cm-1) FWHM Area % 3666 52 6 3672 50 3 3673 48 7 3661 54 17 3665 43 2 3 4 5 6 7 8 9 10 11 12 13 14 15 16 17 18 19 20 21 22 23 24 25 26 27 28 29 30 31 32 33 34 35 36 37 38 39 40 41 42 43 44 45 46 47 48 49 50 51 52 53 54 55 56 57 58