HAL Id: hal-00769813
https://hal-mines-paristech.archives-ouvertes.fr/hal-00769813
Submitted on 12 Aug 2014
HAL is a multi-disciplinary open access archive for the deposit and dissemination of sci-entific research documents, whether they are pub-lished or not. The documents may come from teaching and research institutions in France or abroad, or from public or private research centers.
L’archive ouverte pluridisciplinaire HAL, est destinée au dépôt et à la diffusion de documents scientifiques de niveau recherche, publiés ou non, émanant des établissements d’enseignement et de recherche français ou étrangers, des laboratoires publics ou privés.
Pouring CREAM into natural gas: The introduction of
Common Performance Conditions into the safety
management of gas networks
Guillaume Desmorat, Franck Guarnieri, Denis Besnard, Pierre Desideri,
Frédérique Loth
To cite this version:
Guillaume Desmorat, Franck Guarnieri, Denis Besnard, Pierre Desideri, Frédérique Loth. Pouring CREAM into natural gas: The introduction of Common Performance Conditions into the safety management of gas networks. Safety Science, Elsevier, 2013, 54, pp.1-7. �10.1016/j.ssci.2012.10.008�. �hal-00769813�
Pouring CREAM into natural gas: the introduction of Common
Performance Conditions into the safety management of gas networks
Guillaume Desmorata, b, Franck Guarnierib, Denis Besnardb, Pierre Desideria and FrédériqueLotha
Abstract: Learning from operational experience is a process that has arisen as a result of the
need in industry to manage the increasing complexity of technical systems. While dependability was initially dominant, limitations in its ability to account for human variability have gradually become apparent. The use of the human and organisational factors paradigm emerged in an attempt to overcome these limitations, and learning from operational experience has evolved out of this. This evolution led to a shift of interest towards the influence of the work environment on human performance. The CREAM method, structured by the Common Performance Conditions (CPCs), is a major example of this trend. This paper discusses the design and deployment of an accident analysis grid developed in 2008 by a major French gas distribution company. This grid was a response to the company’s decision to revitalise the learning from operational experience process through the use of human and organisational factors.
Keywords: gas network management, human and organisational factors, CREAM, common
performance conditions, accident analysis.
1. Introduction
This paper describes the design, development and deployment of an accident analysis grid that incorporates human and organisational factors. The grid is based on Hollnagel’s CREAM method (1998) and a specific use of Common Performance Conditions (CPCs; Hollnagel,
ibid.), known as the screening technique. The context for the deployment of the grid is the
French gas distribution industry. This business is characterised by a high level of risk, a rather prescriptive use of procedures and an approach to accident analysis that tends to focus on technical components. In this context, the introduction of CPCs reflected the company’s desire to improve safety management by broadening the spectrum of causes of accidents. However, in practice, the introduction of CPCs had effects that went beyond these technical aspects and brought about a profound change in the paradigm of the accident and its aetiology. The technical content of the method and the changes it provoked will be described in this paper.
The accident analysis grid presented here is the result of two years of research and development carried out by a working group composed of the Risk Management Centre at GrDF, the Centre for research on Risks and Crises (Mines ParisTech) and the Department of Research and Innovation of GDF-SUEZ.
1.1. GrDF (Gaz réseau distribution France)
GrDF was created on 31st December, 2007. It is a 100% subsidiary of GDF-SUEZ and
manages all activities related to natural gas distribution in France. With nearly 46,000 employees and 190,000 kilometres of network, it serves 11 million customers. Such a business faces many safety challenges. Two main areas of activity have been identified as the cause of accidents or structural damage:
Management of the network supervised by GrDF. This is the responsibility of the operational manager who manages all access to the network required for maintenance. Maintenance teams are either GrDF employees or contractors.
Work carried out by external companies. These may either be carried out under the supervision of GrDF or independently. Companies must refer to GrDF for maps of the network at the location where work is to be carried out.
The effects of structural damage vary widely. The most benign affect only the physical aspects of a facility, and costs are low. For instance; a pipe feeding a domestic property can be repaired for less than five hundred euros, including materials and travel expenses. In contrast, the most serious accidents can result in the death of GrDF employees or members of the public, particularly in the case of an explosion. With such high human and material stakes, learning from past events is essential to ensure the safety of distribution. The accident analysis grid described in this article focuses on CPCs. The goal for the company is to use this tool to strengthen their ability to learn from operational experience. This training is crucial to the performance of the company since it operates in an open environment which is subject to numerous interventions from outside contractors.
1.2. Lessons from the past and learning from operational experience
Hollnagel (2006) identifies the process of learning from the past as one of the four core capabilities of a resilient organisation. In the field of industrial safety, this feature allows an organisation to limit the recurrence of events and/or manage their consequences.
For GrDF and the industry in general, training is often operationalised in the form of learning from experience. It is defined by Rakoto (2004) as a “structured approach to the capitalisation and exploitation of information resulting from the analysis of positive and/or negative events. It implements a set of human and technological resources that must be managed in such a way as to reduce the repetition of errors and to promote good practice”.
The nuclear industry has played a pioneering role in research into and consolidation of the concept of learning from operational experience. It is defined by the International Atomic Energy Agency (2006) as a tool “…to report, investigate, evaluate, trend, correct and utilize information in relation to abnormal events [...] and to disseminate this information to the relevant governmental bodies, national and international organizations and the public”. The aviation industry is also very active in sharing information related to incidents and accidents. The database of the Aviation Safety Reporting System (ASRS) provides an opportunity for pilots and air traffic controllers to submit incident analyses, anonymously and without sanction. The purpose of this organisation, through its publications, is to supply data on the most common risks to the relevant aviation safety authorities in the United States.
According to van Wassenhove (2009), learning from operational experience can be structured into four phases:
detection of the problem and collection of information; analysis;
formalisation and capitalisation of knowledge; and sharing and reuse of knowledge.
This article only discusses the analysis phase, since it is at this stage that our accident analysis grid is used.
1.3. Outline of the paper
This article continues (section 2) with a description of the evolution of accident analysis methods. While such methods were initially structured around the study of technical components, they have increasingly focused on the analysis of human reliability. Later, second-generation methods were specifically designed to integrate the contextual determinants of human performance.
Section 3 describes a specific second-generation method, namely CREAM, developed by Hollnagel (1998). CREAM implements the concept of Common Performance Conditions (CPCs). These will be explained in detail in order to highlight the link with the analysis aimed at by GrDF. Section 4 describes the design and deployment of the grid which was developed during a process of ‘participatory prototyping’. It demonstrates the added value provided by this tool. Section 5 discusses the limitations and benefits of the introduction of the grid following its deployment and in the first two years of use. Section 6 describes the trade-offs and side effects of the grid in everyday use, and Section 7 reflects on some of the lessons learned.
2. Reliability analysis methods
This section briefly describes the evolution of reliability analysis methods. It aims at presenting the evolution of ideas within the field of accident analysis, and how the analysis of human performance progressively came about.
2.1. First-generation human reliability analysis methods
Accident analysis methods assess the interaction between human activity and performance conditions. The relationship between these two variables is determined by the underlying accident model. One approach is to view human error as the main cause of events. Fault tree analysis (FTA) and Failure Modes, Effects and Criticality Analysis (FMECA) are methods representative of this school of thought that considers performance conditions to be a background issue. The cause remains associated with the individual and accidents are primarily the result of human error.
However, the same variables permit another approach. Human reliability assessment (HRA) methods put forward the principle that human error is the result of unfavourable performance conditions. Therefore, the analysis initially focuses on the context and it is only later that modes of human error are associated with it. The THERP (Technique for Human Error Rate Prediction; Swain, 1964) method is an example of this approach. Human error remains a determining factor. However, it only impacts the system through its association with external factors such as procedures or the condition of equipment. Analysis begins with a description of the system, its normal mode of operation and the effect of a malfunction on each of its operations. All human interventions in the system are then examined. By matching human error probability tables with these interventions, it is possible to determine the impact of each of these errors on the system.
2.2. Second-generation methods
The difficulty of quantifying a base rate probability for human error has proven to be a major hurdle. This difficulty has led to a new generation of human reliability assessment methods that re-visit the problem. In these methods, human error is no longer modelled as a base rate probability modulated by context, but as a direct consequence of the context.
Performance is then defined through concepts such as the Performance Shaping Factors (PSFs) developed by Swain & Guttman (1983). The notion of context has been incorporated into the CREAM method using the term Common Performance Conditions (CPCs). For both CPCs and PSFs the assumption is the same: failure is the outcome of unfavourable conditions1.
This approach represents a radical change in the modelling of humans in systems. The consequences of this view of performance are twofold. On the one hand, the idea of performance conditions makes it possible to bypass the concept of human error: avoiding the recurrence of unwanted events can be achieved by removing the conditions that cause poor performance. On the other hand, the idea of performance conditions enables managers to distance themselves from a search for those responsible and the imposition of sanctions, through the implementation of a ‘new approach’ to humans (see Dekker et al., 2007).
3. The CREAM method
CREAM is a second-generation HRA method developed by Hollnagel (1998). It belongs to the human reliability analysis discipline. It is a part of a long history of models and methods in which the concept of causation has greatly evolved. Like other methods of the same generation, CREAM puts forward the idea that operational failures are contingent upon the conditions under which actions are carried out. The method can be deployed in the context of risk assessment; Fujita & Hollnagel (2004) describe such a use. Alternatively CREAM can be used for accident analysis. For that use, two versions of the method exist. The extended version operates at the level of fine-grained cognitive functions, while the basic method, known as the screening technique, is based on the analysis of CPCs. The approach described in this article uses the simpler version of the method.
CREAM itself is a generic method. Various other versions have been developed, tailored to the needs of particular fields or industries. A variant of the method, DREAM (Driver Reliability and Error Analysis Method) was developed for driving (Ljung, 2002). Another example is BREAM (Bridge Reliability and Error Analysis Method), described by Qureshi (2007), and developed for the analysis of accidents in the field of merchant shipping.
In CREAM, CPCs enable an analysis to be made of the context in which work is carried out (Table 1). CPCs are used to analyse the working environment using characteristics that are applicable to many areas of activity. The premise of CREAM is that when CPCs are unfavourable, the level of control over the activity decreases, and along with it, the level of performance.
1 Note that the precision of modelling humans via PSFs or CPCs relies on some form of validation of their
effects on performance. However, to the best of the authors’ knowledge, there is no single answer on what could be a reliable source of data for such a validation. In practice, a combination of databases, simulations and expert judgement is used.
Table 1: List of CPCs, assessment options and their expected effects.
CPC Level/descriptors Expected effect on
performance reliability
Adequacy of organisation Very efficient Efficient Inefficient Deficient Improved Not Significant Reduced Reduced Working conditions Advantageous
Compatible Incompatible
Improved Not Significant Reduced Adequacy of man-machine interface (MMI)
and operational support
Supportive Adequate Tolerable Inappropriate Improved Not Significant Not Significant Reduced Availability of procedures/plans Appropriate
Acceptable Inappropriate
Improved Not Significant Reduced Number of simultaneous goals Fewer than capacity
Matching current capacity More than capacity
Not Significant Not Significant Reduced Available time Sufficient
Temporarily sufficient Consistently insufficient
Improved Not Significant Reduced
Time of day Day
Night
Not Significant Reduced Adequacy of training and expertise Adequate, wide experience
Inadequate, limited experience Inadequate
Improved Not Significant Reduced Quality of collaboration Very efficient
Efficient Inefficient Deficient Improved Not Significant Not Significant Reduced Effectiveness of communication Suitable
Acceptable Unsuitable
Improved Not Significant Reduced
As Table 1 shows, CPCs cover a wide spectrum of activities. They are defined generically and should be tailored to the work situation at hand. However, the assessment principle remains the same: it consists of a systematic examination of each CPC. We will now take ‘Working conditions’ as an example.
1. The analyst collects the necessary information (position, light, dust, heat, noise, humidity, odour, etc.2) from the situation being assessed.
2. Working conditions can then be assessed as ‘advantageous, ‘compatible’ or ‘incompatible’.
3. The final step in the evaluation of the CPC is to determine the corresponding expected effect on performance (‘improved, ‘not significant’ or ‘reduced’).
When CREAM is deployed as a screening technique for accident analysis, CPCs are used to evaluate in a simple but systematic way the conditions under which a particular level of performance was obtained. Because these conditions are seen as a factor that determines performance, it is essential to understand them, as they form a major element in the characterisation of the causes of human failure.
The next section describes the process undertaken by GrDF in order to tailor CPCs to the domain of gas distribution and the consequent deployment of a prototype analysis grid.
2 These descriptors, as well as those belonging to the other CPCs, have not been included in Table 1 in order to
4. Development of the prototype and CPCs
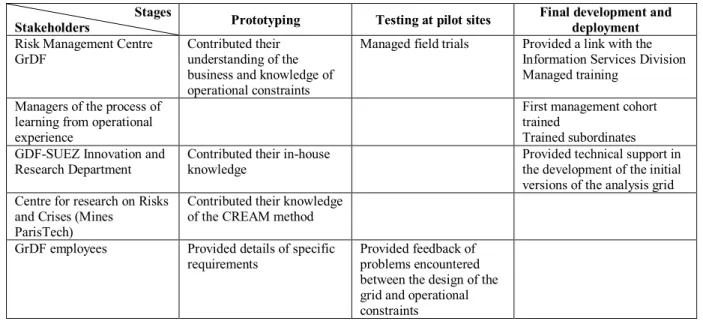
The process of co-design and development of the analysis grid can be likened to the ‘waterfall’ model of software engineering (see e.g. Sommerville, 1995). The latter is divided into five phases: requirements specification, system and software design, implementation and unit testing, integration and system testing, and deployment. The screening grid was developed in three phases (Figure 1) which overlap with those of the waterfall model:
1. The prototyping stage groups the two phases of requirements specification, and system and software design.
2. The test phase at pilot sites corresponds to the phases of implementation and testing. 3. The final stages of development and deployment mirror those of the waterfall model. Professionals from the Risk Management Centre (GrDF) contributed their knowledge of site management and operating procedures in the operational environment. Specialists from the Centre for research on Risks and Crises (Mines ParisTech) brought their expertise in the use of the method. The Research Department of GDF-SUEZ provided technical support in the development of the initial analysis grid and participated in benchmarking exercises at operational sites.
Stages
Stakeholders Prototyping Testing at pilot sites
Final development and deployment
Risk Management Centre GrDF
Contributed their understanding of the business and knowledge of operational constraints
Managed field trials Provided a link with the Information Services Division Managed training
Managers of the process of learning from operational experience
First management cohort trained
Trained subordinates GDF-SUEZ Innovation and
Research Department
Contributed their in-house knowledge
Provided technical support in the development of the initial versions of the analysis grid Centre for research on Risks
and Crises (Mines ParisTech)
Contributed their knowledge of the CREAM method
GrDF employees Provided details of specific
requirements
Provided feedback of problems encountered between the design of the grid and operational constraints
Figure 1: Overview of the process of co-construction of the analysis grid
The screening grid (Figure 2) was developed in three stages:
1. Creation of a prototype. A major part of this step was to adapt the original CPC vocabulary to the gas distribution business. This was achieved by bringing together business and operational experts. The grid was implemented in a spreadsheet to make it easier for all the various stakeholders to participate in its development, and to simplify its dissemination to pilot sites. Details of this phase of co-development can be found in Besnard et al. (2009).
2. Testing at pilot sites. This step consisted of field trials that capitalised on user feedback. Tests were conducted in March and April 2009 on operational sites in the Paris area. Each trial was an opportunity to apply the grid to a real-life situation and gather both feedback and feature requests.
3. Final development and deployment. The last step made it possible to capitalise on feedback from the pilot sites and to produce a final version of the grid. Regional managers were trained, with the task of training their own local managers. By the end of the first half of 2009, and six months after the start of prototyping, personnel at all the operating sites had been trained. At this point, the method was deployed nationally in the eighteen units that comprise the GrDF gas network. The integration with the nation-wide computer system took place the following year.
Figure 1: Screenshot of the graphical interface of the final version of the screening grid, showing the menu of response options
This interface was used for all the adapted CPCs. The process was thorough to the extent that even the name evolved: CPCs were renamed into Task Execution Conditions (TECs) for internal communication purposes. Also, an important objective was to adapt generic TECs to the reality of work. Therefore, additional specific sub-criteria were introduced to reflect real-life conditions (Table 2).
Materials and tools
Storage and availability
For this intervention, were tools and materials in their usual places? Were they easy to access? Were the various workspaces and means of transport free from obstruction? Were the tools required for the intervention (specified in the work order) available? Was there adequate storage space? Was transport available?
Describe how storage conditions or the availability of tools or materials affected the event or intervention
What was the cause of the malfunction (if there was one)?
Prime factor Aggravating
The conditions created by storage and availability were the following… Irrelevant No impact Very unfavourable Unfavourable Favourable
Table 2: List of TECs and their sub-criteria
TEC Sub-criteria
Working conditions 1. Working environment 2. Personal protective equipment 3. Temperature, noise, light
Materials and tools 4. Availability of a tool suitable for the task at hand 5. Condition of tools and vehicles
6. Storage and availability 7. IT equipment
Regulations and procedures 8. Description of tasks in procedures and the relevance of procedures 9. Deployment and availability
10. Compliance with procedures
Mapping and designation 11. Availability of mapping for GrDF field operators 12. Maps correspond to the terrain
13. Underground maps correspond to the terrain 14. Consistent mapping
15. Designation of facilities
Workload 16. Actors undertake more than one activity at a time 17. Rhythm of work
Time management 18. Preparation 19. Execution
20. Break points to assess the situation Professionalism 21. Knowledge
22. Know-how 23. Skills
Collaboration 24. Sub-contractors respect contract terms
25. Working agreements with fire services are followed 26. Team-working
27. Shared means and objectives
28. Collaboration and respect for roles within the team 29. Distribution of skills
Communication 30. Business language 31. Communication methods
32. Traceable/adequate internal information
33. Impact of external information on event management Technical management 34. Decision-making chain
35. Management of gas flow
36. Condition, accessibility and maintenance of facility 37. Design/operation of facilities
5. Limitations and benefits of the analysis grid
The introduction of the new analysis grid took place in a context of profound organisational change. In addition to the paradigm shift in the analysis of accidents which required managers to master a new mind-set, other limitations to the assimilation of the method became apparent. These were identified at three phases: in the design of the grid, its implementation and particularly, its use. While the design and implementation phases did not give rise to significant difficulties, the operational phase proved to be more challenging.
5.1. Limitations of the grid
Four limitations were found when using the grid in operational conditions.
Cost of analysis. Managers frequently found that the introduction of the screening grid was an unwelcome additional task that was incompatible both in terms of time and contents with the many on-going field interventions.
Cost of capitalisation. The increased complexity of the analysis increased the amount of information to be collected and analysed. The cost of the capitalisation of this information rose, since it required managers to spend time formatting data before disseminating the results of the analysis. This additional workload diminished interest in the grid and made it difficult to provide rapid feedback to operators. A computer application partially remedied this problem.
Lack of support from senior management. A fourth limitation was the feeling of lack of interest on the part of the managers in charge of industrial safety. Despite the additional training and on-demand methodological support provided, a sense of isolation was noted. The impression was that the increased cost of accident analysis was not being taken into account.
Search for those responsible. At the beginning of the deployment, very few of the analyses proved useful due to a lack of understanding of the implementation of the concept, which was interpreted in the context of dependability. This misunderstanding obscured the search for deeper causes in favour of the allocation of blame. Paradoxically, interviews with employees revealed a keen interest in the new method, which was seen as being capable of overcoming the limitations of previous practice. The latter was a) a heterogeneous collection of reliability assessment methods that was used also in the domain of human and organisational factors.
To some extent, the difficulties above tie back to the culture of the fault tree analysis. The latter was designed as a binary framework (the behaviour is right or wrong) where only those facts that can be observed directly can be analysed. It follows that a) departing from the notion of error and b) analysing the context of a human action implied a massive cultural shift. What is more, this shift implied a higher cost, which did not ease the adoption of the new TEC-based grid.
5.2. Benefits of the grid
In the two-year period since the implementation of the analysis grid, several points have emerged which demonstrate that its introduction has improved working practices.
Fault tree analysis is less used. Historically, this method had been widely used by the company, including for the analysis of human actions. The introduction of the screening grid provided a solution to two problems. First, it made it possible to bypass the concept of human error and second, it enabled an analysis to be made of the performance conditions of operators. However, because the method depended heavily on the expertise of the person responsible for the analysis, the initial results lacked consistency. In its current implementation, the analysis grid supports the convergence of safety information. This has made it possible for operators and managers to systematically collect and manipulate data.
Unification of operating data. It became possible to capitalise operational information related to safety that had previously only been available piecemeal. Following the analysis of hundreds of accidents, it became possible to identify the weakest structures in the network. These consisted, for the most part, of the principal network connections, which accounted for more than 80% of the facilities involved in incidents. In over 80% of these cases, an identified cause of the accident was a lack of knowledge of the network on the part of an external company carrying out work, partially due to structures not being identified.
Perceived usefulness for safety. The CPCs were perceived as a means to achieve a depth of analysis useful for improving safety. By using CREAM as a screening technique rather than the extended method, the analysis grid helped users to understand the concept of performance conditions. It should be noted that the perception of what constitutes a depth of analysis useful for improving safety is the subject of debate. As Perret (1996) suggests, change in an organization creates
ambivalent perceptions among people concerned, affecting safety results in return. Learning from past experience can therefore have its global efficiency reduced since these perceptions may lead people to develop defensive attitudes, as Argyris (1978) describes in his Model 1 theory.
Integration of safety managers. Another positive result was the increased exchange of information and discussion. Transparency was improved and mutual understanding between the various operating sites of their local working conditions increased. A non-technical aspect of the analysis grid was that it functioned as a medium of dialogue between operators and the managers (both local and national) in charge of risk management. This promoted the emergence of an integrated safety culture (see for example Groeneweg et al., 2002). In turn, there was greater scope for dialogue and understanding of the causes of errors. The progressive re-evaluation of the role of sanctions made it possible to maintain an active flow of information to safety managers at a national level.
6. Discussion
The introduction of the analysis grid represented a paradigm shift in accident analysis practices, which evolved considerably. However, it is not clear whether a corresponding improvement in safety management can be demonstrated. On the one hand, trade-offs emerged between the cost of using the new grid and available resources. On the other hand, positive side-effects were noted. These two phenomena are discussed in the following sections.
6.1. Trade-offs
Several difficulties were identified during the deployment of the grid, both for managers and operators. For example, it took longer to carry out an analysis with the grid than before. This degraded the quality of the accident analysis and consequently, the ability of the company to obtain a realistic overview of the causes of accidents.
The work of Simon (1957) on limited rationality demonstrates that with equal resources, new problems call for trade-offs. Therefore, it was important to identify the trade-offs that were triggered in response to the deployment of the screening grid. Those identified were:
Trade-off between depth of analysis and usability of the grid. The new paradigm led to the development of a new accident analysis grid. Consequently, operators and managers in the field were not familiar with it. The frequently-heard argument that the tool lacked usability bore witness to the difficulty of adjusting to the new paradigm. The trade-off between comprehensiveness and perceived complexity was most difficult to arbitrate.
Trade-off between depth of analysis and workload. At GrDF, local accident analysis teams are composed of the same personnel who perform interventions on the gas network. The time spent carrying out an accident analysis using the grid (rather than running the traditional, unsupported debriefing) was considered to be time that could be have been spent on interventions. The corresponding threat was that in order to meet production constraints, the accident analysis could be superficial or triggered only in the case of major accidents.
Trade-off between criticality and workload. This trade-off is related to the previous one. The idea of perceived criticality makes it possible to mediate between the choice of events to be analysed and the time available. The threat to safety lies in changing the criticality threshold of an accident and an implicit re-evaluation of the definition of an incident.
Trade-off between performance management and the management of operators. Organisational changes modified the responsibilities of those in charge of carrying out the analyses. Following the introduction of the analysis grid, local managers were required to manage a double bind: the performance requirements of senior managers and complaints from emergency response teams who saw changes in the substance of their job.
6.2. Side effects of the paradigm shift
The implementation of TECs to analyse performance provided a solution to the paradox of learning from operational experience. Experience shows that only analysing unwanted events poses a fundamental problem for safety. The decreasing number of accidents and incidents gradually deprives the organisation of incoming data from which safety is managed. In other words, when the process only learns from the experience of unwanted events, the extent to which system safety is under control can only be assessed if accidents occur. It cannot otherwise be demonstrated that safety barriers are working. While senior managers claim that safety comes first, the accident (and the loss of control that it represents) is still, paradoxically, the only means available to determine if the system was safe.
The approach above only attempts to limit the consequences of unwanted events. Positive performance (the absence of accidents) is not taken into account. Because it is expected, it is considered to be normal and is not given any particular value in terms of learning. In this view of safety, the individual is simply a resource that carries out prescribed actions. Safety is then seen as the result of compliance with specific procedures and the use of appropriate tools. Furthermore, the sense that operators make of their activity is discounted, as is the significance of the organisational context in the industrial process, as Davoudian et al. (1994) describe.
The attribution of error to operators described by Reason (1997) is a result of the line of reasoning described above. Instead, the analysis grid and the TECs encouraged discussions. It set the focus on identifying the causes of accidents rather than finding what operators did wrong. In doing so, it got the company away from the vision where accidents result from a lack of knowledge or discipline in the application of tools and procedures.
The decision to integrate the paradigm of TECs into safety management had consequences that went beyond the scope of accident analysis. One of the areas affected was the training of local managers. Traditional training courses, oriented towards obtaining practical and theoretical skills, were revised. This was complemented by the design and development of a simulated operations desk with scenarios created from actual accident analysis reports.
Learning from operational experience in general, and the accident analysis grid described here, are much more than a tool for the capitalisation of incidental knowledge in a socio-technical system. In fact, they go beyond the sphere of safety by offering opportunities for discussion and debates about new practices. On this last point, learning from operational experience is genuinely useful for the creation, or strengthening of a safety culture. Safety no longer emerges as the result of the implementation of procedures or the monitoring of indicators, but rather as the result of a collective effort.
A sharp difference was also found between age groups. A whole generation of the organisation’s employees had become accustomed to the use of the concepts of error and sanction in a ‘legal’ sense. These employees attempted to minimise the differences between their understanding of these concepts and the new paradigm. For them, only time and on-going support can bring about a change in attitude. Management must now take into account this generational issue as well as the wide cultural spectrum present in the company.
7. Conclusion
The first lesson to be learned from this exercise is that the design and deployment of a tool such as our accident analysis grid is not just a technical change. Such beliefs on the part of management are counter-productive. The approach can only be said to have succeeded if it is accepted by the daily end-users. The deployment demonstrated the importance of ‘participatory prototyping’. The latter responded to the criticism, commonly heard from operations staff, that national policy-makers impose new tools without taking into account the daily technical constraints and available human resources.
The participatory development method chosen imposed an important related constraint: participation must continue beyond the design phase. If this does not happen, local workaround strategies may take hold in an attempt to circumvent the constraints of the grid. In turn, this would deprive managers from signs that unacceptable practices have become everyday work. Vaughan (1996) terms this the normalisation of deviance and is known to have been involved in industrial catastrophes. Therefore, national managers must be prepared to provide communication channels and on-going training in order to maintain continuous improvement in the organisational learning processes.
Another consequence of the introduction of TECs was a disruption to existing management practices. Embodying a new view of human error (Dekker, 2007) made the concepts of error and sanction more difficult to understand. As a consequence, management practices had to be adapted. Otherwise, the learning from operational experience process would only rediscover the same limited causes of failure. Implicitly, this illustrates the prescriptive power of safety management tools and highlights the challenges lying ahead of GrDF.
8. References
Argyris, C. (1978). Organizational learning: a theory of action perspective. Reading (MA), Addison-Wesley.
Besnard, D., Fabre, D., Van Wassenhove, W. & Runte, E. (2009). An account of scientific transfer to the industry: the co-development of an incident analysis tool. 9th
Conference of the European Sociology Association, 2-5 Sept., Lisbon, Portugal.
Davoudian, K., Wu, J.S. & Apostolakis, G. (1994). Incorporating organizational factors into risk assessment through the analysis of work processes. Reliability Engineering and
System Safety, 45, 85-105.
Dekker, S., Siegenthaler, D. & Laursen, T. (2007). Six stages to the new view of human error.
Safety Science Monitor, 11, article 5.
Groeneweg, J., Lancioni, G. E. & Metaal, N. (2002). How to embed integrated risk management into the culture of an organisation, IIR Conference Implementing
Hollnagel, E. (1998). Cognitive Reliability and Error Analysis Method. Oxford, Elsevier Science.
Hollnagel, E. (2006). Resilience Engineering, concepts and precepts. Aldershot, Ashgate. Hollnagel, E. & Speziali, J. (2008). Study on developments in accident investigation methods:
a survey of the “state-of-the-art”. SKI Report 2008:50.
International Atomic Energy Agency (2006). A system for the feedback of experience from
events in nuclear installations. Safety Guide NS-G-2.11.
Fujita, Y. & Hollnagel, E. (2004). Failures without error: quantification of context in HRA.
Reliability Engineering and System Safety, 83, 145-151.
Ljung, M. (2002). DREAM - Driving Reliability and Error Analysis Method. M.Sc. dissertation, Linköping University.
Perret, V. (1996). La gestion du changement organisationnel : articulation de représentations ambivalentes. 5ème conférence internationale de management stratégique, Lille, May
13-15.
Qureshi, Z.H. (2007). A Review of Accident Modelling Approaches for Complex Socio-Technical Systems. In Proc. 12th Australian Conference on Safety-Related
Programmable Systems (SCS 2007), Adelaide, Australia (pp. 47-59).
Rakoto, H. (2004). Intégration du retour d’expérience dans les processus industriels.
Application à Alstom Transports. PhD dissertation, Institut National Polytechnique de
Toulouse, France.
Reason, J. (1997). Managing the risks of organizational accidents. Hampshire, Ashgate. Simon, J. (1957). A behavioral model of rational choice, Models of Man, Social and
Rational: Mathematical Essays on Rational Human Behaviour in a Social Setting.
New York, Wiley.
Sommerville, I. (1995). Software engineering. Reading (MA), Addison-Wesley.
Swain, A.D. (1964). THERP. SC-R-64-1338, Sandia National Laboratories, Albuquerque, NM.
Swain, A.D. & Guttmann, H.E. (1983). Handbook of Human Reliability Analysis with
Emphasis on Nuclear Power Plant Applications. US Nuclear Regulatory Commission,
Washington, DC (1983) NUREG/CR-1278.
Vaughan, D. (1996). The Challenger launch decision, risky technology, culture and deviance
at NASA. University of Chicago Press.
Van Wassenhove, W. (2009). Retour d’expérience et maîtrise des risques. Lavoisier, Paris.
9. Acknowledgements
The authors wish to thank ANRT (the French National Association for Research and Technology) for their financial support. The authors would also like to thank those responsible for risk management at GrDF and in the Department of Research and Innovation (DRI) of GDF-SUEZ. Finally, the authors would also like to thank the anonymous reviewers who helped to improve the quality of this article.