HAL Id: tel-01385022
https://hal.inria.fr/tel-01385022
Submitted on 20 Oct 2016
HAL is a multi-disciplinary open access
archive for the deposit and dissemination of sci-entific research documents, whether they are pub-lished or not. The documents may come from teaching and research institutions in France or abroad, or from public or private research centers.
L’archive ouverte pluridisciplinaire HAL, est destinée au dépôt et à la diffusion de documents scientifiques de niveau recherche, publiés ou non, émanant des établissements d’enseignement et de recherche français ou étrangers, des laboratoires publics ou privés.
Interactive Demand-Shifting in the Context of Domestic
Micro-Generation
Jacky Bourgeois
To cite this version:
Jacky Bourgeois. Interactive Demand-Shifting in the Context of Domestic Micro-Generation. Human-Computer Interaction [cs.HC]. The Open University; Université de Rennes 1 [UR1], 2016. English. �tel-01385022�
THÈSE / UNIVERSITÉ DE RENNES 1
sous le sceau de l’Université Bretagne Loire
En Cotutelle Internationale avec
The Open University
pour le grade de
DOCTEUR DE L’UNIVERSITÉ DE RENNES 1
Mention : Informatique
Ecole doctorale Matisse
Jacky Bourgeois
Préparée à l’unité de recherche IRISA
Institut de Recherche en Informatique et Systèmes Aléatoires
UFR Informatique Électronique (ISTIC)
Interactive
Demand-Shifting in the
Context of Domestic
Micro-Generation
Thèse rapportée par
Tom RODDEN
Prof., University of Nottingham / rapporteur
Michel RIVEILL
Prof., Université Nice Sophia Antipolis / rapporteur
Et soutenue à Milton Keynes
le 30/06/2016
devant le jury composé de :
Tom RODDEN
Prof., University of Nottingham / examinateur
François TAIANI
Prof., Université de Rennes 1 / examinateur
Marc WOODROFFE
Submitted April 2016
In fulfilment of the requirements for the dual degree of
Doctor of Philosophy of
Faculty of Mathematics, Computing and Technology
The Open University
Gerd Kortuem Janet van der Linden
Blaine A. Price And Thesis supervisors Doctor of Université de Rennes 1 mention Informatique Benoit Baudry Johann Bourcier
A
BSTRACT
The combination of ubiquitous computing and emerging energy technologies is radically changing the home energy landscape. Domestic micro-generation, dominated by solar photovoltaic, is increasing at a rapid pace. This represents an opportunity for creating and altering energy behaviours. However, these transformations generate new challenges that we call the domestic energy gap: domestic electricity consumption and micro-generation are out of sync. Micro-micro-generation is mainly uncontrollable production relying on weather while domestic energy consumption tends to happen mostly during the evening. This thesis focuses on understanding and supporting new domestic practices in the context of domestic solar electricity generation, looking at ‘Demand-Shifting’. Specifically, we look at how can digital tools leverage Demand-Shifting practices in
the context of domestic micro-generation? Relying on a mixed-method approach, we provide a qualitative and
quantitative answer with the collaboration of 38 participating households in several field studies including two spanning more than eight months. Through a deep investigation of laundry and electric mobility routines in the context of domestic micro-generation, we emphasised a natural engagement into Demand-Shifting which appeared as a complex and time-consuming task for participants which was not visible when we analysed their quantitative data. We revealed this complexity through Participatory Data Analyses, a method we designed to analyse the data in collaboration with the participating householders. This provided us with a comprehensive view of the relationship between domestic micro-generation and daily routines. Finally, we highlight the need for timely and contextual support through the deployment of interventions in-the-wild. Building on discussions of our findings in perspective of the literature, we propose a conceptual framework to support domestic interactive Demand-Shifting.
R
ESUME EN
F
RANÇAIS
La combinaison de l’internet des objets et des nouvelles technologies liées à l’énergie transforme le paysage de l’énergie dans la maison. Les installations de micro générateurs, dominées par les panneaux solaires photovoltaïques, sont en constante progression. C’est une opportunité pour la création et l’altération des comportements énergétiques. Cependant, ces transformations créent également un nouveau défi que l’on appelle le « différentiel énergétique » à l’échelle de la maison : la consommation et la génération d’électricité des ménages sont désynchronisées. En effet, la génération locale est majoritairement incontrôlable et dépendante des conditions météorologiques alors que la consommation des ménages à tendance à se concentrer en soirée.
Cette thèse vise à comprendre et encourager les pratiques de déplacement des consommations émergeantes dans les ménages équipés de panneaux solaires photovoltaïques. En particulier, nous observons « Comment
les outils numériques peuvent-ils tirer parti des pratiques de déplacement des consommations dans le contexte de micro génération domestique ? ». Nous adressons cette problématique en trois
étapes. Premièrement, il est nécessaire de construire une compréhension qualitative de l’impact potentiel. Quelles sont les pratiques, leurs conditions et leurs flexibilités ? Existe-t-il une cohérence de ces pratiques dans le temps, entre les ménages ou entre les appareils ménagers ? D’un point de vue quantitatif, quels sont les bénéfices potentiels de telles pratiques ?
RQ1. Comment les pratiques de déplacement de consommation prennent place dans le contexte de la génération domestique d’électricité de source solaire ?
Se focaliser sur la consommation d’électricité des ménages amène à porter une attention particulière à donner aux résidents, en particulier quand il s’agit de pics de consommation. Est-ce que les retours d’information traditionnels tels que « l’eco-feedback » permettent de supporter les nouvelles pratiques liées à l’énergie ? Dans le cas contraire, quels sont les limites des systèmes actuels et les nouvelles fonctionnalités requises ?
RQ2. Quel sont les éléments nécessaires pour l’interaction entre le système et les résidents quand l’objectif est de supporter les pratiques de déplacement des consommations ?
Se basant sur RQ1 et RQ2 :
RQ3. Comment peut-on concevoir un système numérique réaliste et interactif pour supporter le déplacement des consommations ?
Pour adresser ces questions de recherches nous avons combiné des approches empiriques et d’ingénierie, se renforçant et s’informant mutuellement les unes et les autres pour fournir une solution générale. Cela inclus la collection de données qualitatives et quantitatives, des analyses en collaboration avec les participants, des études longitudinales, des interviews, du co-design, des simulations et des tests en condition réelles. Tout au long de cette thèse, nous avons utilisé une méthodologie centrée sur l’utilisateur à chaque étape pour informer et valider la recherche.
Étude Utilisateur A : Comprendre la Relation entre Production et Consommation d’Électricité
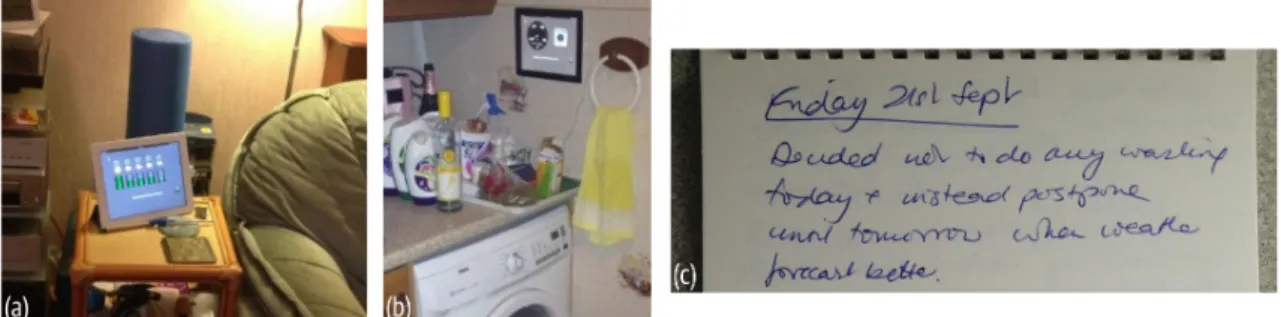
À travers la première étude nous avons exploré la relation entre la production locale d’électricité de source solaire et la consommation des ménages. Nous avons utilisé une méthode appelée « Technology Probes » dont l’objectif vise à provoquer des idées et des commentaires de la part des participants. Nous avons développé sept concepts de visualisation que nous avons déployé dans six ménages pour une durée d’une à deux semaines. Affiché sur des tablettes électroniques, ces concepts représentaient par exemple un cadran à aiguille montrant la production locale instantanée ou une batterie représentant le niveau d’énergie « verte » disponible.
Nos résultats reflètent la littérature, montrant l’impact de la production d’électricité domestique sur les comportements et les pratiques, mais soulignent également le besoin de plus amples investigations pour les clarifier. Les participants ont parfois une compréhension erronée sur la quantité d’électricité qu’ils génèrent et quand. Nous soulignons également le besoin de plus ample recherche pour comprendre la relation entre génération et consommation.
Enfin, les participants ont particulièrement apprécié les fonctionnalités de prédiction telles que la prédiction de génération locale. Ils ont l’habitude de planifier les prochains jours en fonction des prévisions météorologiques et leur production d’électricité solaire a une place important dans leurs routines quotidiennes. Regarder de l’avant semble une fonctionnalité importante dans le contexte de production locale.
Étude B : Analyser l’Activité « Faire la Lessive » dans les Ménages avec Panneaux Solaires
Pour comprendre plus en détails la relation entre la production locale et l’utilisation des appareils ménagers, nous avons concentré nos recherches sur l’utilisation de la machine à laver dans 18 ménages. Nous avons collecté les données d’électricité grâce à des compteurs et des prises intelligentes sur une période huit mois : l’électricité importée et exporté vers le réseau électrique, l’électricité produite par les panneaux solaires et la consommation électrique de la machine à laver.
Nous avons quantifié le potentiel de déplacement du temps d’utilisation de la machine à laver. Cela augmenterait de manière significative le pourcentage d’électricité provenant des panneaux solaires dans la consommation de la machine à laver, alors que le bénéfice financier à l’échelle de la maison serait négligeable. Ce résultat est directement lié à la faible consommation de la machine à laver. Nous avons également exploré la répartition de l’utilisation de la machine à laver au court de la journée et de la semaine en relation avec l’énergie solaire. Enfin, notre algorithme de « Meilleur Déplacement Vert » nous a permis d’évaluer le potentiel de déplacement des consommations de la machine à laver.
L’analyse exploratoire de ces données nous a permis de comprendre comment la génération locale d’électricité est consommée. Cependant, notre objectif visait à comprendre « pourquoi » elle était ainsi. Nous avons donc conçu et implémenté une analyse participative des données (PDA) pour compléter notre interprétation avec celle des participants. Cette analyse complète la collection et l’analyse des données avec trois étapes complémentaires : Premièrement, nous avons utilisé les données collectées, notre interprétation initiale et notre expertise pour concevoir des visualisations de haut niveau représentant l’activité ‘faire la lessive’ dans le contexte de production d’électricité de source solaire pour chacun de nos participants. Ensuite, nous avons conduit une interview avec chaque participant pour construire une conversation autour de ces visualisations (leur propres données). Enfin, combinant notre interprétation avec celle des participants, nous avons formulé une compréhension de cette routine ménagère.
Nous avons mis en évidence la complexité de l’environnement et le processus de décisions autour du déplacement des consommations et noté que la synchronisation et l’interaction entre les appareils ménagers sont des obstacles majeurs pour le déplacement interactif des consommations qui demandent de plus amples explorations. Alors que nous avons mis en évidence l’engagement et la volonté de s’engager dans le déplacement interactif des consommations, ce processus prend du temps et nécessite la considération de
multiples paramètres, de la prédiction de la production d’électricité et de la météo jusqu’à des informations contextuelles liées au ménage. Les utilisateurs ont accès à un nombre croissant mais toujours limité d’information et le déplacement des consommations se fait manuellement. Cela souligne le challenge de réduire les efforts en fournissant un support à ces pratiques sans réduire l’engagement qui émerge de ce contexte.
Étude C : Déployer des Interventions pour Supporter le Déplacement des Consommations
Reposant sur les conclusions de l’étude B, cette troisième étude visait à conduire des interventions en conditions réelles autour de la machine à laver pour le support du déplacement des consommations. Nous avons expérimenté différents niveaux d’information (données brutes, valeurs calculées, suggestions avancées), temps d’interactions (passé, temps réel, future) et moyens de communication (courriels, SMS, affichages dédiés). Utilisé la technologie comme un support est une solution viable et efficace. Nous avons souligné que l’engagement et l’utilité de nos interventions étaient croissante de l’information décontextualisé vers le control contextuel embarqué (du courriel vers la tablette électronique contrôlant la machine à laver). Le support à l’énergie devrait évoluer de la boucle d’information rétroactive vers la suggestion proactive. Dans ce contexte, les décisions à propos du temps d’exécution de la machine à laver sont négociées avec l’utilisateur. Notre analyse avec les participants a révélé la complexité de la dynamique entre les habitants, les appareils ménagers et les objectifs. Etudier les activités autour de la machine à laver nous a conduit à une conversation avec les habitants qui ne se préoccupent pas spécifiquement de l’énergie dans le ménage, et donc vers un élargissement de l’audience. Mis à part les défis techniques, les appareils offrant des opportunités potentielles pour le déplacement des consommations varient d’un ménage à l’autre et au cours du temps. Enfin, maximiser l’utilisation de l’électricité produite localement est un objectif parmi d’autre, incluant le coût financier et le confort de l’utilisateur. Notre déploiement d’interactions utilisateurs a mis en évidence que les prédictions et les temps d’interventions sont des éléments essentiels pour le support du déplacement des consommations. Les interactions basées sur des prédictions, du planning et des suggestions sont plus appropriées que l’information fournis habituellement qui se concentre sur les évènements passés. L’utilisation du retour d’information est limitée car il n’y a pas grand-chose à apprendre du passé dans ce contexte. Les supports utilisateurs devraient être proactif et le plus contextuel possible. De plus, un équilibre doit être trouvé entre action manuel et automatique pour réduire l’effort de l’utilisateur sans réduire son engagement.
À travers ces interventions nous avons atteint les limites d’une étude se concentrant sur un seul appareil ménager. Bien qu’elles nous aient fourni les éléments clés pour comprendre la routine ‘faire la lessive’, nos interventions ont révélé d’importantes corrélations entre les appareils rendant difficile les interventions sur un seul d’entre eux.
Étude D : Étendre le Contexte de Recherche à un Appareils Ménager Émergeant : la Voiture Électrique
Notre objective avec cette dernière étude de terrain visait à étendre la vision construite au cours des études précédentes qui se concentraient sur la machine à laver : un appareil ménager conventionnel dont la consommation d’électricité est modérée. Nous avons exploré les routines autour de la mobilité électrique, d’abord au sens large puis spécifiquement dans la maison, soulignant une absence dans la littérature : la voiture électrique comme appareil ménagé et ça connexion avec la production d’électricité domestique. Nous avons fourni une analyse quantitative et qualitative de ce contexte.
À travers notre exploration nous avons identifié une opportunité : la plupart des participants ont confiance en leur voiture électrique et son rechargement à la maison. Cela contraste avec la littérature se concentrant jusqu’à présent sur l’anxiété liée à l’autonomie limité de ces véhicules et aux stations de rechargement publiques souvent défectueuses ou occupées. De plus nous avons souligné que le lien entre la voiture électrique et la production d’électricité domestique repose sur le désire d’être auto suffisant. Cet objectif répond aux mêmes conditions que minimiser l’impact sur l’environnement. Notre analyse quantitative a donné un aperçu des opportunités d’autosuffisance, montrant des proportions équivalentes entre la génération provenant des panneaux solaires et la consommation des véhicules électriques. Cependant, à travers une analyse plus précise nous avons mis en évidence qu’une partie seulement très limitée de l’énergie solaire est utilisée pour charger le véhicule électrique.
Nous avons fait écho à nos résultats précédents. Viser les routines de mobilité élargi l’audience autour de l’énergie. Alors qu’il y a techniquement un potentiel important d’optimisation en déplaçant le temps de charge des voitures électriques, nous avons tout de même mis en évidence quelques opportunités de flexibilité dans le temps. Nous avons confirmé l’image déjà complexe et dynamique des routines domestiques commencé avec le cas de la machine à laver. Alors que la machine à laver était un appareil bien connu qui ne nécessite pas de support particulier, nous avons souligné le besoin d’un support pour la voiture électrique dans la maison.
Cela représente une opportunité pour combiner le support au déplacement des consommations directement avec un support général à la mobilité électrique.
Modèle pour le Déplacement Interactif des Consommations
Dans la dernière étape de ce projet de recherche nous avons organisé les résultats de nos études utilisateurs A, B, C et D en perspective de la littérature pour formaliser un modèle conceptuel pour le déplacement interactif des consommations (iDS pour interactive Demand-Shifting). Ce modèle repose sur l’interaction entre quatre éléments clés : les temps d’interaction, la participation des résidents, les objectifs et les appareils ménagers. Nous proposons une « conversation numérique » pour supporter une interaction consistante de haut niveau entre les utilisateurs et le système. Enfin, nous mettons en pratique le modèle iDS à travers la conception d’un potentiel système interactif de déplacement des consommations.
Contributions
Nous fournissons une compréhension détaillée du « différentiel énergétique » et de la complexité de l’infrastructure du réseau électrique tant à l’échelle nationale qu’à l’échelle de la maison. Cette thèse a mis en évidence des bénéfices financiers limités pour un ménage. Cependant, en s’adaptant facilement à tous les ménages, cela représente un impact significatif sur le réseau électrique pour un investissement limité. L'objectif principal de cette thèse est de soutenir la consommation d'énergie durable. Les pratiques sont susceptibles d'être plus durable au fil du temps si elles sont d'abord naturellement mises en œuvre par les ménages eux-mêmes au lieu d'être poussé vers eux dans le but de changer leur comportement.
Déjà souligné dans la littérature, la gestion de l'énergie domestique doit se faire au niveau des activités et des routines et non pas sur l’analyse hors contexte des profils consommations. Sur cette base, nous proposons une « conversation numérique », permettant des interactions de haut niveau entre les ménages et le système, posant les fondations d'une négociation vers une gestion durable de l'énergie. Avec une dimension utilisateur approfondie, nous avons formulé une taxonomie des appareils ménagers. Cette taxonomie considère les perspectives du monde réel recueillies tout au long de cette thèse, considérant la diversité et la flexibilité nécessaire à la gestion de l’énergie dans la maison. En combinaison avec la conversation numérique, ils fournissent la base d’un système de gestion de l'énergie domestique plus durable pour l'ensemble du ménage. Nous avons souligné l'importance du temps des interventions. Déplacer les consommations, c’est non seulement trouver le bon moment pour consommer de l'électricité mais aussi le bon moment pour interagir
avec les résidents. En particulier, les suggestions proactives et les interventions contextuelles offre aux ménages la possibilité d'intervenir à temps avec les informations et le soutien nécessaires.
Pour construire une compréhension précise des routines internes, nous avons combiné plusieurs méthodes. Nous avons conçu et mis en œuvre une analyse de données participative (PDA) qui combine des données quantitatives et des données qualitatives pour analyser le contexte de la maison en collaboration avec les résidents. Cette méthode a été un moyen efficace pour confirmer nos premières interprétations, mais aussi pour enrichir à la fois notre analyse quantitative et qualitative avec des éléments précis du contexte.
D
ECLARATION
While I led and performed all the steps of the research presented in this dissertation, I performed parts of this work in collaboration. First, my supervisors assisted in the Technology Probes study (Chapter 4 p.65) at the early stages of this project. I provided the implementations of the probes and attended the interviews. I published and discussed my reflection on this methodology at a CHI’13 workshop. Second, I collaborated with E.ON throughout the project to access the infrastructure of the participating households. E.ON provided valuable technical support in the deployment of the Demand-Shifting interventions (Chapter 6 p.107). Finally, I led the EV study in collaboration with Stefan Foell who conducted half of the exploratory interviews (Chapter 7 p.126).
Some ideas and figures have appeared previously in the following publications:
Blaine Price, Janet van der Linden, Jacky Bourgeois, and Gerd Kortuem. When looking out of the window is not enough: informing the design of in-home technologies for domestic energy microgeneration. In First International Conference on Information and Communication Technologies for Sustainability, February 2013. URL http://oro.open.ac.uk/35460.
Jacky Bourgeois, Janet van der Linden, Blaine Price, and Gerd Kortuem. Technology probes: experiences with home energy feedback. In Methods for Studying Technology in the Home, April/Spring 2013. URL
http://oro.open.ac.uk/36791. Methods for Studying Technology in the Home was a workshop hold as part of the ACM SIGCHI Conference on Human Factors in Computing Systems (CHI) in Paris, France from 27th
April - 2nd May 2013. ISBN: 978-1-4503-1952-2.
Jacky Bourgeois, Janet van der Linden, Gerd Kortuem, Blaine A. Price, and Christopher Rimmer. Conversations with my washing machine: An in-the-wild study of demand shifting with self-generated energy. In Proceedings of the 2014 ACM International Joint Conference on Pervasive and Ubiquitous Computing, UbiComp ’14, pages 459–470, New York, NY, USA, 2014a. ACM. ISBN 978-1-4503-2968-2. doi: 10.1145/2632048.2632106. URL http://oro.open.ac.uk/40465.
Jacky Bourgeois, Janet van der Linden, Gerd Kortuem, Blaine A. Price, and Christopher Rimmer. Using participatory data analysis to understand social constraints and opportunities of electricity demand-shifting. In
2nd International Conference on ICT for Sustainability (ICT4S 2014), August 2014b. URL
http://oro.open.ac.uk/40466.
Bourgeois, Jacky; Foell, Stefan; Kortuem, Gerd; Price, Blaine; van der Linden, Janet; Elbanhawy, Eiman and Rimmer, Christopher (2015). Harvesting green miles from my roof: an investigation into self-sufficient mobility with electric vehicles. In: 2015 ACM International Joint Conference on Pervasive and Ubiquitous Computing (UbiComp 2015), 7-11 September 2015, Osaka. URL http://oro.open.ac.uk/43874.
All but the following figures and tables have been created by the author.
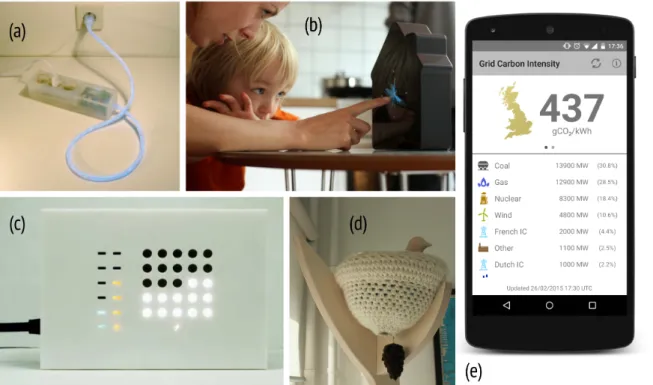
Figure 2-9a p.30: The power cord (Gustafsson & Gyllenswärd, 2005). ACM Copyright Clearance Figure 2-9b p.30: The energy clock (Broms, et al., 2010). ACM Copyright Clearance
Figure 2-9c p.30: The local energy indicator (Pierce & Paulos, 2012). ACM Copyright Clearance
Figure 2-9d p.30: The Peacetime tree (Wessman, Colombo, & Katzeff, 2015) – Approval from the author
by email.
Figure 2-9e p.30: The carbon intensity – Approval from the author by email.
Figure 2-10a p.33: The load provisional schedule Yupik (Bapat, et al., 2011). ACM Copyright Clearance Figure 2-10b p.33: The TariffAgent (Alan, et al., 2014) – Approval from the author by email.
Figure 2-11a p.36: The ‘Smart Wash’ (Kobus, Mugge, & Schoormans, 2013) ‘Taylor & Francis is pleased to
offer reuses of its content for a thesis or dissertation free of charge contingent on resubmission of permission request if work is published.’
A
CKNOWLEDGEMENTS
What an unforgettable experience! It has been a great journey into my personal and professional development. An initial step which gave me the passion for undertaking and feeding the research discourse. This thesis has been possible thanks to many people. I thank you,
My team of five supervisors! Gerd Kortuem, who trapped me with a first 6-month internship and inspired me through his wide vision of Ubiquitous Computing and beyond. Janet van der Linden, who pushed me towards her rigorous and contagious passion for the research discourse. Blaine Price, who supported me through my hazardous language, in-the-wild studies and administrative challenges. Johann Bourcier, who provided me with a contrasted view of research through software engineering and his remote yet invaluable support. And Benoit Baudry, who gave me the few key advice to drive me along the way.
My reviewers and examiners, Tom Rodden, François Taiani, Mark Woodroffe, Jean-Yves Tigli and Michel Riveill, for their insightful comments and the engaged discussion they offered me during the Viva.
The MK:Smart team who gave a new dimension to the work we tried to start. A special thanks to Stefan Foell and Eiman Elbanhawi who collaborated with me in the Electric Vehicle studies.
E.ON and the team of the Thinking Energy trial who made possible a project of this magnitude, especially Christopher Rimmer, Simon Church, Elizabeth Andrew, Christopher Utting and Tony Lee-Delisle.
Andre, Andrew, Andrew, Blaine, Brian, Chris, Claire, Clive, Colin, Darren, David, Deborah, Galina, Gary, Gary, Hoa, Ian, Jane, Jason, John, Jon, Marion, Marion, Matthew, Mohamed, Penny, Peter, Peter, Reg, Richard, Robin, Trevor, Wilson, Yulia and their households for the invaluable participation to our studies. The folks of the Department of Computing and Communications at The Open University, especially Mike Richards, Marian Petre and Robin Laney for their support and guidance, as well as the folks of the DiverSE research group at INRIA.
And Dominique and Martine Bourgeois, Pierrot, Nelly and Gaëlle Vert who took turns over the last four years to listen my nonsense, wake me up, slow me down, make me laugh and keep me motivated.
E
NVIRONMENTAL
I
MPACT
The overarching objective of this research project is more sustainable energy use. From that perspective, it is important to highlight the impact of this research on the environment over the last 3 years.
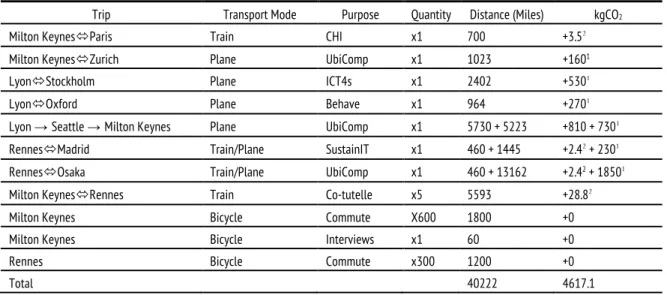
Table 1-1 details the transport directly related to the work for this thesis. We can observe that my travels to
conferences generated 4.6 tonnes of CO2 while my daily commutes over 3 years avoided the emission of
614kg of CO2.
Table 1-1 Impact carbon of the transport during this thesis.
Trip Transport Mode Purpose Quantity Distance (Miles) kgCO2
Milton KeynesóParis Train CHI x1 700 +3.52
Milton KeynesóZurich Plane UbiComp x1 1023 +1601
LyonóStockholm Plane ICT4s x1 2402 +5301
LyonóOxford Plane Behave x1 964 +2701
Lyon → Seattle → Milton Keynes Plane UbiComp x1 5730 + 5223 +810 + 7301
RennesóMadrid Train/Plane SustainIT x1 460 + 1445 +2.42 + 2301
RennesóOsaka Train/Plane UbiComp x1 460 + 13162 +2.42 + 18501
Milton KeynesóRennes Train Co-tutelle x5 5593 +28.82
Milton Keynes Bicycle Commute X600 1800 +0
Milton Keynes Bicycle Interviews x1 60 +0
Rennes Bicycle Commute x300 1200 +0
Total 40222 4617.1
The raw estimation of paper consumption over three years is about seven reams (18kg, 6% of a tree per ream3). This value can be put in perspective of advertisements received in mailbox. In France, a household
without the ‘Stop Pub’ sticker on its mailbox, receives 2.7kg of paper per month in 20144. This research
project represents about 6.5 months of domestic advertising.
1 Flight carbon footprint calculated on http://www.carbonneutralcalculator.com/flightcalculator.aspx 2 TGV, 5.14gCO
2/miles/passenger (SNCF)
3 http://conservatree.org/learn/EnviroIssues/TreeStats.shtml
C
ONTENTS
CHAPTER 1 – INTRODUCTION: Supporting the Future Energy Strategy 1
1.1 Domestic Micro-generation 1
1.2 Micro-generation and Transition 3
1.3 The Energy Gap 4
1.4 Supporting Demand-Shifting to Reduce the Energy Gap 5
1.5 Demand-Shifting Line 7
CHAPTER 2 – Literature Review: Domestic Electricity Demand-Shifting 9
2.1 Towards Domestic Electricity Demand-Shifting 9
2.1.1 Generation and National Energy Policies 10
2.1.2 The Demand: Electricity in the Home 14
2.1.3 Distributed Generation: the Case of Solar PV 17
2.1.4 Summary: Minimising Import and Export 19
2.2 Demand-Shifting 19
2.2.1 Definition 19
2.2.2 Motivation 22
2.2.3 Summary: Needs for a deeper Demand-Shifting Investigation 25
2.3 Approaches to Demand-Shifting 26
2.3.1 Demand-Side Management from the Grid 27
2.3.2 Eco-Feedback: Driving Behaviour Change 29
2.3.3 Supporting Decision or Implementation of Demand-Shifting 33
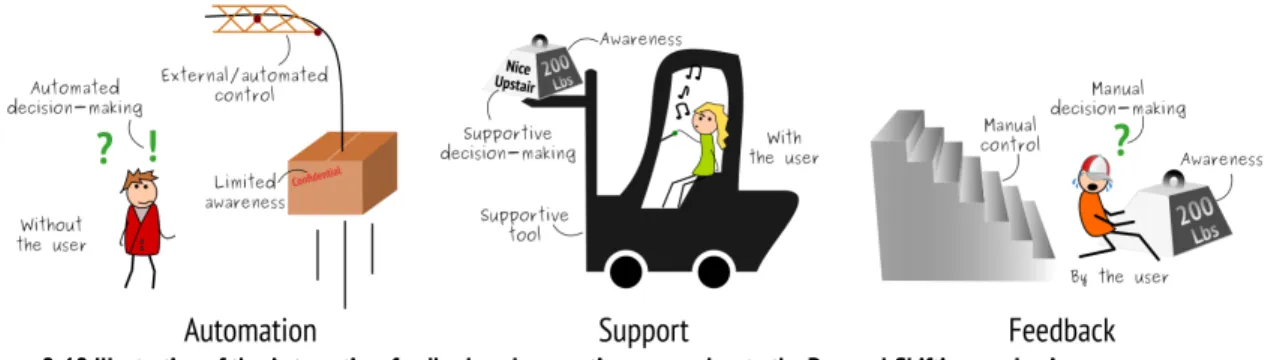
2.3.4 Summary: Providing support between manual and fully automated 37
2.4 Domestic Demand-Shifting Mechanism 38
2.4.1 Monitoring: What is actually happening? 38
2.4.2 Predicting: What is going to happen? 41
2.4.3 Optimising: What would be the best? 44
2.4.4 Resident-Computer Interaction 46
2.4.5 Summary: Ingredients without the recipe 48
2.5 Chapter Summary: Towards a Supportive Demand-Shifting Mechanism 49
CHAPTER 3 – Research Methodology: A Mixed Method Approach 51
3.1 A Mixed-Methodology Approach 51
3.1.1 Studying technology in the home 52
3.1.2 Research Epistemology 52
3.1.3 Focusing on two Domestic Routines: Doing the laundry and Electric Mobility 53
3.2 Evaluation Methods 54
3.2.1 Thematic Analysis 55
3.2.2 Exploratory Data Analysis 56
3.3 Investigation Methods 57
3.3.1 In-the-wild Research 57
3.3.2 Research through Design 57
3.4 Data Collection 58
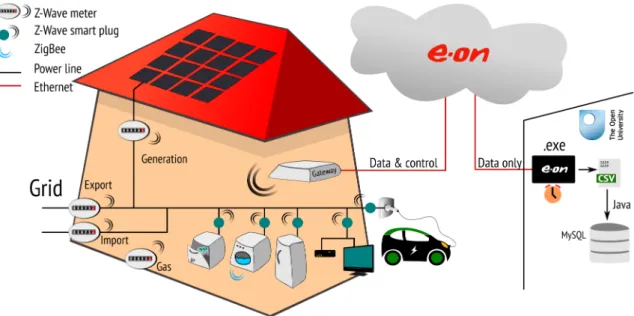
3.4.1 Industrial Collaboration: E.ON and the Thinking Energy Project 58
3.4.2 Technology Setting 60
3.4.3 Qualitative Data 61
3.4.4 Quantitative Data 62
3.5 Ethics 62
3.6 Chapter Summary: A Glimpse on ‘How’ 64
CHAPTER 4 – Exploring the Connection between Consumption and Local Generation: A Technology Probe Study 65
4.1 Stimulate Contextual Feedback: Technology Probes 65
4.1.1 Approach 65
4.1.2 Protocol 66
4.2 Designing the Probes 68
4.3 Findings: Location and Abstraction 70
4.3.1 Locality 71
4.3.2 The right kind of information 72
4.3.3 Abstractions and Representations 73
4.4 Discussion 75
4.4.2 People believe they know, but they don’t 76
4.4.3 There is a wide variation of how and why people engage with micro-generation 76
4.5 Reflection on the Technology Probes Method 77
4.6 Chapter Summary: Motivations for A deeper Exploration 78
CHAPTER 5 – Understanding Demand-Shifting Behaviours: A Participatory Data Analysis of Laundry Routines 79
5.1 Participatory Data Analysis (PDA) 80
5.2 Collecting and Analysing the Data 82
5.2.1 ’Greener Whites’ Participating Households 82
5.2.2 Exploring the connection between consumption and generation 83
5.2.3 Summary 90
5.3 Designing and Reflecting 91
5.3.1 Data and Visualisations 91
5.3.2 Analysing with participants 95
5.4 Findings 96
5.4.1 Insights of Interviews and Visualisations 96
5.4.2 Shifting in Context 97
5.4.3 Decision Making Processes 100
5.4.4 Motivations and Convenience 101
5.4.5 Appliances 102
5.5 Discussion: Understanding Laundry Routines 103
5.6 Reflection on the PDA Method 104
5.7 Chapter Summary: The Complexity of Demand-Shifting 106
CHAPTER 6 – Supporting Demand-Shifting Behaviours: In-the-wild Interventions around the Washing Machine 107
6.1 In-the-wild Interventions 108
6.1.1 Implementation 108
6.1.2 Participants and Schedule of Intervention 109
6.1.3 User evaluation 109
6.2 Delayed Feedback 110
6.2.1 Design of Feedback via Email 110
6.2.2 Findings: Decontextualized Information 111
6.3 Real-Time Feedback 111
6.3.1 Design of Text Message Feedback 111
6.3.2 Findings: It is too Late 112
6.4 Proactive Suggestion 114
6.4.1 Design of Suggestion via Text Message 114
6.4.2 Findings: Proactive Information is Key 114
6.5 Contextual Control 115
6.5.1 Design of a Washing Machine Control 115
6.5.2 Findings: Control, Interaction and Information 118
6.6 Discussion 120
6.6.1 Disseminating Information 120
6.6.2 High-level Information 121
6.6.3 Widening engagement around energy 122
6.7 Chapter Summary: Towards Proactive and Contextual Support 122
CHAPTER 7 – Looking at a New Form of Home Electricity Consumption: Electric Vehicle and e-Mobility 125
7.1 Exploration: the EV context 125
7.1.1 Exploratory interviews 126
7.1.2 The EV as a New Form of Home Electricity Consumption 128
7.1.3 Summary: Research Gap Connecting Home and EV 133
7.2 Analysing: Solar Generation and EV 133
7.2.1 Data Collection 133
7.2.2 EV Mobility 134
7.2.3 Home Electricity 136
7.2.4 EV Charging with Self-Generated Electricity 138
7.2.5 Summary 139
7.3 Designing: The Mobility Clock 140
7.4 Reflecting with Participants on E-Mobility Behaviours 142
7.4.1 Daily Usage 143
7.4.2 Planning 144
7.4.3 Roles of EV Users 145
7.4.4 Plug-in and Charging Activities 145
7.4.5 Free Public Charging as a Replacement for Home Charging 146
7.4.6 EV and Solar PV Connection 147
7.5 Understanding Behaviours 148
7.5.1 Viability of Powering EVs with Domestic Solar Electricity 148
7.5.2 Flexibility of Mobility Demand in Time and Space 149
7.5.3 Implications: Towards Supportive Tools 149
7.6 Reflection on Participatory Data Analysis 150
7.7 Chapter Summary: Demand-Shifting among Other Needs for Support 151
CHAPTER 8 – Designing a User-Centred System: A Framework for interactive Demand-Shifting 153
8.1 Conceptual Framework 153
8.2 Four Key Ingredients for Domestic Energy Management 154
8.2.1 Emerging Energy Behaviours 154
8.2.2 Extending interactions 156
8.2.3 Widening the Participation 159
8.2.4 Formalising Activities’ Interfaces 161
8.2.5 Organising Four Key Elements 164
8.3 Digital Conversation 165
8.3.1 Reflecting on an Ideal Conversation 165
8.3.2 Implications and Challenges 168
8.4 A Digital Conversation for Interactive Demand-Shifting 169
8.4.1 Predictive 170
8.4.2 Reactive 172
8.4.3 Reflective 174
8.5 Chapter Summary 175
CHAPTER 9 – Conclusion: Towards Sustainable Opportunities 177
9.1 Back to the research Questions 177
9.2 Contributions 180
9.3 Limitations 183
L
IST OF
F
IGURES
Figure 1-1 Head of the Demand-Shifting line, red thread of this dissertation. 1
Figure 1-2 The energy gap in the residential context. 4
Figure 1-3 Demand-Shifting line. 7
Figure 2-1 The literature line. 9
Figure 2-2 UK's electricity generation by type of fuel in GW on May 27th, 2015. 11
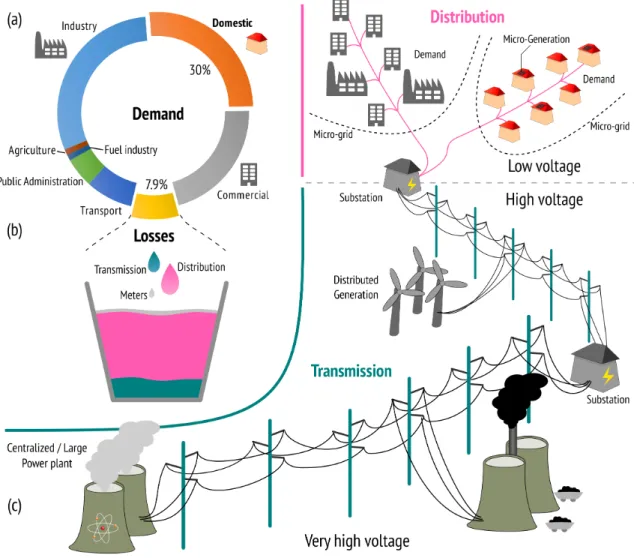
Figure 2-3 From supply to demand. 13
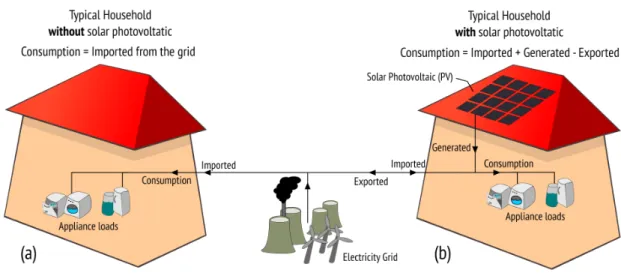
Figure 2-4 Electricity relationship in typical household. 15
Figure 2-5 Electricity consumption and solar electricity generation of a typical household with solar PV over one day. 16
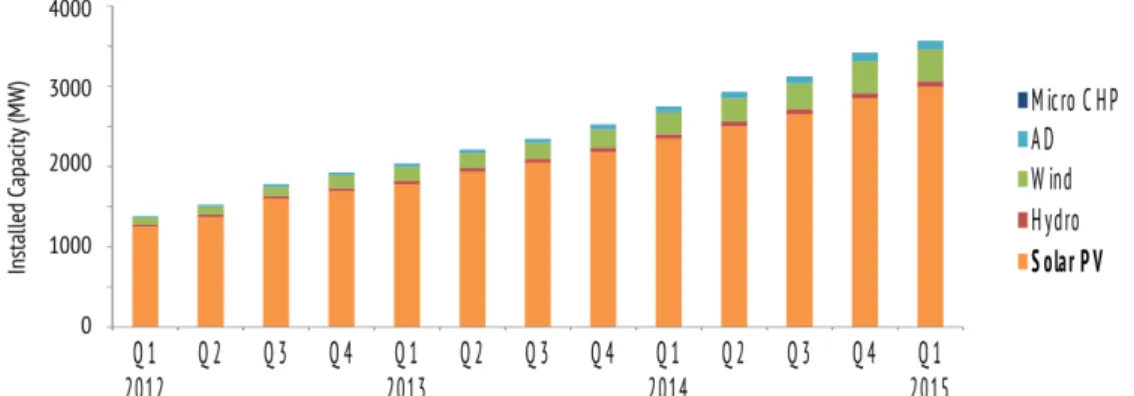
Figure 2-6 Installed capacity under Feed-in Tariff contract. 17
Figure 2-7 FiT policies in the UK, Germany and France. 18
Figure 2-8 Demand-Shifting of interactive appliances such as the washing machine. 21
Figure 2-9 Eco Feedback literature. 30
Figure 2-10 Demand-Shifting support. 33
Figure 2-11 Micro-generation feedback. 36
Figure 2-12 Illustration of the Automation, feedback and supportive approaches to the Demand-Shifting mechanism. 38
Figure 2-13 Flattening the demand of appliances running in the background. 45
Figure 2-1 User-centric, mixed-method approach. 51
Figure 3-2 Overview of the studies. 54
Figure 3-3 E.ON /The Open University initial technical setting. 60
Figure 4-1 Probe kit in situ. 68
Figure 4-2 Technology Probe Interface. 70
Figure 5-1 Participatory Data Analysis. 80
Figure 5-2 Daily average energy. 83
Figure 5-3 Instant power in H12WM on July 15th 2013. 84
Figure 5-4 Average number of washing machine load per day of the week. 86
Figure 5-5 Washing machine load intensity per day of the week. 87
Figure 5-6 Mapping of Washing Machine and Solar PV energy in the home for each participant. 87
Figure 5-7 Example of load shifted from the evening to the middle of the day, at solar electricity generation time. 89
Figure 5-8 Laundry and Washing Machine Study - Participatory Data Analysis in situ (H17WM). 91
Figure 5-9 Washing machine load waste over July 2013. 92
Figure 5-10 Washing machine load shifting over July 2013. 94
Figure 5-11 Washing machine load savings over July 2013. 95
Figure 6-1 Interventions through the washing process. 107
Figure 6-2 Energy over the current day – Partly actual/Partly predicted data. 109
Figure 6-3 Timeline of interventions. 109
Figure 6-4 Intervention 1: delayed feedback by email. 110
Figure 6-5 Intervention 2: Reactive feedback. 111
Figure 6-6 Washing machine contextual control – Architecture. 116
Figure 6-7 Washing machine control. 117
Figure 6-8 Washing machine contextual control – Example in situ. 118
Figure 7-1 EV mobility. 135
Figure 7-2 Daily overall consumption, EV charging station consumption and solar PV generation. 136
Figure 7-3 Mapping of EV and PV energy in the home. 137
Figure 7-4 Distribution of charging events during and within days versus PV generation. 139
Figure 7-5 Collecting data. 140
Figure 7-6 Mobility clock. 141
Figure 7-7 Interviews pictures. 142
Figure 8-1 Four key elements to frame the outcome of this thesis. 153
Figure 8-2 Purpose and time of interaction. 157
Figure 8-3 Digital Conversation framework. 165
Figure 8-4 Conversation in the context of interactive Demand-Shifting. 166
Figure 8-5 Digital Conversation to support interaction between user and elements of the system. 167
Figure 8-6 iDS as a system of autonomic elements. 170
Figure 8-7 Predictive element. 170
Figure 8-8 Reactive element. 172
Figure 8-9 Reflective element. 174
Figure 9-1 End of the Demand-Shifting line, red thread of this dissertation. 177
Figure 9-2 Thesis map. 182
L
IST OF
T
ABLES
Table 1-1 Impact carbon of the transport during this thesis. 18
Table 4-1 Technology Probes study – Participating households. 67
Table 5-1 Participating households - Greener Whites 83
Table 5-2 Washing machine consumption in relation to local solar generation a day. 85
Table 5-3 Average potential and disruption of washing machine load shifting across all participants over 8 months. 90
Table 7-1 Study participants. 127
Table 8-1 Talking about shiftable appliances. 162
Table 8-2 Appliance taxonomy based on user studies. 163
1
1
Introduction
Supporting the Future Energy Strategy
‘Fire made us human, fossil fuels made us modern, but now we
need a new fire that makes us safe, secure, healthy and durable.’
AMORY LOVINS,REINVENTING FIRE,2012
CHAPTER 1 – INTRODUCTION: Supporting the Future Energy Strategy
Amory Lovins stresses the need for a new ‘fire’, a radical change towards sustainability. We believe that this ‘fire’ will come through the harmonisation of our planet’s resources with people’s aspiration. This thesis makes a modest step towards this objective, looking at How can digital tools leverage
Demand-Shifting practices in the context of domestic micro-generation?
1.1 D
OMESTIC
M
ICRO
-
GENERATION
Distributed electricity generation is considered an important piece in the puzzle of our future energy strategy (Lovins, Amory B. and Rocky Mountain Institute, 2011). Germany, a leader in renewable energy (21% of the global installed solar PV capacity), derives about 7%5 (2014) of its electricity from solar energy. It shows
concrete evidence of an energy transition taking place through alternative electricity generation such as
micro-generation – any generation of heat or electricity up to 50kW or 45kW thermal6. In the UK, like in
many countries, a national rollout requires energy suppliers to install smart meters along with an In-Home Display (IHD) in every household and small business by the end of 20207. These devices provide real-time
energy feedback and opportunities for energy control in each individual household. In combination with micro-generation, they are the core ingredients of the ‘smart grid’, an emerging electricity network consisting of small prosumer households that is more cost effective and more energy efficient.
5 Fraunhofer Institute for Solar Energy Systems (ISE), Photovoltaic report, March 2016
6 Including biomass, biofuels, fuel cells, water, wind, photovoltaics, solar power, geothermal sources, CHP (Energy Act, Chapter 20, 2004, p. 65) 7 DECC – Smart Metering Implementation Programme
Figure 1-1 Head of the Demand-Shifting line, red thread of this dissertation.
Following the analogy of underground maps, we build the network of this dissertation throughout the document (Full map p. 182).
Meanwhile, domestic micro-generation is increasing at a high pace, dominated by solar photovoltaic (PV). Today, we can buy solar PV installation kits in popular stores like IKEA. Even if the adoption of this technology remains slow, it means that potentially ordinary households can become ‘energy farmers’. Domestic heating and transport are also shifting to electricity based technologies. Typical examples are heat pumps and electric vehicles (EV). This new electric home electricity consumption will increase domestic energy consumption, representing already 27%8 of energy consumption in the UK (in 2014, including 25% of electricity9). While
investments into insulation improvement and efficient appliances can reduce electricity consumption, householder’s behaviours impact this consumption too. This impact has been highlighted by showing variations between similar houses that cannot be explained by technical difference alone (Sonderegger, 1978; Hiller, 2012). Most citizens are unaware of what they can do to reduce consumption. Energy consumption feedback is a first step towards raising energy awareness and a few projects have already shown a significant impact on reducing overall consumption (Fischer, 2008; Darby, 2006). Yet, existing energy feedback are not sufficient for three reasons:
• First; this information is often in the form of incomprehensible values and graphs.
• Second; the concepts related to energy are hard to understand because of the invisible and intangible nature of energy and electricity.
• Finally, despite previous energy crises, electricity is commonly seen as an unlimited resource with few, if any, environmental drawbacks.
We can observe a contrast between the simplicity of using electricity and the difficulty for typical users to understand the various concepts associated with electricity. The emerging development of micro-generation and new electric appliances such as EVs adds another layer of complexity on top of this complex home electricity system. The overarching objective of the research about energy consumption feedback focuses on rising energy awareness and driving behaviour change towards energy consumption reduction. However, research on emerging practices in the context of micro-generation as well as their role in the design of future domestic energy management systems remains underexplored.
8 DECC – Energy Consumption in the UK (2015), Chapter 1: Overall energy consumption in the UK since 1970 (p.10)
1.2 M
ICRO
-
GENERATION AND
T
RANSITION
Domestic micro-generation will play a major role to drive energy behaviour change (Devine-Wright, 2007). It does not only produce renewable energy, but brings the process of electricity production closer to where the electricity is consumed and makes energy more tangible (Dobbyn & Thomas, 2005).
Through the ‘grid lens’, domestic micro-generation is part of a global transition:
• from distant, centralised, on-demand, hidden, virtually unlimited and undifferentiated sources of electricity
• to much smaller scale, distributed, uncontrolled, local, personal, visible, limited, ‘green or dirty’, ‘free, cheap or expensive’ sources of electricity.
Through the ‘domestic lens’, households investigating technologies such as solar PV or EV make the implicit choice of building new or altering their daily routines. While households with solar PV are not forced to do so, most of them change their daily routines. In a study comparing households with and without generation (Dobbyn & Thomas, 2005), Dobbyn and Thomas report that most of the households with micro-generation they interviewed developed a strong awareness about their energy use and the link between usage and generation. These households exhibit evidence of energy efficiency behaviour change but people were also reporting that they were feeling ‘good’ and ‘proud’ about their technology. Most householders tended to reduce their consumption and had shifted their consumption towards times when solar electricity generation was available.
Building on this work, Bergman and Eyre discuss the central role that micro-generation can play in the domestic energy transition (Bergman & Eyre, 2011). However, they highlight that ‘maximising uptake of
micro-generation is insufficient to maximise savings’. This is because householders who invest in alternative energies are
already engaged in a process of energy awareness, and are doing so out of both ‘green’ and financial interests. The renewables energy industry promises both green consumption and reduced energy bills. However, when households invest in domestic generation they are often left alone without the support or tools to help them understand how to optimise the use of these new energy sources. This research project aims to capitalise on these opportunities of transition and micro-generation, looking in depth at energy practices emerging from this context and designing digital tools to support householders through their implementation and deployment.
1.3 T
HE
E
NERGY
G
AP
Above, we have highlighted the increasing technical complexity of the home energy system. On top of that, these technologies are out of sync, producing and consuming electricity at different times, creating what we refer to as a domestic energy gap.
Figure 1-2 The energy gap in the residential context. 1: high consumption throughout the day, 2: peak time consumption, 3: peak time
generation. Notes: This chart represents fictitious data to provide an overall yet simpler view (see Chapter 5 for actual chart)
We define the energy gap as this difference between the overall electricity consumption and the renewable electricity generation. In the context of domestic solar generation, the energy gap is a set of three issues (see
Figure 1-2):
1. It is generally acknowledged that overall, households consume too much electricity and should aim to reduce their consumption.
2. The domestic consumption pattern is not evenly distributed throughout the day. Instead it shows sharp peaks during the morning and the evening.
3. On the other hand, the peak of solar generation is at a different time, i.e. around noon. Since solar electricity generation and electricity consumption are out of sync renewable energy is not consumed locally.
Apart from reducing electricity consumption, Demand-Shifting is a method to reduce the energy gap. Demand-Shifting is a particular form of behaviour change where energy consumption is shifted towards better times, e.g. when the electricity cost is at its cheapest, the local generation is at its highest, etc. The literature also refers to ‘load shifting’ as a mechanism that aims to move the electricity load from the consumption peak hours (Figure 1-2 2) to off-peak hours during the day. In this thesis we refer to the term ‘Demand-Shifting’ as shifting an activity considering the interplay between householders, devices and the environment at a given time.
1.4 S
UPPORTING
D
EMAND
-S
HIFTING TO
R
EDUCE THE
E
NERGY
G
AP
In the previous section we emphasised the challenges and the opportunities of domestic electricity context. Electricity in the home is increasingly complex while there is some evidence that households with solar PV would like to optimise the use of their local generation. In this thesis we explore these issues in more depth to get a better understanding of what it is householders themselves are actually doing to exploit the potential of their locally generated electricity. In contrast with previous research focusing on driving behaviour change towards consumption reduction, this research will take a different approach and investigates how best to support behaviour changes to reduce the energy gap. More precisely, we focus on Demand-Shifting through the following research question for the thesis as a whole:
How can digital tools leverage Demand-Shifting practices in the context of domestic micro-generation?
We addressed this research question in three steps to explore, understand and support Demand-Shifting. We mixed engineering and empirical approaches, mutually strengthening and informing one another to provide an overall solution. This includes qualitative and quantitative research approaches through the collection of data from smart meters and other sensors, participatory data analysis, longitudinal studies, interviews, co-design, simulation and real world testing. Throughout this research project we used a user-centric methodology at each stage to inform and validate the research.
First, we developed a qualitative and quantitative understanding of Demand-Shifting practices and their potential impact. Who manages energy and demand-shifting in the household? What are the conditions, requirements and difficulties of this practice? From a quantitative perspective, what are the potential savings of Demand-Shifting? We frame this exploration through the following question:
RQ1. How do Demand-Shifting practices take place in the context of domestic solar generation?
In collaboration with E.ON, an International energy provider, we conducted four user studies focusing on laundry and electric mobility routines in the context of domestic solar electricity generation. We extracted a deep understanding of Demand-Shifting practices in the context of domestic solar electricity generation. In particular, we highlight how and why manual Demand-Shifting takes place. We emphasise the willingness of
most householders to manually implement Demand-Shifting behaviours but also the constraints and difficulties they encounter as part of normal day-to-day life. We provide a quantitative and qualitative evaluation of the potential of Demand-Shifting. To build this understanding of Demand-Shifting practices, we developed an in-the-wild methodology we call ‘Participatory Data Analysis’ (PDA). Combining quantitative and qualitative data into individual and personalised visualisations, this methodology allows us to collaborate with participating households to extract necessary details of their daily routines in order to prototype supportive digital tools. We used this methodology in both studies with other methods.
Second, we look at the interaction between the householder and the system. How do we best support householders in their attempt to manage their consumption and generation? Is typical energy feedback a suitable way to provide this Demand-Shifting support? What are the constraints and the new requirements for this interaction?
RQ2. What are the requirements for the interaction between system and householders when the aim is to support Demand-Shifting practices?
We explore the context of domestic micro-generation, conducting longitudinal energy data collections and multiple interviews with 38 participating households. Relying on a combination of quantitative and qualitative analysis, we provide design and user evaluations of user interactions to support Demand-Shifting. Through these designs we highlight major differences between driving behaviour change and supporting emerging energy
practices. While information such as energy feedback increases energy awareness, we highlight that supporting
Demand-Shifting requires a more predictive, contextualised and digested form of interaction.
Finally, we use the adaptation and support requirements (RQ1) with the user interaction (RQ2) and the perspective of the literature to design a system supporting domestic Demand-Shifting.
RQ3. How can we design a realistic and interactive digital system to support domestic Demand-Shifting?
Through the design of a conceptual framework for interactive Demand-Shifting (iDS), we present a realistic view of the Demand-Shifting potential. We show the feasibility of the proposed solution and the remaining challenges.
1.5 D
EMAND
-S
HIFTING
L
INE
This thesis is a journey towards an interactive Demand-Shifting system. Figure 1-3 illustrates the main stations along the way, through exploration, understanding and intervention.
Figure 1-3 Demand-Shifting line.
In Chapter 2 we take on board the background and existing literature of this research. First, we look at the context with different lenses from the electricity grid to the home electricity system. Then, we provide the motivations and a definition of the Demand-Shifting mechanism. We review the three existing approaches to this mechanism – Demand-Side Management (DSM), eco-feedback and supportive tools. Finally, we detail the main ingredients for the Demand-Shifting mechanism.
Diving into the research methodology, Chapter 3 aims to motivate the user-centric approach of this project. We present the epistemology of the research along the evaluation and investigation methods we selected to conduct this project, as well as our collaboration with E.ON.
In Chapter 4 we present our study A, a first investigation into the domestic solar generation context focusing on the connection between the domestic solar generation and daily routines. Then, study B led us towards a better understanding of the Demand-Shifting practices with a focus on the washing machine and the laundry routines (Chapter 5): How does self-generated electricity alter a longstanding household routine? In
Chapter 6 we present the study C in which we deployed concrete in-home interventions to support
Demand-Shifting practices around the washing machine. Finally, we complement this view with the study D (Chapter 7) through an exploration of Electric Vehicles (EV) and emerging electric mobility behaviours. How do EV routines modify the home routines? How does it connect to the local generation?
Chapter 8 provides a discussion of the user studies A, B, C and D and organise the key findings into a
conceptual framework for interactive Demand-Shifting (iDS). We bridge the gap between engineering and user-centric research through the design of an iDS system.
Summarising the research project, the Chapter 9 concludes this dissertation addressing the research questions and highlighting the contributions and the limitations.
2
2
Literature Review
Domestic Electricity Demand-Shifting
‘I have not failed. I’ve just found
10,000 ways that won’t work.’
THOMAS A.EDISON
CHAPTER 2 – Literature Review: Domestic Electricity Demand-Shifting
In this thesis, we look at opportunities to support householders through digital tools in the context of domestic micro-generation. This topic is spanning across the domains of energy, human-computer interaction and software engineering. Hence, this chapter brings the necessary knowledge of these domains while building the connections between them. First, we discuss the energy terminology and key issues that motivate this work. We draw the path from the grid towards domestic electricity and micro-generation. Second, we use this knowledge to properly define and motivate the Demand-Shifting mechanism. We strengthen these motivations with early evidence from the literature. Third, we look across domains at existing approaches for domestic electricity Demand-Shifting from Demand Side Management to eco-feedback and supportive systems. For each of these approaches we look specifically at three perspectives: the objectives, the algorithms and the implementations. Finally, we use these perspectives to funnel our path through software engineering and detail the key challenges and requirements for the Demand-Shifting mechanism.
2.1 T
OWARDS
D
OMESTIC
E
LECTRICITY
D
EMAND
-S
HIFTING
To understand the challenges behind electricity coming on-demand out of any power outlet, it is necessary to gain an overall perspective, looking at the wider environment of electricity. What are the fundamental dimensions and principles of electricity? How do we produce electricity? And how do we route it towards the power outlet? Through this section we draw the path towards domestic electricity Demand-Shifting from the
Figure 2-1 The literature line. We review the existing literature from the
background to the definition of Demand-Shifting (DS); then beyond, looking at DS approaches and DS mechanism.
electricity grid to the individual house and micro-generation while providing the necessary terminology. This section focuses on three dimensions of the grid that motivate and drive this research:
• First, we introduce the carbon intensity of the grid, what it represents and why we use it as a relevant measure of environmental impact in this project;
• Second, we highlight the critical requirement of balancing electricity generation and consumption, shedding light on its impacts and challenges. This is the main argument for a better energy management; • Finally, we focus on energy losses, highlighting the significant amount of electricity lost during the transport from suppliers to consumers. This is another motivation for consuming electricity generated locally.
2.1.1 G
ENERATION ANDN
ATIONALE
NERGYP
OLICIESIn most developed countries, the history of electricity drove the current layout of the grid: a centralised electricity network dominated by a few large generators. These power plants produce electricity from various raw materials such as gas, oil, coal, uranium and water. For about a decade, the use of wind and solar energy have begun to be viable technologies in the landscape of electricity generation. Each of these fuels, from the conventional coal power plant to the latest wind turbine or solar photovoltaic technology, impacts the carbon
intensity of the electricity consumed by the end-user. The carbon intensity – in grams of carbon dioxide per
kilowatt-hour (gCO2/kWh) – represents the amount of CO2 emitted to produce electricity10. It only considers
the carbon dioxide emitted as the consequence of electricity generation. In contrast, the carbon footprint (gCO2eq/kWh – ‘eq’ standing for equivalent) includes the entire life cycle of the power plant. For example,
solar photovoltaics require currently a significant amount of energy to be produced and recycle. This increases their carbon footprint. However, the production of electricity coming out of solar photovoltaics does not emit CO2, keeping their carbon intensity to zero. Thus, domestic electricity consumption plays a role on the carbon
intensity by controlling how and when the electricity is consumed.
The Example of UK’s National Grid
Balancing supply and demand is the prerequisite for a stable electricity grid and guarantees a secure supply. By nature, an electricity network fails when the difference between supply and demand is too high. This can cause power failure, dropping electricity for an entire region. Over the last decades, electricity providers learned to predict the electricity demand for the following hours and days in order to anticipate the required electricity production. This allows, for example, warming up a coal or gas power plant and thus being ready for a peak
demand. This relies on finely tuning the production of controllable power generation. This challenge of meeting the demand is harder with the development of electricity production based on renewable energy such as solar and wind. In that case, electricity providers need to anticipate both the demand and the renewable electricity generation in order to compensate with controllable generation to ensure the balance of the grid. For example, a solar eclipse and hot summer days have provoked both a drop in supply and over-production in Germany in recent years11.
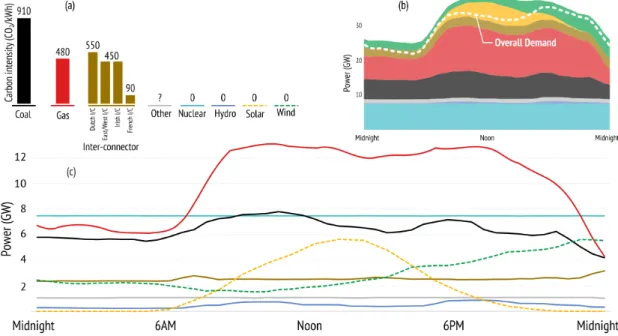
To describe the challenges of the multiple types of fuel supplying electricity towards the grid, we look at a concrete example of the grid mix on May 27th 2015 in the UK. The generation of the UK’s main power plants
are reported every 30 minutes on the BM website12 (solid lines in Figure 2-2c). Such data does not exist for
micro-generation yet. In fact, there is no grid scale monitoring of micro-generation in the UK at the moment. However, the National Grid website13 provide a fine-grain prediction of solar and wind micro-generation
(dashed lines in Figure 2-2c). These estimations take into account the installed capacity and the weather.
Figure 2-2 UK's electricity generation by type of fuel in GW on May 27th, 2015. a: carbon intensity per fuel in CO2/kWh (www.gridcarbon.uk);
b: stacked generation by type of fuel with overall demand; c: Generation by type of fuel. Notes: Solid lines are monitored data while dashed lines (solar and wind) are estimations based on installed capacity and weather. Inter-Connectors are grid connections with other countries. Based on this combination of data, Figure 2-2c presents a view of the UK’s electricity generation on May 27th, when conventional fuels were dominating as usual. The straight light blue line under 8GW represents the
11 Eclipse in Germany:http://www.greentechmedia.com/articles/read/German-and-European-Power-Grids-Civilization-Intact-Following-Solar-Eclips
12 BM reports: http://bmreports.com
13 Estimation from NationalGrid: http://www2.nationalgrid.com/UK/Industry-information/Electricity-transmission-operational-data/Data-Explorer/