HAL Id: hal-01384388
https://hal.inria.fr/hal-01384388
Submitted on 19 Oct 2016
HAL is a multi-disciplinary open access
archive for the deposit and dissemination of
sci-entific research documents, whether they are
pub-lished or not. The documents may come from
teaching and research institutions in France or
abroad, or from public or private research centers.
L’archive ouverte pluridisciplinaire HAL, est
destinée au dépôt et à la diffusion de documents
scientifiques de niveau recherche, publiés ou non,
émanant des établissements d’enseignement et de
recherche français ou étrangers, des laboratoires
publics ou privés.
Using VisKit: A Manual for Running a Constructive
Visualization Workshop
Samuel Huron, Sheelagh Carpendale, Jeremy Boy, Jean-Daniel Fekete
To cite this version:
Samuel Huron, Sheelagh Carpendale, Jeremy Boy, Jean-Daniel Fekete. Using VisKit: A Manual for
Running a Constructive Visualization Workshop. Pedagogy of Data Visualization Workshop at IEEE
VIS 2016, Oct 2016, Baltimore, MD, United States. �hal-01384388�
Using VisKit:
A Manual for Running a Constructive Visualization Workshop
Samuel Huron∗
T ´el ´ecom ParisTech, Universit ´e Paris Saclay,
CNRS i3 (UMR 9217)
Sheelagh Carpendale†
University of Calgary
Jeremy Boy‡
United Nations Global Pulse
Jean Daniel Fekete§
INRIA, Universit ´e Paris Saclay,
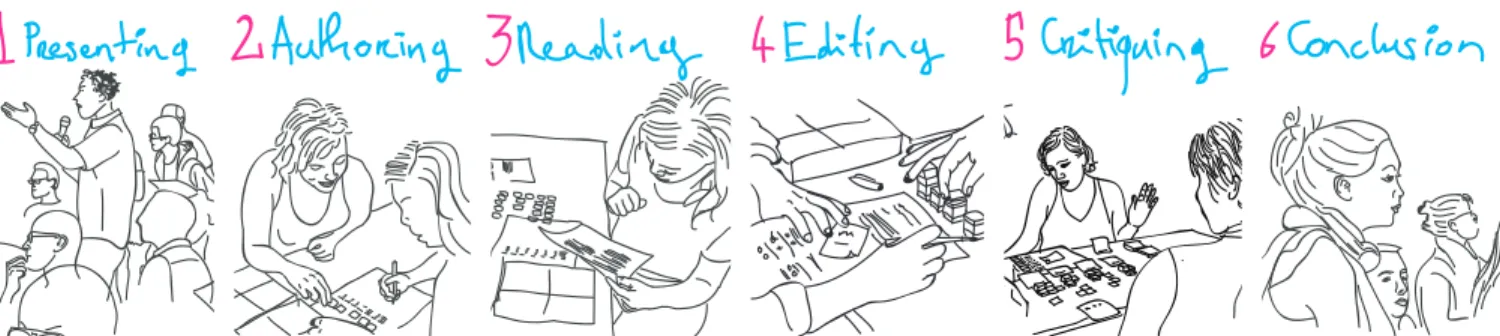
Figure 1: The procedure of VisKit: 1/ Participants are instructed by the workshop crew; 2/ Groups of participants encode data with tangible tiles; 3/ Participants fill a questionnaire to assess their visualization; 4/ Participants change their visualizations for communication purposes; 5/ Participants read, critique, and assess each other’s visualizations; and 6/ The workshop crew conclude the workshop with discussion.
ABSTRACT
We present VizKit and a set of instructions on how to use VisKit to run a constructive visualization workshop. This constructive vi-sualization workshop was designed to introduce the basics behind authoring and interpreting visual representations of abstract data to lay audiences. The goal of VisKit is to provide both the material and procedure for conducting constructive visualization workshops that can engage lay audiences in a pleasant collective exercise. Here, we provide instructions as a manual, with illustrations of each step, to provide a potential workshop organizer with details about how to setup and run a constructive visualization workshop.
1 INTRODUCTION
As one response to the continuing spread of infovis online [9], in newspapers [8], and on TV [6], we have been running workshops to teach infovis to the general public. An outcome of these workshops is VizKit, a toolkit designed for teaching infovis to a board spec-trum of people in a two hour workshop. In this paper we describe VizKit and the procedure we use during these public workshops. While running these workshops only reaches a few people each time, the people who attend have been enthusiastic and have, for instance, chosen to stay for the full length of the workshop rather than take part in a public fair. While it is well recognized that teach-ing infovis in a classroom settteach-ing is challengteach-ing [3, 7], if we want to democratize visualization to lay audiences it is also important to think about teaching outside classrooms [1, 2].
Both the toolkit, VizKit, and the procedure are based on con-structive visualization principles [4]. We used these principles
be-∗e-mail: [email protected] †e-mail:[email protected] ‡e-mail:[email protected] §e-mail:[email protected]
cause in theory they make learning more accessible [4], and when studied [5] it appears that this might be the case. Since our intention was to provide an inclusive, accessible, and reflexive experience for lay audiences, when designing our authoring tools, we focused on supporting dynamic and collaborative visualization authoring. We worked towards minimizing prerequisite skills; avoiding technolog-ical restrictions; bringing the cognitive processes to the fore; and leveraging peer learning — an approach in which people can learn from each other.
In this paper we describe the VizKit components and outline how we have been using VisKit to run two hour constructive visualiza-tion workshops. Our procedure was specially designed to provide a first experience of data mapping, including both authoring and interpreting phases (See Fig. 1).
2 THEVIZKITCOMPONENTS
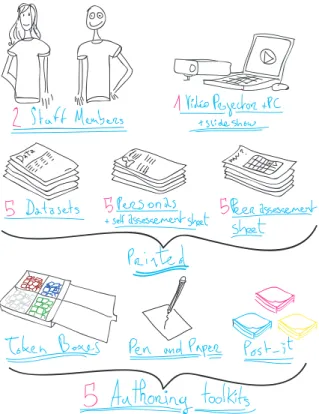
We designed this workshop for 15 people. We find that it works best if we can have a 2 person crew. While a projector and laptop are only used for a short period of time, it is definitely useful to have them. Then we have some prepared printed material and the physical authoring toolkits. Fig. 2 shows VizKit’s components.
2.1 Printed Material
Instructions. There are three types of instruction sheets: 1) five datasets to visualize; 2) five personas (fictional characters) that de-scribe the owners of each dataset and a set of questions about the features expressed in each dataset; and 3) a peer assessment grid to help people when they are reading the visualization.
Datasets. We selected a type data that most adults can understand – categorized bank expenses. The datasets present 5 categories over 4 months. The categories are: Entertainment, Bar and Restaurants, Groceries, Transportation, Travel, and Rent. Each value is rounded to a multiple of $25 to simplify calculations. The different trends and features in the data such as increases, decreases, outliers, voids, and/or stability have been carefully crafted to correspond to the ex-penses of individual personas. We have five unique datasets, where
Figure 2: The components needed for running the workshop.
each dataset has its own recognizable data features.
Persona Sheets and Self-Evaluation Questions. These sheets pro-vide a short story about each persona. The story explains the trends and/or features in the data and provides some cultural context, mak-ing it more likely that participants will “relate” to the data. Follow-ing the story is a set of questions (5 or 6 on average, each havFollow-ing two parts) about the different trends and/or features in the data. These questions ask participants whether they have identified a given fea-ture, and whether they have made this feature visible in their visu-alization (dichotomous answers, i. e., yes/no).
A Peer Assessment Grid. This is a table with questions as rows and participants as columns. The questions are the same as those in the self-evaluation sheet mentioned above. They relate to the same features for each dataset. The rationale behind the design of this sheet is to ease into a peer assessment activity in which participants try to read the visual representations created of other participants. Thus the participants engage in try to identify data features in visu-alizations authored by other the participants.
2.2 Authoring Toolkit
We chose to use tangible tiles similar to those used by Huron et al. [5] since it was noted with these tiles lay audiences readily au-thored visual representations, dynamically and expressively. There-fore the workshop author toolkit is based on tokens. It includes two boxes, A and B, that each contain four cases that hold different colored tiles (Fig. 2). Each case contains thirty-six plastic tokens— 25 ∗ 25 ∗ 5 millimeters in volume. Box A contains orange, purple, yellow, and black tokens; and box B contains red, green, blue, and white tokens (see Fig. 2). For instructors who wish to create their own toolkit, the 10 sets of boxes and tokens took three crew mem-bers and about two days of work using a laser cutter, glue, and hammer. We released the blueprint and documentation for the kit as open hardware1.
1https://github.com/INRIA/VizKit
3 SETTINGUP THEWORKSHOP
Figure 3: Setting up the workshop.
Ideally you will have a space large enough to hold 6 large tables at which groups of 3 people can be comfortably seated. Before starting the workshop, setup your 5 small group workspaces with a table and 3 chairs. Also set up the crews workspace on a separate table. We also recommend setting up one table per group. You can distribute one toolset by table, and one dataset by table. Keep the other instruction sheets to distribute at the right moments. Labelling each table with a group number is also useful. If possible use a circular layout for the tables, as this will simplify the circulation of people during the critiquing phase of the workshop (see Fig. 3).
4 RUNNING THEWORKSHOP
The workshop consists of six phases: 1) introduction, 2) authoring, 3) reading and in group peer-evaluation, 4) editing for communica-tion, 5) critiquing and cross group peer-evaluacommunica-tion, and 6) conclu-sion and wrap-up (see Fig. 1).
4.1 Phase 1: Introduction
Figure 4: Presenting: Explaining how the workshop will run.
This phase consists of a presentation preamble that introduces the components and procedure of the workshop (see Fig. 4). The partic-ipants are asked to form groups, taking seats around tables on which a dataset and the authoring kits have been placed. The datasets are described as bank statements belonging to an imaginary friend. We introduce the task to the participants by asking them to help their imaginary friend, who is having trouble with expenses. Note that the actual personas – that is the details of what the troubles are – are not introduced in this phase.
4.2 Phase 2: Authoring
Each of groups is given a dataset, Fig. 6, and invited to use the tiles to create a visualization to help the fictional friend to manage their expenses. To simplify the cognitive processing, we suggest that one tile correspond to a base unit of 25. The intent of this authoring phase is to allow people to actively think about how to transform data into a visual form through practice (see Fig. 5). The dataset, the authoring tool, and the task are kept simple to encourage the group to create a visual representation. This process often triggers questions in the group on what and how to represent the data.
Figure 6: Example of a given dataset.
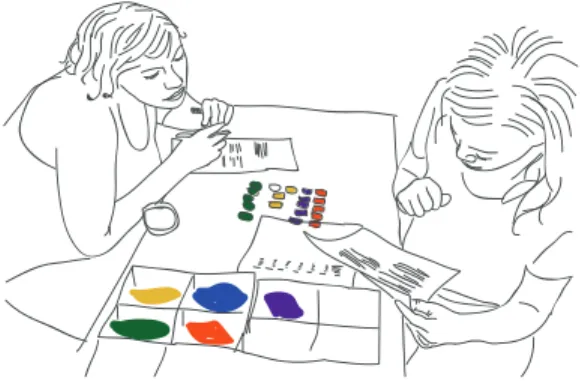
4.3 Phase 3: Reading and in Group Evaluation
Figure 7: Reading the visualizations the group has created.
In Phase 3, the persona sheets containing questions are handed out. Participants are asked to read it and reply to the questions. Partici-pants are asked to relate the data to the fictional character they are supposed to be helping out (Fig. 7). The self-evaluation questions are designed to help them understand the trends and/or features in the data, and allow them to establish which of these they have al-ready identified and represented in their visualization(s), and those they have not. The design rationale of this phase is to introduce a first external constraint: Does the visual mapping represent the main data features? The goal is to prompt people to take a reflexive moment about their authored visualization. To first re-read the vi-sual representation and the dataset at the light of the persona. Then to identify main data features in the dataset. Finally they discuss collaboratively whether or not they have represented these features in their visualization. Here is a sample persona.
The student is not originally from this city, but he has come here to study. Every year, he moves out of his apartment for the sum-mer break, and goes back home to where his parents live. There, he spends very little money on groceries, and a lot on recreation. At the beginning of the Fall term, he moves back to school, finds a new apartment, and pays a new deposit. He also needs to pay for his transport card, which will be sufficient for all commuting during the year. He starts buying groceries again, and spends less on recreation. Finally, he spends quite a lot of time going out, and spends a relatively large amount of his money there.
Here are the associated sample questions for this persona: 1. (a) Did you notice the drop in recreational expenses after
the beginning of the Fall term in September? (yes/no)
(b) Do you show this in your visualization? (yes/no) 2. (a) Did you notice the relatively high expenses for bars and
restaurant? (yes/no)
(b) Do you show this in your visualization? (yes/no) 3. (a) Did you notice the increase in grocery expenses and
its stabilization after the beginning of the Fall term in September? (yes/no)
(b) Do you show this in your visualization? (yes/no) 4. (a) Did you notice the high transport expenses at the
begin-ning of the Fall term in September? (yes/no) (b) Do you show this in your visualization? (yes/no) 5. (a) Did you notice the big bounce in housing expenses at
the beginning of the Fall term in September, and its later decrease and stabilization? (yes/no)
(b) Do you show this in your visualization? (yes/no)
4.4 Phase 4: Editing for Communication
Figure 8: Editing: adjusting the visualization so that data features can be read more easily.
In Phase 4, participants are asked to reconsider their visual repre-sentation(s) for purpose of communication, i. e., as a “stand-alone” piece that the persona should be able to understand without their as-sistance. They are also invited to edit their visual representation(s) in response to the information provided on the persona sheet and self-evaluation questions (Fig. 8). Note that for this phase, partici-pants are allowed to use other stationary equipment like pens, paper, and post-its. This phase introduces two other challenges: How to transform the visual representation, to make it readable for someone else? and How to correct the visual representation according to the persona sheet? The rationale behind this phase is to encourage par-ticipants to correct the visual representation, to reflect on the data features, and also to think about how to adjust their representation so that it will be more communicative.
4.5 Phase 5: Critiquing: Reading Each Other’s Visual-izations
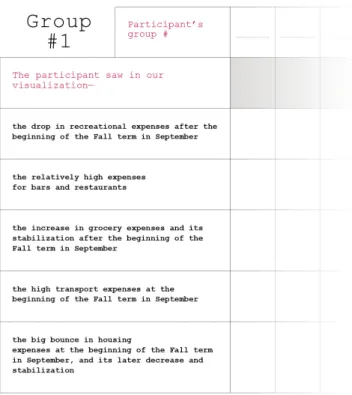
In Phase 5, the peer-evaluation sheet is handed out, and participants are asked to nominate an evaluator for their group, i. e., a group-member who stays seated next to the group’s visualization; and one (or more) visitor(s). The visitors are instructed to go from one table to the next to try to interpret the different visualizations that have been created (see Fig. 9). They are asked to orally describe the dif-ferent trends and/or features they can identify to the evaluator. The evaluators are instructed to keep track of the different trends and/or features listed in the peer-evaluation questionnaire that each visitor comes to identify, by checking the appropriate cell in the table (see Figure 10). Note that a evaluator is not allowed to discuss the visual
Figure 9: Critiquing: the person with the visitor role is trying to read the visualization of another group, while the person who is the evalua-tor is trying to detect if the visievalua-tor is discovering the encoded features.
encodings with a visitor from another group, until it is considered that the latter has identified all the insights shown by the visual-ization. Then they can spend some time explaining and critiquing the design and encoding choices that were made. In addition, par-ticipants are made aware of the dataset duplicates, i. e., that pairs of groups had actually been working with the same datasets. These duplicates are used to create a mini-challenge, in which participants are asked to identify which group worked on the same dataset they did. This helped participants to realize that there are a variety of en-coding possibilities, and therefore that there is space for creativity offered by visualization design, even when a base unit is fixed.
Figure 10: Example of a Peer assessement questionnaire for group1.
4.6 Phase 6: Conclusion
In Phase 6, all personas and datasets are presented to the different groups, the different trends and/or features in each dataset are de-scribed using previously designed visualizations, and dataset dupli-cates are revealed (Fig. 11). To finish, some common visualization
Figure 11: Conclusion: wrapping up the workshop with group discus-sion
types are presented (e. g., scatterplots, node-link diagrams, etc.,) to emphasize the array of possibilities.
5 CONCLUSION
We have presented VisKit complete with detailed instructions on how to use VisKit to run a constructive visualization workshop. These workshops were designed to engage non-experts in a first experience of mapping data to a visual representation in less than 2 hours. VisKit lets people experiment with authoring, reading, edit-ing, and critiquing a visualization. We have used VisKit in various environments and have received positive feedback. By presenting VizKit together with these instructions, which can be used as an in-struction manual, we hope to engage more people in both exploring spreading visual literacy among the general public and the potential of using constructive visualization for learning purposes.
ACKNOWLEDGEMENTS
We want to thank all the people who helped with the work of creat-ing VizKit, and designcreat-ing and runncreat-ing workshops: Mathieu Legoc, Romain Di Vozzo, Sylvia Frederikson. We also thank the people who invited us to different events: Charles Nepote, Sylvia Fred-erikson.
REFERENCES
[1] R. Bhargava and C. DIgnazio. Designing Tools and Activities for Data Literacy Learners. June, 2015.
[2] J. Duarte. Handmade visual, 2011. Last access: 2015-07-01. http: //www.handmadevisuals.com.
[3] M. A. Hearst, E. Adar, R. Kosara, T. Munzner, J. Schwabish, and B. Shneiderman. Vis, the next generation: Teaching across the researcher-practitioner gap (ieee vis panel).
[4] S. Huron, S. Carpendale, A. Thudt, A. Tang, and M. Mauerer. Construc-tive visualization. In Proceedings of the 2014 conference on Designing interactive systems, pages 433–442. ACM, 2014.
[5] S. Huron, Y. Jansen, and S. Carpendale. Constructing visual repre-sentations: Investigating the use of tangible tokens. Visualization and Computer Graphics, IEEE Transactions on, 20(12):2102–2111, 2014. [6] S. Huron, R. Vuillemot, and J.-D. Fekete. Bubble-TV: Live Visual
Feedback for Social TV Broadcast. In ACM CHI 2013 Workshop : Ex-ploring and enhancing the user experience for television, Paris, France, Apr. 2013. 4 pages.
[7] A. Kerren, J. T. Stasko, and J. Dykes. Teaching information visualiza-tion. In Information visualization, pages 65–91. Springer, 2008. [8] E. Segel and J. Heer. Narrative visualization: Telling stories with
data. IEEE transactions on visualization and computer graphics, 16(6):1139–1148, 2010.
[9] F. B. Viegas, M. Wattenberg, F. Van Ham, J. Kriss, and M. McKeon. Manyeyes: a site for visualization at internet scale. IEEE transactions on visualization and computer graphics, 13(6):1121–1128, 2007.