OATAO is an open access repository that collects the work of Toulouse
researchers and makes it freely available over the web where possible
Any correspondence concerning this service should be sent
to the repository administrator:
[email protected]
This is an author’s version published in: http://oatao.univ-toulouse.fr/21873
To cite this version:
Miguez, Jose Manuel and Miqueu, Christelle and Mendiboure, Bruno and Torré,
Jean-Philippe
and Blas, Felipe and Pinero, Manuel and Conde, Maria Martin and Vega,
Carlos Molecular dynamics and thermodynamical modelling using SAFT-VR to predict
hydrate phase equilibria : application to CO2 hydrates. (2014) In: 8th International
Conference on Gas Hydrates (ICGH8), 28 July 2014 - 1 August 2014 (Beijing, China).
MOLECULAR DYNAMICS AND THERMODYNAMICAL MODELLING
USING SAFT-VR TO PREDICT HYDRATE PHASE EQUILIBRIA:
APPLICATION TO CO
2HYDRATES
Jose Manuel MIGUEZ∗∗∗∗, Christelle MIQUEU, Bruno MENDIBOURE, Jean-Philippe TORRÉ
Laboratoire de Fluides Complexes et leurs Réservoirs (LFC-R), Université de Pau et des Pays de l’Adour, Avenue de l'Université, BP 1155, PAU 64013, France
Felipe J. BLAS
Departamento de Física Aplicada, Universidad de Huelva, 21071, Huelva, SPAIN Manuel M. PINEIRO
Departamento de Física Aplicada, Facultade de Ciencias, Universidade de Vigo, 36310 Vigo, SPAIN
Maria M. Conde and Carlos VEGA
Departamento de Química Física, Facultad de Ciencias Químicas,Universidad Complutense de Madrid, Madrid 28040, SPAIN
ABSTRACT
This work was dedicated to the prediction of the three phase coexistence line (CO2 hydrate–liquid H2
O-liquid/vapour CO2) for the H2O+CO2 binary mixture by using (i) molecular dynamics simulations, and (ii)
the well known van der Waals-Platteeuw (vdWP) model combined with the SAFT-VR equation of state. Molecular dynamics simulations have been performed using the simulation package GROMACS. The temperature at which the three phases are in equilibrium was determined for different pressures, by using direct coexistence simulations. Carbon dioxide was modelled as a linear-rigid chain molecule with three chemical units, the well-known version TraPPE molecular model. The TIP4P/Ice model was used for water. To perform the thermodynamical modelling, the SAFT-VR EOS was incorporated in the vdWP framework. The values of the cell model parameters were regressed and discussed together with the influence of some assumptions of the vdWP model. Since SAFT-VR can describe most of fluids involved in hydrate modelling (inhibitors, salts…), this study is a first step in the description of hydrate forming conditions of more complex systems. Finally, the three-phase coexistence temperatures obtained with both simulations and theory at different pressures were compared with experimental results.
Keywords: gas hydrates, water, carbon dioxide, molecular dynamics, van der Waals-Platteeuw,
SAFT.
∗ Corresponding author: Phone: +33 614113232 Fax +33559407695 E-mail: [email protected]
NOMENCLATURE
θL: Occupancy of large cages θS: Occupancy of small cages
MD: Molecular dynamic simulation
NPT: Isothermal-Isobaric ensemble
ε, σ: Lennard-Jones potential well depth and size
q: Partial electric charges
SL-L: Liquid H2O-liquid CO2 equilibrium state
SH-L: Hydrate-liquid CO2 equilibrium state
Proceedings of the 8th International Conference on Gas Hydrates (ICGH8-2014), Beijing, China, 28 July - 1 August, 2014
T3: Three phase coexistence temperature
(hydrate-liquid H2O-liquid CO2)
µ
w H: chemical potential of water in the hydrate phase
µ
w Lw: chemical potential of water in the liquid water phase
µ
w β: chemical potential of water in the empty hydrate phase
νi : number of i-type cavities per water molecule
θJi : fractional occupancy of i-type cavities with
J-type guest molecules kB : Boltzmann constant
∆
µ
w: water chemical potential difference betweenthe liquid water phase and the empty hydrate phase
∆
H
w : water enthalpy difference between the liquid water phase and the empty hydrate phase∆
v
w: water volume difference between the liquid water phase and the empty hydrate phase∆
c
p : water molar heat capacity difference between the liquid water phase and the empty hydrate phasexw : mole fraction of water in the water phase
INTRODUCTION
Molecular simulation of hydrates and
thermodynamic modelling are of great importance for both fundamental research and hydrate-based applications. Developing novel approaches to study hydrate phase equilibria is thus very interesting and challenging. In some practical applications, such as the use of hydrates in gas separation processes and/or for refrigeration [1], some technological options are based on the formation/dissociation of carbon dioxide hydrates.
MOLECULAR MODELS AND SIMULATION DETAILS
CO2 hydrate adopts the sI structure. It is simple
cubic and has the space group Pm3n. The unit cell consists of 46 water molecules and it contains eight water cages (six tetradecahedra 51262 and two
dodecahedra 512). On one hand, oxygen
coordinates were generated from the
cristallographic parameters provided in Yousuf et al. [1]. On the other hand, hydrates present proton disorder. Hydrogens were placed using the algorithm proposed by Buch et al. [2] to generate
solid configurations satisfying the Bernal–Fowler rules[3]and with zero dipole moment.
For our study, the hydrate configuration was obtained replicating this unit cell two times in each dimension (a total of 368 water molecules forming 64 cavities). In the case of CO2 hydrates, most
experimental estimation of the occupancy range vary from 80% to 100% [4-7]. In this work, we have chosen to start the simulations with a cage occupancy of 87.5 %, corresponding to all the larges cages and half of the small ones occupied by CO2 (see Table 1).
Notation Occupancy(%) θL θS
87%S 87.5 1 0.5
Table 1: Cage occupancy for the initial hydrate structure (θL Occupancy of Large Cages; θS:
Occupancy of Small Cages)
Note that the filling of the small cages was done randomly.
To generate the initial configuration we followed the methodology proposed by Fernandez et al.[8]: obtaining an initial configuration formed by a slab of liquid H2O surrounded at one side by a slab of
the CO2 hydrate and at the other site by a slab of
CO2 molecules in the liquid phase. This technique
was used by M.M. Conde and C. Vega [9,10] to predict the three-phase coexistence line in CH4
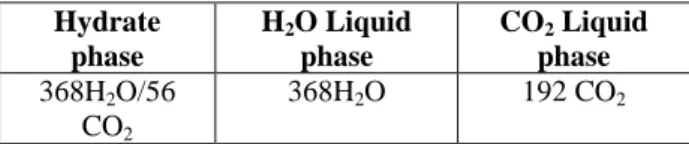
hydrates. The details about the composition of the phases are given in Table 2.
Hydrate phase H2O Liquid phase CO2 Liquid phase 368H2O/56 CO2 368H2O 192 CO2
Table 2: Number of molecules situated in the different phases for the system studied in this
work.
The typical size of the simulation box for the initial configuration was 80x24x24 Å3. The interfaces between the three phases are perpendicular to the x axis. Periodic boundary conditions were employed in the three directions of space. The initial arrangements allow us having each phase in contact with the other two.
We have performed NPT molecular dynamic simulations at different temperatures and pressures at 60, 100, 200, 400, 1000 and 3000 bar using the molecular dynamics package GROMACS (version 4.6.1) [11]. The temperature was fixed using a Nosé–Hoover thermostat [12,13]with a relaxation time of 2 ps. To keep the pressure constant, a Parrinello–Rahman barostat [14,15]was used. The relaxation time of the barostat was 2 ps. The time-step used in the simulations was 2 fs. The typical length of the simulations was 400ns. The Lennard-Jones part of the potential was truncated at 9 Å. Ewald sums were used to deal with electrostatic interactions. The real part of the Coulombic potential was truncated at 9 Å. The Fourier part of the Ewald sums was evaluated by using the PME method [16]. The width of the mesh was 1 Å and we used a fourth order polynomial to evaluate Coulombic interactions.
The water was modelled, following the well-known TIP4P[17] molecular model geometry: four interacting centres, with the oxygen atom O as the only LJ interaction site, a partial charge (M-site) located along the H-O-H angle bisector, and two hydrogen atoms H, which are represented by partial point electric charges. M.M. Conde and C. Vega [9,10] showed that the combination of TIP4P/Ice [18] model for water and a single LJ centre for methane reproduces nicely the three phase coexisting line (hydrate-H2O-CH4) in
methane hydrates. Therefore, we have chosen the TIP4P/Ice molecular model for water in this work. In the case of carbon dioxide, the most usual model is a linear-rigid chain molecule with three chemical units, representing each of the C and O atoms, and each unit or interacting site consists of a combination of a LJ site plus an electric point charge. Among the available parameterizations for this molecular structure, the TraPPE (transferable potentials for phase equilibria) [19] model was tested. This model has been shown to provide accurate estimation of interfacial properties of CO2, as shown by Miguez et al. [20]. Table 3
summarizes the characteristic parameters for all the molecular models studied in this work.
Atom ε/κ(K) σ/Å q(e) Geometry
TIP4P/Ice H2O O 106.1 3.1668 0.0 O-H: 0.9572Å H 0.0 0.0 0.5897 O-M: 0.1577 M 0.0 0.0 -1.1794 H-O-H:104.5º TraPPE CO2 C 27.0 2.80 0.70 C-O:1.16Å O 79.0 3.05 -0.35 O-C-O:180º
Table 3: Lennard-Jones potential well depth ε and size σ, partial charges q, and geometry, of the H2O
and CO2 models used.
All of these models used in this work are rigid and non polarizable.
Following the ensuing discussion, the
intermolecular potential between molecules i and j was computed by the following equation where the Lennard-Jones and Columbic interactions are considered as the main contributors:
( )
ij o j i j i ij ij ij ij ij ij ij r q q r r r V πε σ σ ε 4 4 6 12 + − =∑
≠ (1)The H2O-CO2 interaction is described using a LJ
potential with the cross interaction parameters given by the Lorentz–Berthelot rules [21]:
ε
CH4−H2O=
ε
CH4−CH4⋅ε
H2O−H2O (2)(
)
2 2 2 4 4 2 4 O H O H CH CH O H CH − − − + =σ
σ
σ
(3) THERMODYNAMIC MODELLINGThe well-known van der Waals-Platteeuw (vdWP) theory [22] was used to compute the hydrate formation conditions. The basic assumption of the vdWP model is the balance of the chemical potential of water in all phases at equilibrium:
µ
w H−
µ
w β=
µ
w Lw−
µ
w β (4)where the superscript β denotes an hypothetical empty hydrate lattice. Similarly to the Langmuir
adsorption theory and following several
assumptions (see [22] for more details), van der Waals and Platteeuw derived the following expression for the chemical potential difference of water between the empty and actual hydrate phase:
µw H−µ w β kBT = νi i
∑
ln 1− ΘJi J∑
(5)where νi is the number of i-type cavities per water molecule and θJi is the fractional occupancy of
i-type cavities with J-i-type guest molecules. θJi is described by ΘJi= CJ i fJ 1+ CK i fK K
∑
(6)where fJ is the fugacity of gas component J and is calculated in this work with the SAFT-VR equation of state [23]. Van der Waals and Platteeuw used the Lennard-Jones-Devonshire cell theory to estimate the Langmuir constants CJi and
proposed CJi= 4π kT 0exp R
∫
−ω( )r kT r2dr (7)where ω(r) is a spherically symmetric potential, r being the radial distance from the center of the cavity. In this work, we have used the Kihara cell potential derived by Parrish and Prausnitz [24] for the interaction between guest and host molecules. The chemical potential difference between liquid water and water in the empty lattice are calculated from the equations given by Holder et al. [25]
(
)
∫
∫
− ∆ + ∆ − ∆ = − P w w w T T w P T w w w Lw x dP RT v dT RT H RT RT 0 2 , ln 0 0 0 γ µ µ µ β (8)Here, the activity coefficient of water γw was taken equal to 1 due to the negligible deviation from ideality obtained by dissolution of CO2 in water
[26,27]. The other thermodynamic properties were computed with the SAFT-VR equation of state. Moreover, the enthalpy difference was taken temperature dependent via
∆Hw=∆Hw0+ ∆c p 0 + b T−T 0
(
)
T0 T∫
dT (9)The parameters for CO2 and water in the
SAFT-VR framework were taken from dos Ramos et al. [28] together with the interaction parameter that dos Ramos et al. had fitted to predict the phase behavior of the water + CO2 binary mixture.
The thermodynamic reference properties used in this work are given in Table 4.
Reference ∆vw (m3/mol) 4.5959 [29]
∆
c
p 0 (J/mol.K) -38.12 [29] b (J/mol.K2) 0.141 [29]∆µ
w 0 (J/mol) 1287 [30]∆
h
w0 (J/mol) -5080 [30]Table 4: thermodynamic reference properties for structure I.
Hence, by solving Eq. (4) and specifying either pressure or temperature, one can determine the equilibrium conditions of hydrates.
RESULTS
The main goal of this work is to estimate the three-phase (hydrate-H2O-CO2) coexistence line in CO2
hydrates by molecular simulations and the vdWP/SAFT-VR modelling.
In molecular dynamics simulations, the energy of the system fluctuates in NPT simulations. Systematic changes in the energy are associated with phase transitions. At high temperatures the region formed by hydrate will melt, resulting in a system with two phases (liquid H2O and CO2)
when reaching the equilibrium state denoted as S L-L (see Figure 1). However, at low temperatures the liquid water will crystallize forming a system with other two phases (hydrate-liquid CO2) when
reaching the equilibrium state denoted as SH-L (see Figure 1). At a certain temperature, the three phases will be in equilibrium. This temperature will be denoted as T3.
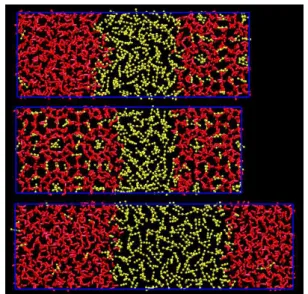
Figure 1. Snapshots for three-phase system (hydrate-liquid H2O-liquid CO2) at 400 bar. The
initial configuration is shown on the top, whereas the final configuration at 265K is shown in the middle( SH-L), and the final configuration at 275K
is shown at the bottom(SL-L). H2O molecules are
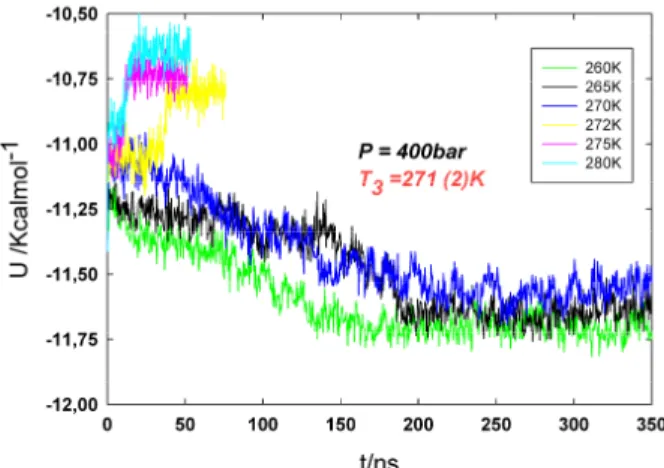
We shall start by presenting the results obtained at 400 bar. The time evolution of the potential energy for the system at this pressure is shown in Figure 2. In the initial configuration we have a three-phase system composed by hydrate, liquid water and CO2
liquid (see Figure 1). For all temperatures, we have used the same initial configuration.
Figure 2. Evolution of the potential energy as a function of time for the NPT runs for three-phase
system (hydrate-liquid H2O-liquid CO2) at 400
bar. Results only for a few representative temperatures are shown.
For temperatures above T3 the potential energy
increases with time, indicating the melting of the CO2 hydrate. This is the case for the temperatures
from 272 to 285 K, which are plotted in Figure 2. The plateau that is visible for these temperatures corresponds to a liquid equilibrium state (i.e. liquid H2O-liquid CO2)
For temperatures below T3 the potential energy
decreases very slowly with time until liquid H2O
freezes completely in the subsequent 200 ns. CO2
hydrate phase grows very slowly layer by layer. The fast growth of the CO2 hydrate manifested by
the presence of CO2 bubbles is not observed in our
simulations [31]. This is the case for the temperatures from 260 to 270 K. The final plateau of these runs indicates the complete formation of the CO2 hydrate in coexistence with liquid CO2 at
the new equilibrium state.
In summary, the CO2 hydrate melts at 400 bar for
temperatures above 272 K, and the system crystallise for temperatures below 270 K. We will estimate T3 as the arithmetic average of the highest
temperature at which the CO2 hydrate forms and
the lowest temperature at which the hydrate dissociates. According to this criterion, the three phase coexistence temperature for the TIP4P/Ice model of water and the TraPPE model of carbon dioxide is T3 = 271 K at 400 bar. Finally, this
methodology was applied to predict T3 at 60, 100, 200, 1000 and 3000 bar.
Concerning the thermodynamic modelling, the Kihara parameters used for CO2 are given in Table
5. These parameters are generally obtained by fitting experimental data, mainly the hydrate dissociation conditions. Hence, their values depend on both the equation of state that have been used in the vdWP model and on the set of thermodynamic reference properties that have been selected. Here, the optimization was restricted to the energy interaction parameter ε and the collision diameter σ. Indeed, the radius of the spherical molecular core a can be considered as a geometric parameter and thus its value should be considered as model independent. Solely the vapor CO2/liquid water/hydrate equilibrium conditions
were used for the fitting.
Reference
a (Å) 0.6805 [29]
σ (Å) 3.1 this work
ε/kB (K) 165.1 this work
Table 5: Kihara potential parameters for CO2.
In Table 6 the values of T3 obtained from simulations at the considered pressures are presented and compared with the vdWP/SAFT-VR estimations and experimental data [32-36].
P/bar T3MD/K T3(vdWP/SAFT-VR)/K T3Exp/K
3000 278(3) 300.04 293.8 1000 273(3) 289.24 289.6 400 271(3) 285.75 286.3 200 267(3) 284.48 284.8 100 267(3) 283.77 283.6 60 267(3) 283.47 283.2
Table 6: Three-phase coexistence temperatures (T3) at different pressures obtained from
simulations and the vdWP/SAFT-VR modelling.
The estimated error in T3 is shown within the
parentheses. The experimental values are taken from Ref. [32-36].
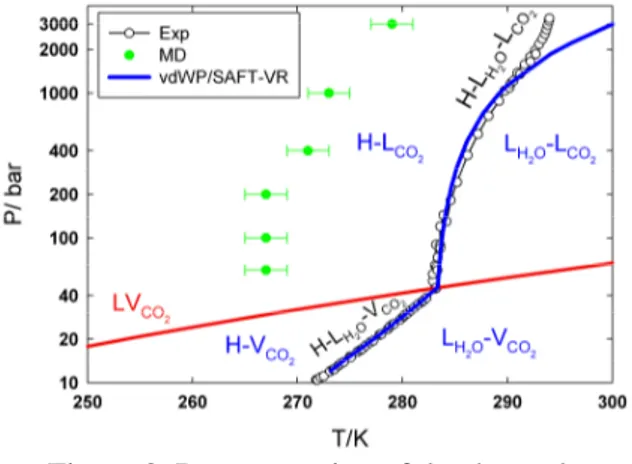
Figure 3. Representation of the three-phase coexistence temperature T3 as a function of
pressure.
Results showed a deviation of 15K between the three-phase coexistence line obtained by molecular simulations and the experimental one. This deviation is likely to be an incorrect modeling of the H2O-CO2 cross interaction. Indeed, in the case
of CH4 hydrate, by introducing positive deviations
from the energetic Lorentz–Berthelot combination rule, the disagreement with experiment was reduced about 15 K [9]. In a future work, an interesting issue would be to show how T3 varies
by increasing the strength of the H2O-CO2
interaction while keeping constant water-water and CO2−CO2 interactions.
The vdWP/SAFT-VR predictions are in good agreement with the experimental data except at P > 1000 bar. Indeed, in this work, we have not considered the pressure dependence of both the volume of liquid water and the volume of the empty hydrate phase, which can not be the case at such high pressures.
Results are plotted in Figure 3.
CONCLUSIONS
In this work, we have estimated the three-phase (hydrate-water-CO2) coexistence temperature T3 at
different pressures by dynamic molecular simulation and vdWP/SAFT-VR modellingOn the one hand, molecular simulation results showed that the three-phase coexistence line obtained with the combination of TIP4P/Ice model for H2O and
TraPPE for CO2 is shifted of 15K from the
experimental equilibrium curve. However, the general shape of the equilibrium curve is well
predicted. The introduction of positive deviations from Lorentz–Berthelot combination rule in this case should appear as an adequate choice for the study of CO2 hydrates by dynamic molecular
simulations. On the other hand, the vdWP/SAFT-VR modelling has allowed a good estimation of the dissociation conditions of the CO2 hydrate,
except at very high pressure because
compressibility effects have not been taken into consideration in the present study.
ACKNOWLEDGMENTS
The authors acknowledge MCIA (AVAKAS cluster of the Bordeaux University) for providing access to computing facilities. J.M.M.D. would like to thank Fundacion Pedro Barrie de la Maza in Spain for the post-doctoral financial support.
REFERENCES
[1] Yousuf M, Qadri S. B., Knies D. L., Grabowski D. L., Coffin R. B., Pohlman J. W. ovel Results on structural investigations of natural
minerals of clathrate hydrates. Appl. Phys. A:
Mater. Sci. Process. 2004; 78: 925-939.
[2] Buch V., Sandler P., Sadlej J. Simulations of
H2O solid, liquid and clusters, with an emphasis
on ferroelectric ordering transition in hexagonal ice. J. Phys. Chem. B 1998; 102: 8641-8653.
[3] Bernal J. D., Fowler R. H. A theory of water
and ionic solution, with particular reference to hydrogen and hydroxyl ions. J. Chem. Phys. 1933;
1: 515.
[4] Uchida T. Physical property measurements on
CO2 clathrate hydrates. Review of
crystallography, hydration number, and mechanical properties. Waste Manage. 1997; 17:
343-352.
[5] Sun R., Duan Z. Prediction of CH4 and CO2
hydrate phase equilibrium and cage occupancy from ab initio intermolecular potentials. Geochim.
Cosmochim. Acta 2005; 69: 4411–4424.
[6] Circone S., Stern L. A., Kirby S. H., Durham W. B., Chakoumakos B. C., Rawn C. J., Rondinone A. J., Ishii Y. CO2 hydrate: Synthesis,
composition, structure, dissociation behavior, and a comparison to structure I CH4 hydrate.J. Phys.
Chem. B 2003, 107: 5529–5539.
[7] Velaga S., Anderson B. Carbon Dioxide
Hydrates Phase Equilibrium and Cage Occupancy Calculations Using Ab Initio Intermolecular Potentials. J. Phys. Chem. B 2014; 118: 577–589.
[8] Fernandez R. G., Abascal J. L. F., Vega C. The
melting point of ice Ih for common water models calculated from direct coexistence of the solid-liquid interface J. Chem. Phys. 2006; 124: 144506.
[9] Conde MM, Vega C. Determining the three
phase coexistence line in methane hydrates using computer simulations J. Chem. Phys. 2010, 133:
064507.
[10] Conde MM, Vega C. A simple correlation to
locate the three phase coexistence line in methane hydrate simulations J. Chem. Phys. 2013; 138:
056101.
[11] Van Der Spoel D., Lindahl E., Hess B., Groenhof G., Mark A. E., Berendsen H. J. C.
GROMACS: fast, flexible and free. J. Comput.
Chem. 2005; 26: 1701-1718.
[12] Nosé S. A unified formulation of the constant
temperature molecular-dynamics methods. J.
Chem. Phys. 1984; 81: 511.
[13] Hoover W. G. Canonical Dynamics:
Equilibrium phase-space distributions. Phys. Rev.
A 1985; 31: 1695-1697.
[14] Parrinello M., Rahman A. Polymorphic
transitions in single-crystals: A new molecular-dynamics method. J. Appl. Phys. 1981; 52:
7182-7190.
[15] Nosé S., Klein M. L. Constant pressure
molecular dynamics for molecular systems. Mol.
Phys. 1983; 50: 1055-1076.
[16] Essmann U., Perera L., Berkowitz M. L., Darden T., Lee H., Pedersen L. G. A Smooth
Particle Mesh Ewald Method J. Chem. Phys.
1995; 103: 8577.
[17] Jorgensen W. L., Chandrasekhar J., Madura J., Impey R. W., Klein M. Comparison of Simple
Potential Functions for Simulating Liquid Water.J.
Chem. Phys. 1983; 79: 926.
[18] Abascal J. L. F., Sanz E., Fernandez R. G., Vega. C. A potential model for the study of ices
and amorphous water: TIP4P/Ice J. Chem. Phys.
2005; 122: 234511.
[19] Potoff J. J., Siepmann J. I. Vapor-Liquid
Equilibria of Mixtures Containing Alkanes, Carbon Dioxide and Nitrogen, AIChE J. 2001; 47:
1676-1682.
[20] Miguez J. M., Pineiro M. M., Blas F. J.
Influence of the long-range corrections on the interfacial properties of molecular models using Monte Carlo simulation. J. Chem. Phys. 2013;
138: 034707.
[21] Rowlinson J. S., Swinton F. L. Liquids and
Liquid Mixtures London: Butterworths, 1982.
[22] van der Waals J.H., Platteeuw J.C. Clathrate
Solutions, Adv. Chem. Phys. 1959 ; 2 : 1-57.
[23] Gil-Villegas A., Galindo A., Whitehead P. J., Mills S. J., Jackson G. Statistical Associating
Fluid Theory for Chain Molecules with Attractive Potentials of Variable Range. J. Chem. Phys.
1997; 106: 4168-4186.
[24] Parrish W. R., Prausnitz J. M. Dissociation
pressures of gas hydrates formed by gas mixtures.
Ind. Eng. Chem. Process Des. Develop. 1972; 11(1): 26–35.
[25] Holder G.D., Gorbin G., Papadopoulos K.D.
Thermodynamic and Molecular Properties of Gas Hydrates from Mixtures Containing Methane, Argon, and Krypton, Ind. Eng. Chem. Fundam.
1980; 19: 282– 286.
[26] King M. B., Mubarak A., Kim J. D., Bott T. R. The mutual solubilities of water with
supercritical and liquid carbon dioxide. J. Superc.
Fluids 1992; 5: 296-302.
[27] Valtz A., Chapoy A., Coquelet C., Paricaud P., Richon D. Vapour–liquid equilibria in the
carbon dioxide–water system, measurement and modelling from 278.2 to 318.2K. Fluid Phase
Equilib. 2004; 226: 333–344.
[28] dos Ramos M. C., Blas F. J., Galindo A.
Phase Equilibria, Excess Properties, and Henry’s Constants of the Water + Carbon Dioxide Binary Mixture. J. Phys. Chem. C 2007; 111(43): 15924–
15934.
[29] Sloan E. D., Koh C. A. Clathrate Hydrates of
Natural Gases, Colorado:CRC Press 2008.
[30] Handa Y. P., Tse J. S. Thermodynamic
properties of empty lattices of structure I and structure II clathrate hydrates. J. Phys. Chem.
1986; 90(22): 5917–5921.
[31] Jacobson L.C. Molinero V. A Methane-Water
Model for Coarse-Grained Simulations of Solutions and Clathrate Hydrates J. Phys. Chem.
B 2010; 114: 7302-7311.
[32] Larson S.D. Phase Studies of the
Two-Component Carbon Dioxide-Water System, Involving the Carbon Dioxide Hydrate, University
of Illinois, Urbana IL, 1955.
[33] Ng H. J., Robinson D. B. Hydrate formation
in systems containing methane, ethane, propane, carbon dioxide or hydrogen sulfide in the presence of methanol. Fluid Phase Equilib. 1985; 21:
145-155.
[34] Ohgaki K., Makihara Y., Takano K.
Formation of CO2 hydrate in pure and sea waters.
[35] Takenouchi S., Kennedy G. C. Dissociation
pressures of the phase CO2·5 ¾ H2O. J. Geol. 1965; 73: 383-390.
[36] Nakano S., Moritoki M., Ohgaki K.
High-pressure Phase Equilibrium and Raman Microprobe Spectroscopic Studies on the CO2
Hydrate System. J. Chem. Eng. Data 1998; 43: