ةيبعشلا ةيطارقميدلا ةيرئازجلا ةيروهمجلا
République Algérienne Démocratique et Populaire
Ministère de L'Enseignement Supérieur et de la Recherche Scientifique
UNIVERSITÉ FERHAT ABBAS - SETIF 1
FACULTÉ DE TECHNOLOGIE
THESE
Présentée au Département d’Electrotechnique
Pour l’obtention du diplôme de
DOCTORAT EN SCIENCES
Option: Commande Electrique
Par
GASSAB Samir
ME
È
TH
Gestion d’énergie d’une centrale à énergie renouvelable
hybride dédiée à l’alimentation d’un site isolé
Soutenue le 20/07/2019 devant le Jury:
MOSTEFAI Mohammed Prof Univ. Ferhat ABBAS Sétif 1 Président RADJEAI Hammoud Prof Univ. Ferhat ABBAS Sétif 1 Directeur MEKHILEF Saad Prof Univ. Malaya , MALAYSIA Co-Directeur RAHMANI Lazhar Prof Univ. Ferhat ABBAS Sétif 1 Examinateur BOUKHETALA Djamel Prof ENP d’Alger Examinateur GROUNI Saïd Prof Univ Mohamed Bougara - Boumerdes Examinateur
MINISTRY OF HIGHER EDUCATION AND
SCIENTIFIC RESEARCH
UNIVERSITY OF FARHAT ABBAS – SETIF (UFAS-1), ALGERIA.
Thesis
Presented in the Faculty of Technology
Electrical Engineering Department
For the Graduation of
DOCTORAT in SCIENCES
Option: Electric Control
By
Mr.: Samir GASSAB
Title
Contribution to Energy Management of Hybrid
Renewable Energy System for Isolated Areas
MOSTEFAI Mohammed Prof Univ. Ferhat ABBAS Setif 1 President
RADJEAI Hammoud Prof Univ. Ferhat ABBAS Setif 1 Supervisor
MEKHILEF Saad Prof Univ. Malaya , Malaysia Co-supervisor
RAHMANI Lazhar Prof Univ. Ferhat ABBAS Setif 1 Examiner
BOUKHETALLA Djamel Prof National Polytechnic School Algiers Examiner
ACKNOWLEDGMENTS
I would like to take this opportunity to express my thanks to everyone who contributed to this work. My sincere thanks go to my supervisors, Pr. Hammoud RADJEAI (Pr: University Ferhat Abbas, Setif) and Pr. Saad MEKHILEF (Pr: University of Malaya, Malaysia), for their confidence in me throughout this project and for their valuable guidance, discussions and insightful comments during the study.
I would also like to thank my brother Dr. Adel CHOUDAR (Dr: University of BBA), for his moral support, his precious help and his very enjoyable scientific discussions.
For their participation in the scientific evaluation of this work, I would also like to thank members of the jury: Professor MOSTEFAI Mohamed, Professor RAHMANI Lazhar, Professor
RADJEAI Hammoud (UFAS), Professor BOUKHETALA Djamel (ENP), and Professor GROUNI Said (UMB).
Finally, I am infinitely grateful to all my families for their moral support, to my parents for their continuous encouragement.
DEDICATIONS
To all my family……
To all my friends……
List of Figures
Chapter I : Overview on Renewable Energy Based Active Generators.
Fig 1.1. Categories of renewable energy sources. 7
Fig 1.2. World electricity generation from the solar PV source during the two last decades. 8 Fig 1.3. Elementary structure of a Grid connected Active PV Generator (APG). 9 Fig 1.4.Energy and power density of different storage technologies Source. 11
Fig 1.5.Centralized and distributed PV generation in SAAPG. 14
Fig 1.6. Hierarchical structure of microgrid power management. 16
Fig 1.7. Frequency/active power and voltage/reactive power droop characteristics. 18
Chapter II : Modeling and Sizing of Electrical System Parameters.
Fig 2.1. Diagram block of the proposed SAAPG system. 20
Fig 2.2. Single diode PV cell Model. 21
Fig 2.3. P-V and I-V curves of the used PV field for a variety of irradiation. 25 Fig 2.4. Equivalent electrical circuit of the CIEMAT battery model. 26
Fig 2.5. Working areas of a lead acid battery. 27
Fig 2.6. Basic model of Ultra-capacitor. 28
Fig.2.7. Closed loop control of the DG speed. 31
Fig 2.8. Fixed speed operation of the DG. 32
Fig 2.9. Topology of the DC-DC Buck & Boost converter. 33
Fig 2.10. Buck converter circuit. 33
Fig 2.11 Steady state inductor current for CCM. 34
Fig 2.12. Steady state capacitor voltage for CCM. 36
Fig 2.13 DC-AC Three phase PWM converter with LC output filter. 37
Chapter III : Control of DC-DC Power Converters.
Fig 3.1. Ideal equivalent circuits for Buck converter. 40
Fig 3.3. Ideal equivalent circuits for Boost converter. 44 Fig 3.4. Duty cycle profile used to validate the averaged signal model of the buck. 46 Fig 3.5. Average model (red) and instantaneous model (blue) of
I
L (buck converter). 46Fig 3.6. Average model (red) and instantaneous model (blue) of
V
C (buck converter). 46Fig 3.7. Duty cycle profile used to validate the averaged signal model of the boost. 47
Fig 3.8. Average model (red) and instantaneous model (blue) of IL (boost converter). 47
Fig 3.9. Average model (red) and instantaneous model (blue) of VC (boost converter) 47 Fig 3.10. Linearization of a function around an operating point. 49 Fig 3.11. Simulation results of output voltage control of the buck converter. 52 Fig 3.12. Simulation results of output voltage control of the boost converter. 53
Chapter IV : Power Management and Coordinated Control of the SAAPG.
Fig 4.1 Structure of the Studied SAAPG. 56
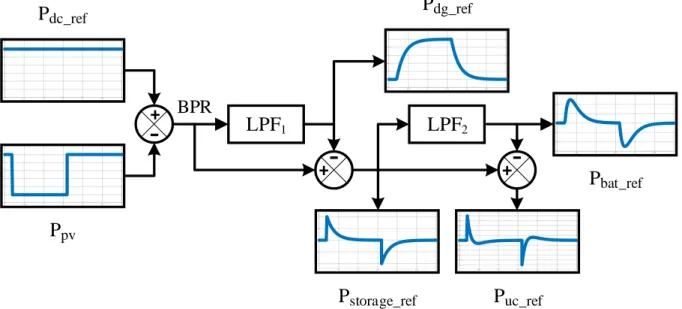
Fig 4.2. Distribution of power references according to source dynamics. 57 Fig 4.3.Hierarchical Management and Control Structure strategy of the SAAPG. 59
Fig 4.4.Power sharing and management flowchart of the SAAPG. 60
Fig 4.5.Flowchart of the UC Balancing Level. 61
Fig 4.6. DC-DC power converters and their Automatic Control Laws. 63
Fig 4.7.Automatic control of the three-phase DC-AC PWM converter. 64
Fig 4.8. Irradiation profile used throughout the simulation. 65
Fig 4.9. instantaneous powers including : PV, Battery, UC and DG. 67
Fig 4.10. State of charge of storage elements. 67
Fig 4.11. Balance power of the ultra-capacitor active and DC link voltage. 67
Fig 4.12. Active and reactive power of the SAAPG. 67
List of Tables
Chapter I : Overview on Renewable Energy Based Active Generators.
Tab 1.1. Some works which combine DG and ESS in SAAPG. 13
Chapter II : Modeling and Sizing of Electrical System Parameters.
Tab 2.1. PV panel essential data. 23
Tab 2.2. PV panel parameters used in simulation (ASMS-180M) 24
Tab 2.3. Simulation parameters of the used PV field. 24
Tab 2.4. The used simulation parameters of UC. 28
Tab 2.5. DG simulation parameters. 31
Chapter III : Control of DC-DC Power Converters.
Tab 3.1. Numerical values of the Boost and Buck simulation parameters. 45 Tab 3.2. PI Controllers’ parameters and control sample time of the closed. 52
Chapter IV : Power Management and Coordinated Control of the SAAPG.
Tab 4.1. PI Controllers parameters of the ACU. 64
Table of Contents
General IntroductionGENERAL INTRODUCTION 2
Chapter I : Overview on Renewable Energy Based Active Generators.
INTRODUCTION 6
I.1 RENEWABLE ENERGY; DEFINITION, BENEFITS AND CATEGORIES 6
I.1.1 Definition 6
I.1.2 Benefits of renewable energy 6
I.1.2.a) Energy security 6
I.1.2.b) Environment protection 7
I.1.2.c) Economic growth 7
I.1.3 Dispatchable and non-dispatchable renewable energy sources 7
I.2 ACTIVE PV GENERATOR: TERMINOLOGY, STRUCTURE AND INTEREST 8
I.3 ENERGY STORAGE SYSTEM USED IN APG (or HRES) 10
I.4 TOPOLOGIES AND SOURCES INTERCONNECTION OF A SAAPG 12
I.4.1 Topologies used in SAAPG system 12
I.4.2 Sources interconnection of a SAAPG 13
I.5 POWER MANAGEMENT STRATEGIES FOR MICROGRID 15
I.5.1 Active load sharing method 17
I.5.2 Droop characteristic method 17
CONCLUSION 18
Chapter II : Modeling and Sizing of Electrical System Parameters.
INTRODUCTION 20
II.1 OVERVIEW ON THE STUDIED SAAPG 20
II.2 POWER GENERATORS OF THE STUDIED SYSTEM 21
II.2.1 PV Source 21
II.2.2 Lead Acid Batteries 25
II.2.3 Ultra Capacitor 28
II.3 POWER CONVERTERS OF THE STUDIED SYSTEM 32
II.3.1 DC-DC power converters 32
II.3.2 DC-AC three-phase PWM converter 37
CONCLUSION 38
Chapter III : Modeling and Sizing of Electrical System Parameters.
INTRODUCTION 40
III.1. LARGE SIGNAL MODEL OF THE DC-DC BUCK & BOOST CONVERTERS 40
III.1.1. State space model of the DC-DC Buck converter 40
III.1.2. State space model of the DC-DC Boost converter 44
III.2. CONTROLLERS DESIGN OF THE BUCK AND BOOST CONVERTERS 48
III.2.1. Linearization of a function around an equilibrium point 48 III.2.2. Small signal model (linearized model) of the boost converter 49
III.2.3. Transfer functions and controllers’ design 51
III.3. SIMULATION RESULTS 52
CONCLUSION 53
Chapter IV : Power Management and Coordinated Control of the SAAPG.
INTRODUCTION 55
IV.1. STUDIED SAAPG DESCRIPTION 55
IV.2. MANAGEMENT STRATEGY 57
IV.2.1. Disparity of sources 57
IV.2.2. Coupling Structure 58
IV.3. POWER MANAGEMENT AND COORDINATED CONTROL 59
IV.3.1. Power Management Unit (PMU) 60
IV.3.1.a. Normal Mode (NM) 61
IV.3.1.b. PV Limitation Mode (PLM) 61
IV.3.1.c. Battery recovering mode (BRM) 62
IV.3.1.d. Full load power DG mode (FLPDM) 62
IV.3.2. Automatic Control Unit (ACU) 62
IV.4. SIMULATION RESULTS, DISCUSSION, AND SYSTEM BENEFITS 64
IV.4.1. Simulation Results and Discussion 64
IV.4.1.b. PV LIMITATION MODE (PLM) 65
IV.4.1.c. FULL LOAD POWER DG MODE (FLPDM) 67
IV.4.1.d. BATTERY RECOVERING MODE (BRM) 67
IV.4.2. System benefits 68
IV.4.2.a. System efficiency improvement 68
IV.4.2.b. System profitability 69
CONCLUSION 69
General Conclusion
GENERAL CONCLUSION 71 REFERENCES 73APPENDICES
APPENDIX A 80 APPENDIX B 85 APPENDIX C 93 APPENDIX D 94GENERAL INTRODUCTION
2
GENERAL INTRODUCTION
Decentralized power supplying of remote areas has become more practical in the recent decade, especially with the falling price of what is called: DRES Distributed Renewable Energy Sources (PV, wind, Fuel cell etc.) and the rising price of rural areas grid extension due to geographical reasons and the very low population density in these locations, without excluding the voltage drop drawback at these isolated areas [1- 6]. In south Algeria, for example, the population density barely reaches an average of six inhabitants per km2 [7, 8], according to these conditions, the main Algerian electricity and gas company (Sonelgaz) asserts that a conventional power supply by networks extension is not adapted to remote areas from an economic point of view. Therefore, Sonelgaz has introduced the photovoltaic sector for 20 remote villages as an experiment in south Algeria [9]. In remote areas, it is better to have an emergency source as diesel generator (DG) to assist the active PV generator, especially in case of critical loads as: hospitals, telecom application, remote monitoring etc. It is common in the literature that diesel generators are coupled in the AC side, however, especially in remote areas and low power installations (few tens of kW) characterized by dynamic loads (electric motor), AC coupling becomes less suitable solution compared to DC coupling, because of the following three drawbacks:
- High dynamic load variation increases thermo-mechanical stresses in diesel engine cylinder heads, which decreases their lifetime, thus, increasing curative maintenance frequency [15]; - An AC coupling structure of the DG requires a wound rotor alternator (WRA) type, while a permanent magnet synchronous generator (PMSG) can be used in a DC coupling structure, which reduces curative maintenance frequency too;
- In the case of dynamic loads (electric motors in our case study), the DG must be oversized in order to support the transient regimes, and therefore, in the steady state, DG works in a downgrade operating point compared to its rated power, which reduces considerably its efficiency as it is known.
GENERAL INTRODUCTION
3 A DC coupling structure of the DG is adopted exploiting the UC to assist it in all transient situations [16, 17] and for fast dynamic power regulation providing smooth power quality [25, 26]. In order to bypass drawbacks cited above for the AC coupling case, a power-coordinated control of DG/ Lithium-battery for an electrical boat with DC side coupling of DG is studied in [17], except that, mechanical stresses applied on the DG are not well taken into account, which clearly appears on the DC-link voltage waveform.
This thesis addresses a feasibility study of a Standalone Active PV Generator (SAAPG) for an isolated agriculture area, consisting of four sources: PV, Lead Acid batteries, Ultra-capacitor (UC) and DG. The management algorithm proposed in this thesis takes into account two dominant criterions: smart management under different modes and cost price. The energy cost price must be optimized in order to cushion the global installation cost as soon as possible because it is a quite expensive system, and to optimize lifetime of the plant with minimizing curative maintenance frequency, since the system is located in isolated area.
The present thesis titled: Contribution to Energy management of Hybrid Renewable Energy System for Isolated Areas, is organized in four chapters as follow:
The first chapter presents an overview on renewable energy based active generators. It will provide a general overview on active PV generator (APG) in the literature concerning some: generalities, definitions and expressions. Then, structures and topologies are detailed in order to choose the most appropriate one to our application: isolated farm characterized by its high dynamic loads. Finally, management levels are well discussed and the chosen level is revealed.
The second chapter is dedicated for: modeling and judicious sizing of all electrical system parameters, concerning sources and passive components (inductor and capacitor), DC-DC power converters. Judicious sizing makes simulation results more credible and promotes the feasibility of a possible practical realization in the future.
The third chapter treats modeling and controllers’ design of the DC-DC back and boost converters used in the management system. Power converters are modeled using average large
GENERAL INTRODUCTION
4 signal model. Unlike the buck converter, the boost converter have a non linear large signal model which renders the jacobian lineraziation necessiry generating the small signal model (linear model), providing the ability to apply the linear control technics (PI controller).
The last chapter concerns the power management and coordinated control of the SAAPG dedicated to power supply an isolated area. The SAAPG is composed from four sources: PV, Batteries, UC and DG. These sources are controlled in coordination, according to a specific management algorithm, in order to regulate the DC-link voltage value (Vdc = 700V) providing the stability of the whole system. The DC-AC three-phase PWM converter consider the DC link as an ideal DC voltage source, therefore it operates independently from the DC side supplying AC dynamic loads.
Finally, a general conclusion is cited, illustrating all the main points treated in this thesis as well as perspectives emerged from this work.
Chapter I
Overview on Renewable Energy Based Active
Generators.
Chapter I Overview on Renewable Energy Based Active Generators.
6
INTRODUCTION
The present chapter will provide a general overview on active generators based on PV resource. It begins with some generalities about definitions, benefits and statistics of renewable energies especially PV type. Then, notion of Stand-alone Active PV Generator (SAAPG) is introduced clarifying advantages and necessity of this one in remote areas. Finally, several structures and topologies are detailed in order to design the suitable one for our case study.
I.1 RENEWABLE ENERGY; DEFINITION, BENEFITS AND CATEGORIES I.1.1 Definition
Renewable energy is the energy generated from natural resources. Renewable energy flows involve natural phenomena such as sunlight, wind, tides and geothermal heat, as the International Energy Agency (IEA) explains: “Renewable energy is derived from natural processes that are replenished constantly. In its various forms, it derives directly from the sun or from heat generated deep within the earth. It includes the electricity and the heat generated from solar, wind, ocean, hydropower, biomass, geothermal resources and bio-fuels and hydrogen derived from renewable resources” [34].
I.1.2 Benefits of renewable energy
Renewable energy sources contribute to the diversity of the energy supply portfolio and reduce the risks of continued (or expanded) use of fossil fuels and nuclear power. Distributed renewable energies provide options to consumers because of their deployment close to use. Renewable energy is also the most environmentally benign energy supply option available in current and near-term markets. Finally, renewable energies contribute to a healthy economy, both in their contribution to the efficiency of the energy system, and in the employment and investment opportunities that arise from continued rapid market growth [35].
I.1.2.a) Energy security
The IEA defines energy security as the uninterrupted availability of energy sources at an affordable price. Energy security has many aspects: long-term energy security mainly deals with timely investments to supply energy in line with economic developments and environmental needs. On the other hand, short-term energy security focuses on the ability of the energy system to react promptly to sudden changes in the supply-demand balance [34].
Chapter I Overview on Renewable Energy Based Active Generators.
7
I.1.2.b) Environment protection
Moreover, today global warming becomes more serious due to the greenhouse effect. Some emissions of greenhouse gases come from the human activity. The production and processing of electrical energy is one of the main sources of greenhouse gases. Renewable energy sources (RES) generates electricity from sustainable sources like wind, solar, and geothermal power with little or no pollution or global warming emissions [36].
I.1.2.c) Economic growth
Renewable energy has several important economic benefits. In IEA (International Energy Agency) countries, the main economic benefits are employment creation and increased trade of technologies and services [35].
I.1.3 Dispatchable and non-dispatchable renewable energy sources
A dispatchable source refers to electricity sources that can be dispatched at the request of power demand. According to this notion, renewable energy sources (RES) can be divided into two types: dispatchable and non-dispatchable.
Dispatchable renewable source: it is a power source, which is characterized by the ability to deliver any power value (lower than its rated power) any time, like: Water power (hydro), Biofuel, Geothermal energy and so on.
Non-dispatchable renewable source: it is an intermittent source, which the power value is controlled by an unpredictable parameter as weather conditions, like: solar PV power and wind power.
Non Dispatchable Renewable source
Dispatchable Renewable source
Chapter I Overview on Renewable Energy Based Active Generators.
8 Among these renewable sources, solar PV power is among the most attractive renewable energy source comparing, it showed record 34% growth in power generation in 2017 and is well on track to meet its SDS (Self-Directed Search) target, which requires average annual growth of 17% between 2017 and 2030. According to the IEA statistics, Fig.1.2 depicts the energy quantity in GWh of the electricity generation from solar PV source during the last two decades.
Fig.1.2. World electricity generation from the solar PV source during the two last decades [34]. The IEA asserts that around 58 GWh of solar PV energy was installed in Algeria recently until 2015 [34].
I.2 ACTIVE PV GENERATOR: TERMINOLOGY, STRUCTURE AND INTEREST
Solar energy-based generators are passive generators since they cannot be dispatchable; its power production depends on the availability of the primary renewable source or insulation. So, a high reliability with a good efficiency for a power system cannot be ensured with 100% of renewable energy-based generators.
Energy storage devices can serve as backup power plants. They can be used to store or to release electrical power like an energy buffer, supporting the operation of sources, transmission,
0 50000 100000 150000 200000 250000 300000 1993 1995 1997 1999 2001 2003 2005 2007 2009 2011 2013 2015
E(GWh)
Chapter I Overview on Renewable Energy Based Active Generators.
9 distribution and loads. Therefore, they can help to solve the problems of renewable energies’ intermittent availabilities and fast transients.
The association of an energy storage system (ESS) to a renewable PV based generator constitutes a hybrid power generator or what is known as: Active PV Generator. This APG (Active PV Generator) is a distributed renewable source (DRS) which is considered as a decentralized power source, it become competitive comparing to the conventional generators in point of view of [37]:
Increased electric system reliability (no electrical lines power losses);
An emergency supply of power (maintaining the power supply is a local task);
Reduction of peak power requirements;
Offsets to investments in generation, transmission, or distribution facilities that would otherwise be recovered through rates;
Provision of ancillary services, including reactive power;
Improvements in power quality;
Reductions in land-use effects and rights-of-way acquisition costs.
PV Panels Energy Storage system (ESS) DC DC DC DC Local Management Controller Active PV Generator DC-Bus DC AC Load Grid Microgrid Operator (Controller)
Fig.1.3. Elementary structure of a Grid connected Active PV Generator (APG) [37]. As defined in [38]: “PV based active generator is a system comprising of a PV array and a
Chapter I Overview on Renewable Energy Based Active Generators.
10 Therefore, such system should be able to generate, store and release energy as long as this one is needed depending on load variation. Fig.1.3 depicts an elementary structure of a grid connected PV based active generator or APG.
In the literature, another word is used to describe an APG; it is Hybrid Renewable Energy System (HRES). A HRES consists of two or more energy sources, with at least one of them renewable and integrated with power control equipment and an optional storage system. An HRES is also called in the literature as Distributed Energy Resources (DER) or Distributed Generation (DG) [39].
In the case when the APG is not connected to the grid, or this last does not even exist, two terms are used in the literature to describe the APG:
Stand-alone Hybrid Renewable Energy (or Power) System:
Stand-alone Hybrid Renewable Energy (or Power) Systems are found as the integration of several generation systems, with at least one renewable (photovoltaic (PV), wind, diesel, hydrogen, fuel cell), and optional storage system (battery, fuel cell);
Off-grid, remote or islanded Hybrid Renewable Energy (or Power) System:
Off-grid are found synonymous with Stand-alone hybrid energy/power systems as the integration of several generation systems. But, when referring to Off-grid systems the location is usually without access to a main electricity grid, so generally they are placed in remote locations or rural areas. In the case where, an off-grid system might be connected to the grid, then the functionality of working disconnected and independently from the grid is known as stand-alone mode. It has been identified a preference of usage of off-grid for a broader audience, while the usage of stand-alone is more restricted within the research community [39].
I.3 ENERGY STORAGE SYSTEM USED IN APG (or HRES)
All potential energy sources type can be used as storage source, the energy can be stored in different forms:
Chemical: Hydrogen, biofuels, liquid nitrogen, oxyhydrogen …
Electrochemical: Batteries, flow batteries, fuel cells …
Electrical: Capacitor, super capacitor, superconducting magnetic energy storage…
Mechanical: Compressed air energy storage, flywheel energy storage, hydraulic…
Chapter I Overview on Renewable Energy Based Active Generators.
11 For electrical applications, according to the different requirements, various kinds of storage technologies are used with specific characteristics such as the rated current/voltage, the capacity of electrical power/energy, the maximum current, the minimum voltage, the weight, the volume etc. [35].
Fig.1.4.Energy and power density of different storage technologies Source [35].
According to Fig.1.4, storage element can be classified into two categories: energy density sources and power density sources.
Long-term energy storage units have a higher energy density; they are generally used as energy reserve units for long time (hours to days). Among these units, we can cite fuel cells and conventional batteries.
Fast dynamic power storage units have higher power density. They are suitable for high power fast balancing. Their period of electrical power release and restoration is significantly less than the long-term energy storage (from several milliseconds to minutes). This kind of power storage can perform a good dynamic characteristic in the application of hybrid electric vehicle. In the domain of renewable energy-based power production, they can also provide an improvement of the power quality [35].
Several kinds of batteries can be used in PV system to assist the intermittency of the PV array primary source; such as Lead acid, Lithium ion, saltwater and so on. For isolated PV applications, lead-acid batteries are yet used as an energy buffer because of their low cost and because, lead recycling is a well-established industry [21].
Chapter I Overview on Renewable Energy Based Active Generators.
12 The energy storage system (ESS) chosen in our case study is composed of Lead acid batteries bank as a long-term energy storage unit for steady state energy balance, and ultra-capacitor as high-power density storage element for transient regime power balance.
I.4 TOPOLOGIES AND SOURCES INTERCONNECTION OF A SAAPG
A stand-alone active PV generator (SAAPG) is an APG dedicated to power supply an isolated or remote area, or, it depicts an island mode in case of grid connected PV system. In our study, we focus on the case of remote area or Off-Grid HRES.
I.4.1 Topologies used in SAAPG system
Stand-alone Hybrid Renewable Energy systems are found as the integration of several generation systems, with at least one renewable source which is PV in our case. A lot of variety of topologies can be found in the literature, the combination is based on some criteria as type and historical value of the existing renewable source (wind, insulation etc.), rated power, cost price,
profitability and son on. Referring to [39], the following topologies (structures) are well studied maybe realized as a SAAPG:
PV/Micro turbine; PV/Wind/Hydrogen; PV/Wind/Fuel cell; PV/Wind/Battery;
PV/Fuel cell/Battery; PV/Hydrogen/Battery.Even with energy storage system (ESS), other topologies integrate diesel generator (DG) among the SAAPG sources. Some works like [41] justify this integration (PV–Battery–DG hybrid energy systems) that it offers technical, economic and environmental benefits compared to traditional off-grid systems. In [42], four sources (PV, Battery, Ultra capacitor and DG) are combined together justifying this integration by the fact that especially in off-grid mode, a DG is needed as another backup power mostly if the load do not allow power failure. Tab.1.1 depicts some works, which combine DG to ESS (Energy Storage System) in SAAPG.
Chapter I Overview on Renewable Energy Based Active Generators.
13 Tab.1.1. Some works which combine DG and ESS in SAAPG.
SOURCES COMBINATION PAPER TITLE PAPER REFERENCE
PV/Diesel/Battery
Study of a solar PV–diesel– battery hybrid power system for a
remotely located population near Rafha, Saudi Arabia
Energy, Volume 35, Issue 12, December 2010, Pages 4986-4995
PV/Wind/Diesel/Battery
Sensitivity of internal combustion generator capacity in standalone
hybrid energy systems
Energy, vol. 39, no. 1, pp. 403-411, 2012.
Economic analysis and power management of a stand-alone wind/photovoltaic hybrid energy system using biogeography-based
optimization algorithm Swarm and Evolutionary Computation, vol. 8, pp. 33-43, 2013. PV/Wind/Diesel/Battery/UC Energy management of DC microgrid based on photovoltaic
combined with diesel generator and super capacitor
Energy Conversion and Management, Vol 132,
15 January 2017, Pages 14-27.
I.4.2 Sources interconnection of a SAAPG
The type of energy management implemented depends on the system configuration. Two alternatives are generally used depending on the location of PV generators, as shown in Fig.1.5 in both of them, the diesel generator, loads and battery, through an inverter in that case, are connected to the common AC bus. However, in the first case, the PV arrays are connected to the battery through a DC/DC converter whereas in the second case, they are connected to the AC bus through an inverter [40].
The configuration shown in Fig.1.5.a (Centralized PV generation) is simpler than the second one (Distributed PV generation) and depicts many advantageous in many situations. Since the generation and storage are centralized, all management data are close and easily accessible, where, a simple energy management strategy is required. The DC-Bus is controlled via the battery bank DC/DC converter when this one is charged, so, communication cables are no needed in this case. The main drawback of this configuration that; loads are so far from the SAAPG, which results more and more power losses that loads are distant.
Chapter I Overview on Renewable Energy Based Active Generators. 14 PV DC DC DC DC DC AC DC-Bus AC-Bus Diesel Generator B at te ri e U lt ra C ap ci to r DC DC PV DC DC DC DC DC AC DC-Bus AC-Bus Diesel Generator B at te ri e U lt ra C ap ci to r DC DC DC AC PV DC DC AC DC PV DC DC DC AC PV DC DC AC DC AC-Bus L oa d L oa d L oa d L oa d
(a) Centralized PV generation
(b) Distributed PV generation L oa d L oa d L oa d
Fig.1.5.Centralized and distributed PV generation in SAAPG [40].
However, this structure (shown in Fig.1.5.a) can be adopted only when PV generators are centralized close to the battery bank, which is not always the case when PV generators are distributed. In such case (distributed PV generators), the second configuration becomes more attractive (Fig.1.5.b). It can be convenient in many applications such as rural electrification since
Chapter I Overview on Renewable Energy Based Active Generators.
15 the PV arrays can be placed on the house roof and connected directly to the mains. This configuration is more expensive than the first (more power converters) but it allows a better efficiency (PV power close to loads). On the other hand, the management algorithm will be more complex than the first case. In normal operation, the diesel generator is not connected. In this situation, the PV inverters operate as current-source inverters (CSI), delivering maximum power. The battery inverter operates as a voltage-source inverter (VSI), setting the grid frequency and voltage]. As a result, the battery inverter automatically supplies the required real and reactive power.
However, the inconvenience of this system is that communication cables are required in order to reduce the PV power when the battery is fully charged, which makes the system more complex, more expensive and less reliable. Well-known droop methods succeed in sharing the power among parallel VSIs without the need of communication cables. However, the PV power reduction in such a system with no communications has not yet been addressed [40].
The remote area to power supply in our case study is located on a small surface, which favors the centralized PV generators configuration. We will combine four sources to power supply this island agricultural farm characterized by its high dynamic loads as follow. These four sources are:
1) PV generator as a renewable energy source;
2) Lead acid batteries as an energy storage element;
3) Ultra-capacitors as a transient power compensator;
4) Diesel generator, which present the emergency reserve generator.
I.5 POWER MANAGEMENT STRATEGIES FOR MICROGRID [23]
The distribution feature of renewable resources such as roof-mounted photovoltaic panels and small wind turbines, makes the structure of the Smart Grid directly too complicated to implementation. One potential path to implement Smart Grid is using microgrids, and then the microgrids can be connected together to form the bigger power grid or smart grid.
The microgrid concept given by U.S. Department of Energy is "a group of interconnected loads and distributed energy resources within clearly defined electrical boundaries that acts as a single controllable entity with respect to the grid, and it can operate in grid-connected and island-mode [43]. Although different countries and research institutes have various definitions of the microgrid, the core concept of them is to give solutions on how to integrating renewable resources and improve efficiency, quality, reliability and security.
Chapter I Overview on Renewable Energy Based Active Generators.
16 The distribution feature makes the control structure of microgrid greatly different from traditional central power plants. Furthermore, the intermittent renewable resources productions result to more complicated power management and stability problems. Therefore, a well-designed power management is essential to a functional microgrid.
The micro-grid power management with hierarchical structure can be divided into three layers, as shown in Fig.1.6.
Economic Optimization
Environmental Optimization
Restore voltage & frequency deviations
Improve power quality and system reliability
Tertiary control
Secondary control
Load sharing between DERs
Control of DERs
Primary control
Local controller
Central controller
Microgrids with DERs and Loads
F
ee
db
ac
k
fo
r
lo
ca
l
an
d
se
co
nd
ar
y
co
nt
ro
ll
er
Chapter I Overview on Renewable Energy Based Active Generators.
17 The primary control in local controller is responsible for power distribution between distributed energy resources (DERs) to avoid circulating active and reactive power, and control of DERs according to their features; and the secondary control in central controller is to maintain stable voltage and frequency during load change or power variation of renewable resources, while tertiary control in the top of the hierarchical structure is to operate economic or environmental optimization of the power management [23]. In our case, our focus is limited to the primary control seen that it is our case study in SAAPG or off-grid PV systems. Commonly, two strategies are adopted in this power management level (primary control) as follows:
- Active load sharing method; - Droop characteristic method.
I.5.1 Active load sharing method
A high-band communication is usually vital for the active load sharing methods to sharing average active/reactive power, peak power or power errors. Current or active/reactive power reference points are determined through different approaches such as master-slave, centralized and average load sharing. In the master-slave control, one of the paralleled converters is assigned as the master converter and operates as a voltage source converter to regulate the output voltage, while others behave as current sources converters and to track the master converter's current. Rotating master and automatic master are also proposed to decrease the dependence on specified module [23]. In the third chapter, an almost similar method is chosen in order to power management the SAAPG studied in this work.
I.5.2 Droop characteristic method
The droop characteristic method, using the mechanism of programming output impedance to obtain load sharing, has been frequently referred to as the autonomous, independent and wireless control method due to its elimination of intercommunication links between the converters.
The basic principle of droop characteristic is that, the frequency decreases with the increase of output active power (in AC CCP), and voltage amplitude decreases with increase of reactive power, as depicted in Fig.1.7.
The relationship is defined as:
* * * * P Q f f D P E E D Q (1.1)
Chapter I Overview on Renewable Energy Based Active Generators.
18 Where *
E and f are the DER nominal voltage RMS value and frequency during no load *
condition. The droop coefficients, D and P DQ can be designed based on the converter power
rating and maximum allowable voltage and frequency deviations, or optimal designed by some heuristic algorithms (e.g. partial swarm optimization, genetic algorithm) [23].
Voltage Frequency
E
*E
D
QD
Pf
*f
Q
P
(a) Frequency/Active power droop (b) Voltage/Reactive power droop Fig.1.7. Frequency/active power and voltage/reactive power droop characteristics [23].
In our case study, the CCP (Common Coupling Point) is situated in DC instead of AC side, which means that, DC-link voltage value will be regulated by DC power (DC power instead of active and reactive power) sources generated/absorbed by DC power converter as it will be well detailed later.
SUMMARY
This first chapter has presented an overview on PV system based active generator designed for on or off grid application. It was intended to give a brief state of art on SAAPG through definition, terminologies, sources combination, interconnection and so on. Also, power management strategies for microgrid and different management levels are discussed. We conclude that, the most appropriate topology of an off-grid active PV system according to our case study (isolated farm), should be composed of: PV, Batteries, UC and diesel generator.
Chapter II
Modeling and Sizing of Electrical System
Parameters.
Chapter II Modeling and Sizing of Electrical System Parameters.
20
INTRODUCTION
This chapter is dedicated to a global analysis of the studied PV system. This analytic study aims do design and sizing all system components in order to allowing simulation to be feasible and closer to practical achievement. According to the sizing point of view, this chapter is limited to the electrical sizing only, such as, power sources (PV field, Lead Acid batteries bank, diesel generated etc.) and power converter components (inductances, capacitors, DC-link capacitor value etc.). The simulation of the proposed system will be made with Matlab Simulink environment, thereby; we will exploit the SimPowerSystem library to avoid modeling of several existing parts in this library such as; lead acid batteries, ultra-capacitor, power switches etc.
II.1 OVERVIEW ON THE STUDIED SAAPG
The Fig.2.1) shows a block diagram of the studied system in this thesis; it is about a 15kW Stand Alone Active PV Generator (SAAPG) dedicated to supply an isolated agriculture area. The main objective of this work, resides in the simulation of the proposed SAAPG system in order to check its real feasibility according to the two following main criteria:
1- Competitive price of the global system and its profitability;
2- Long-life and low maintenance frequency of the physical system in fact that its bout an isolated area.
Lead Acid Batteries Bank
PV field DC/DC Boost Converter DC/DC Bidirectional
Buck & Boost Converter Three Phase DC-AC PWM
Converter Ultra capacitor Buck & Boost ConverterDC/DC Bidirectional
Diesel Generator
Bridge Rectifier & DC/DC Boost Converter D C L in k Isolated Agriculture Area
Fig.2.1. Diagram block of the proposed SAAPG system. As depicted in Fig.2.1, the SAAPG is based on five subsystems:
1- PV field controlled by DC-DC boost converter in order to extract exactly the value of the PV power reference imposed by the Power Management Unit (PMU), either in MPPT mode when
Chapter II Modeling and Sizing of Electrical System Parameters.
21 batteries are not fully charged or in PV Limitation Mode (PLM) in the case where we do not have where to store PV energy (fully charged Batteries);
2- Lead Acid Batteries Bank used as an energy source (Low Power Density), with its bidirectional DC-DC power converter to regulate input/output low frequency component (LFC) batteries power reference;
3- Ultra capacitor used as a power source (High Power Density), with its bidirectional DC-DC power converter to regulate input/output High Frequency Component (HFC) power reference; 4- The emergency source (Diesel Generator) coupled in the DC side through: a full bridge diode rectifier and DC-DC boost converter.
5- The DC-AC three-phase PWM converter, which operates alone considering the DC-link as a fixed DC voltage source, which is regulated online by the management and coordination of the four sources cited above, as it will be well detailed in chapter IV.
II.2 POWER GENERATORS OF THE STUDIED SYSTEM
A hybrid PV configuration is very attractive for stand-alone systems in terms of cost and reliability, thereby; an adequate and proper sizing proves necessary in such systems enhancing efficiency and profitability, consequently; the cost price [40]. In the present section, we will develop, only an electrical sizing of the SAAPG power sources.
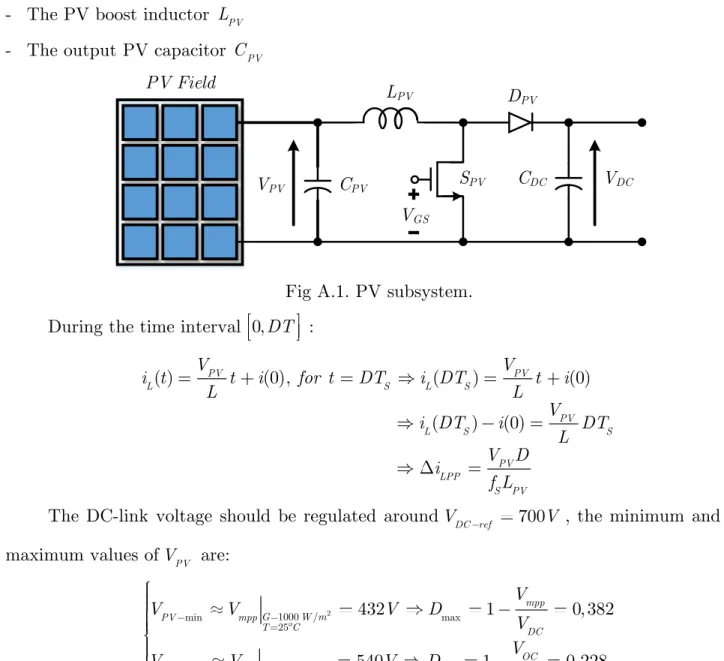
II.2.1 PV Source
The PV field is composed of series-parallel PV modules network, each module in turn, is composed of some PV cells where their common model is depicted in Fig.2.2.
IL ID ISH RSH RS VPV IPV RL D In so la ti on
Fig.2.2. Single diode PV cell Model.
IPh: Photocurrent, its intensity is linearly proportional to the irradiation;
ID: Current diode, since it is a PN junction;
Chapter II Modeling and Sizing of Electrical System Parameters.
22
RSh: it is mainly caused to modeling leakage currents, due to the non-ideality of the PN junction
and the impurities near the junction, which cause a partial short circuit of the junction, in particular, near the edges of the cell [44].
The voltage across the shunt resistorRsh, diode current, shunt resistor current and PV cell current are given by equations (2.1).
0 exp 1 Sh PV S PV Sh D Sh Sh Sh PV Ph D Sh V V R I qV I I akT V I R I I I I (2.1) Where:
VSh : Voltage across Rsh or the diode VPV : Voltage across the PV cell terminals (V),
RS : Series resistor (Ω) IPV : PV cell Output current (A)
ISat : Reverse saturation current (A) k : Boltzmann's constant (1.3806x10
-23 J/K),
ID : Diode current (A) T : Absolute temperature in K
q : Elementary charge (1.6022x10⁻¹⁹ C) a : Diode ideality factor (1 for ideal diode)
Substituting equations in IPV formula, PV cell output current (IPV) can be calculated via the equation (2.2). ( ) exp PV S PV 1 PV S PV PV Ph Sat Sh q V R I V R I I I I nkT R (2.2)
Generally, all PV panel manufacturers give, in standard test conditions (STC values: standard irradiation value: GS=1000 W/m
2 and standard temperature value: T
S = 298°K, some essential data summarized on Tab.2.1.
When the cell is operated at short circuit point (VPV = 0), the current IPV is defined as the
short-circuit current ISC. For a high-quality PV cell (low value of RS and I0, and high value of
Chapter II Modeling and Sizing of Electrical System Parameters.
23 Tab.2.1. PV panel essential data.
PMPP : Maximum Power Point power value (W) at STC
VMPP : Maximum Power Point voltage value (V) at STC
IMPP : Maximum Power point current value (A) at STC
ISCS : Short Circuit current value at STC (A)
V0CS : Open Circuit voltage value at STC (V)
ΔISC : Temperature coefficient of short circuit current (A/°K)
ΔVOC : Temperature coefficient of short circuit current (A/°K)
NS : Number of cells per PV module or panel
By considering the effect of the irradiance and the temperature, the current ISC is expressed in equation (2.3). [1 ( )] SC Ph SCS SC S S G I I I I T T G (2.3)
When the cell operates in open circuit (IPV=0), the voltage VPV is defined as the open-circuit
voltage (VOC). Assuming the shunt resistor (RSh) is high enough to neglect its current (ISh) the
open-circuit voltage is expressed in equation (2.4).
0 ln( PV 1) OC I kT V q I (2.4)
In an open-circuit condition: VPV = VOC and IPV = 0, the photocurrent should be:
[exp( OC) 1] OC Ph D Sh Sat t Sh V V I I I I V R (2.5) With S , t N kT V
q is the thermal voltage and NS is PV cells number per PV module or PV
panel. The saturation current(ISat) is defined in equation (2.6).
exp( ) 1 OC Ph Sh Sat OC t V I R I V V (2.6)
The open-circuit voltage value according to the temperature variation is expressed in equation (2.7).
( )
OC OCS OC S
Chapter II Modeling and Sizing of Electrical System Parameters.
24
Notes:
1- There remain two parameters to be determined, RS and RSh. Usually, these resistor values are identified by some numerical algorithms executed by calculator like in [47]
2- The resistors and the ideality factor are influenced by the temperature [45]. In order to simplify the model, these values are set in STC.
3- For a given voltage VPV the equation may be solved to determine the output current IPV. Because the equation involves the current on both sides in a transcendental function, the equation has no general analytical solution. However, it can be easily solved by using numerical methods [45].
4- Once the PV module (PV Cell x NS) is elaborated, a simple multiplication by MS x MP (MS: number of modules in series / MP: number of modules in parallel) to obtain the desired PV field.
Tab.2.2. PV panel parameters used in simulation (ASMS-180M) PMPP : Maximum Power Point power value (W) at STC 180 VMPP : Maximum Power Point voltage value (V) at STC 36 IMPP : Maximum Power point current value (A) at STC 5 ISCS : Short Circuit current value at STC (A) 5.5
V0CS : Open Circuit voltage value at STC (V) 45
ΔISC : Temperature coefficient of short circuit current (A/°K) 0.038982 ΔVOC : Temperature coefficient of short circuit current (V/°K) -0.36491
NS : Number of cells per PV module or panel 72
RS : Series Resistance (Ohms) 0.69467
RSh : Shunt Resistance (Ohms) 160.0579
a:Diode ideality factor 1.0163
The PV Panel used in simulation in this work is referenced by: ASMS-180M from Aavid Solar Company (exists in MATLAB);its parameters are detailed in Tab.2.2.
Tab.2.3. Simulation parameters of the used PV field.
PMPP : Maximum Power Point power value (kW) (180 x 12 x 8) 17,3 VMPP : Maximum Power Point voltage value (V) (36 x 12) 432 IMPP : Maximum Power point current value (A) (5 x 2) 40 ISCS : Short Circuit current value (A) (5.5 x 2) 44 V0CS : Open Circuit voltage value (V) (45 x 12) 540
Chapter II Modeling and Sizing of Electrical System Parameters.
25 According to our rated power (15kW), we have used MS*MP 12* 8 96 PV panels to achieve this power value (Tab.2.3).
Fig.2.3. P-V and I-V curves of the used PV field for a variety of irradiation.
II.2.2 Lead Acid Batteries [52, 53]
Lead acid battery is the most used storage element in PV system. The main function of lead acid batteries is the storage and the supply of energy in a PV system. The stored energy is chemical can be converted into electrical and vice versa. The electrochemical reactions are described by the reactions mentioned by equation (2.8).
arg arg 2
2
2 42
42
2 Disch e Ch ePbO
H SO
Pb
PbSO
H O
(2.8)This model consists of a voltage source Eb,and an internal resistor Ri . This model includes the main variables of the system: the Battery State of Charge (SOC), the current flowing across
Chapter II Modeling and Sizing of Electrical System Parameters.
26 the battery Ibat , the temperature T and the number of cells in series nb. The circuit equation is expressed on Fig.2.4 [45].
f(SOC,I
Bat)
R
iI
BatV
Bat+
-E
Batf(SOC,I
Bat)
Fig.2.4. Equivalent electrical circuit of the CIEMAT battery model [45]
( )
( )
( , , )
Bat Bat b Bat i Bat
i Bat
E f SOC V n E R I
R f I SOC T (2.9)
The voltage source EBat represents the voltage in open circuit across the battery terminals.
This voltage is due to the stored energy into the battery through the electrochemical reactions. Obviously, this term depends directly on the stored energy. Ri is a resistor and represents the
losses. This resistor value includes the effects of the working point (I, SOC, T) and the health of the battery. A damaged battery has a high value of resistor irrespective of its working point. Also, the resistor is inversely proportional to the state of charge. Furthermore, at the same time as the battery is discharging, the resistor value is increasing. Note that all physical effects are expressed into electrical equations and are modeled in these terms. The state of charge must be considered as an indicator of the electrical charge stored in the battery. The value range is 0<SOC<1. The following equations (2.10, 2.11 and 2.12) describe the behavior of this indicator.
1 ( ) ( ) ( ) t C Bat SOC t I t dt C t (2.10) 2 ( ) ( ) 1 1 ( ) ( ) Cap nom tcoef B Bat Cap C C nom C C C t I t A T t T t I (2.11)
Chapter II Modeling and Sizing of Electrical System Parameters. 27 nom n C I n (2.12)
Where : C(t) is the battery capacity; C the charging efficiency; Cnomis the nominal battery capacity (at n hours); Ctcof, Acap and Bcapare model parameters; T is the temperature variation
from the reference value at 25°C; I the discharge current corresponding to then Cnom; n is the time in hours; 𝛼C and 𝛽C are the temperature parameters.
The SOC must be understood as the relation between the accepted energy and the available capacity at all times. The inner integral term models the accepted energy over the battery working life. In addition, the outer integral term models the battery capacity due to the working point environment at any given time. Both terms are functions of time and are evolving continuously. When the SOC is unity, the battery cannot accept more energy from the system, because the stored energy fills all the battery capacity. Moreover, when the SOC is null the battery has no energy.
Sqw<n be observed. For the first 16 hours, the current is flowing inside the battery, and it evolves into different zones: charging, overcharging and saturation zones. From 16 hours to 27 hours the current is flowing outside the battery and it evolves into discharging, over discharging and exhaustion zones.
The lead acid battery model used in this work is which exist in SimPowerSystem of Matlab library.
Chapter II Modeling and Sizing of Electrical System Parameters.
28
II.2.3 Ultra Capacitor
An ultra-capacitor (UC) also called as an electrochemical double layer capacitor, is a low voltage energy storage device similar to a battery but exhibiting an extremely high capacitance value. UCs have high power density, low series resistance, high efficiency, large charge/discharge capacity and low heating losses. These deep-discharge capacitors with a fast response are suitable for operation over a wider range of temperature. However, the terminal voltage of an UC decreases with decreasing state of charge (SOC) and rate of decrease depends on the load current [46]
RS IUC VUC + -C0 VC VR
Fig.2.6. Basic model of Ultra-capacitor [46]. All internal electrical relations are expressed in the equation (2.13).
0 1 ( ) ( ) ( ) ( ) ( ) ( ) C UC R S UC UC C R dV I t dt C V t R I t V t V t V t (2.13)
With: IUC is the ultra-capacitor current andVUC is the output voltage. Tab.2.4. The used simulation parameters of UC.
Nominal Voltage in (V) 250 V
Capacitance Value 2 F
Equivalent series resistance 0,0089 Ohm
Chapter II Modeling and Sizing of Electrical System Parameters.
29
II.2.4 Emergency Source (Diesel Generator)
A diesel generator (DG) is mainly consist of a diesel engine (DE) driving an electrical generator, usually a wound rotor synchronous machine or alternator. The alternator guarantees a fixed value of the output voltage amplitude, however, the diesel engine speed governor, which determine the output voltages frequency, maintain mechanically the speed of the DE around a fixed reference (synchronism speed). In this work, the DG is coupled on the DC side; throw a three-diode bridge rectifier and a DC-DC boost converter, the advantages of this coupling structure are well detailed later in chapter IV. Since the DC-DC boost converter will control the DG power in the DC side, the alternator type can be a permanent magnet synchronous generator (PMSG)
The diesel engine has a very heterogeneous conception in nature, thereby; its model may reach a high-level complexity [17, 19]. However, focusing on the torque dynamics according to the indexed fuel pumping system; its model can be further simplified as in equation (2.14).
1 2 ( ) ( ) 1 S DM DE K T S z S e S (2.14) Where:
- KDM : is the diesel engine gain;
- z S( ): is the fuel consumption index, which makes it possible to evaluate the dynamics of the fuel flow in the diesel engine by means of a characteristic function. The fuel flow function is non-linear, convex, with an absolute minimum in z t( ) 1 [19];
- 2 is the engine combustion delay, it is a time constant expressing the limit in reaction speed of the diesel engine, 2 0.02Sas proposed in [18].
- 1 is the actuator time delay, it is dead time which represents the delay between the time when a change in fueling is applied (fuel rack movement) and the time when enough cylinders fire to achieve the new torque setting [20],
1 60 60 0.03 2 4 t cyl S S Nn N (2.15)
By normalizing equation (2.14) (make the equation in P.U form), when z t( ) 1, it corresponds to the operation in full power. For this operating point, the diesel engine torque
Chapter II Modeling and Sizing of Electrical System Parameters.
30
1
DG
T PU, where KDM 1 for a normalized equation. Where the equation (2.14) can be written as in equation (2.16). 1 2 1 ( ) ( ) 1 S DG T S z S e S (2.16)
To determine the diesel engine model, PADE approximation is used as mentioned in the equation (2.17). 1 1 1 2 2 S S e S (2.17)
The transfer function becomes like mentioned in equation (2.18). 1 1 2 ( ) 2 ( ) 2 1 DE T S S z S S S (2.18)
The equation characterizing (in pu) the dynamics of the two rotating parts (diesel generator and alternator) is given by:
2 1 ( ) 2 1 2 DG DE E D DG D D ref D ref D DE E D DE E dw T T D w dt H J w H S J J J D D D (2.19) Where:
- wDG : Diesel generator base speed; - Sref : apparent base power;
- HD : Equivalent DG inertia in pu; - TDE : Diesel engine torque in pu;
- DD : Equivalent DG friction coefficient; - TE : Resistant torque of the alternator in pu;
- DDE : Diesel engine friction coefficient ; - JDE & JE: Diesel engine & alternator inertia;
- DE : Alternator friction coefficient; - JD : Equivalent DG inertia in kg/m2;
For the alternator, a surface-mounted permanent magnet synchronous generator (PMSG) is considered Ld=Lq=Ls. The PMSG model in the dq frame is given as follow [18]:
Chapter II Modeling and Sizing of Electrical System Parameters. 31 ( ) ( ) 3 2 d S d d d e q q q S q q q e d d e m e m d q d q d V R I L I w L I dt d V R I L I w L I w dt T p L L I I (2.20)
Since the DG works at fixed speed, the Fig.2.7 depicts the transfer function of the closed loop control of the diesel generator.
1 1 2 2 2 1 S S S 1 2H SD DD DE T E T DG w
PID
1 ref w wDG z S( )Fig.2.7. Closed loop control of the DG speed.
Using the PID tuning block in Matlab/Simulink, the PID parameters are estimated as follow:
9, 378 / 3, 649 / 0428.
P I D
K K K
Tab.2.5. DG simulation parameters.
Names Parameters Values Nominal power PN 15 kW
Nominal speed N 1500 rpm Engine actuator time constant τ1 0,02 s
Engine combustion delay τ2 0,03 s
Engine stroke number St 4
Engine cylinder number ncyl 4
PMSG stator resistance RS 0,46 Ω PMSG stator inductance LS 12,5 mH PMSG rotor flux ψm 1,05 Wb Total inertia of DG J 0,71 kg*m2 Total inertia in pu HD 0.583 Friction coefficient DD 0.015 N*S/rd
Chapter II Modeling and Sizing of Electrical System Parameters.
32 Fig.2.8 shows, the simulation result of diesel engine speed control, the speed reference is given in pu(wref 1), at t=10s, a maximum resistance torqueTE 1 (maximum electrical power of DG) is applied on the diesel engine.
Fig.2.8. Fixed speed operation of the DG.
II.3 POWER CONVERTERS OF THE STUDIED SYSTEM
There are three types of power converters in the global system: DC-DC boost converter (for PV and DG sources), DC-DC bidirectional Buck & Boost converter (for batteries and UC) and the DC-AC three-phase PWM converter, remind that the Boost converter is part of the DC-DC bidirectional Buck & Boost Converter, which results that, the analysis will be about two power converters only:
- DC-DC bidirectional Buck & Boost Converter; - DC-AC three-phase PWM converter.
II.3.1 DC-DC power converters
The DC-DC bidirectional Buck & Boost converter, is formed by both buck & boost converters, it depends on the inductor current direction (direction of the power flow) as depicted in Fig.2.9. In our case, lead acid batteries bank or UC is used instead of capacitorC1, on the other hand,C2 presents the DC-link capacitor.
Chapter II Modeling and Sizing of Electrical System Parameters. 33 VGS1 V1 S1 VGS2 S 2 V2 D1 D2 Boost Buck iL C1 C2 L
Fig.2.9. Topology of the DC-DC Buck & Boost converter.
If the inductor current is oriented from V to 1 V the boost converter is activated, on the 2
other side, if the inductor current is oriented in the opposite direction (from V to2 V1 ) the buck converter is activated. 1 1 2 2 1 2 1 2 0 ( ) 0 ( ) 0 ( ) 0 ( ) 0 ( ) 0 ( ) Boost L Buck Boost L Buck S S Enabled i Converter power flow from V to V
S S Disabled S S Disabled i Converter power flow from V to V
S S Enabled
In general, the design of the power converter returns to evaluate wisely its components, especially passive components, inductor and capacitor values, they are both computed respectively from the inductor ripple current and the capacitor ripple voltage. Analyzing the behavior for the buck converter showing in Fig.2.10.
VGS
S
D1
L
C
RL
VO
I
Oi
LiC
I
IVI
Chapter II Modeling and Sizing of Electrical System Parameters.
34
Ripple current and corresponding inductor value
During the interval 0 t DTS the switch S is ON , the diodeD1 is OFF , the inductor is in the charging phase. During remaining time of the period DTS t TS , the inductor is in the discharging phase. Fig.2.11 shows the steady state inductor current form for CCM (Continuous Conduction Mode).
The current through the inductor is given by equation (2.21).
0 ( ) (0) L I O L I O L di V V v L V V i t t i dt L (2.21) Imin Imax iL(A) TS DTS TS+DTS 2TS IO t(S) O L V i L I O L V V i L
Fig.2.11 Steady state inductor current for CCM.
WhereiL(0)is the initial current in the inductor L at timet 0. The peak inductor current becomes at t DT and the peak-to-peak ripple current of the inductor L is presented in
equation (2.22). ( ) (0) ( ) (1 ) (1 ) I O L S I O I O LPP S S S V V i DT DT i L V V D V D D V D i f L f L f L (2.22)
Where the minimum inductor valueLmincorresponding to maximum peak-to-peak ripple current is calculated from the equation (2.23).
Chapter II Modeling and Sizing of Electrical System Parameters. 35 min min max (1 ) O S LPP V D L f i (2.23)
The equation (2.23) is determined for the buck operation mode, in the case of Boost operation mode, the inductor value is determined by equation (2.24) [48].
max min max i S LPP V D L f i (2.24)
Ripple voltage and corresponding capacitor value
In practice, the filter capacitor is designed so that the impedance of the capacitive branch is much less than the load resistanceR . Consequently, the load ripple current is very small and can L
be neglected. Thus, the current through the capacitor is approximately equal to the AC component of the inductor current i tC( ), on the other hand, the DC component of the inductor current IO will float to load(RL) through the capacitor [48].
( ) ( ) ( ) ( )
L C O O L C
i t i t I I i t i t (2.25) The Fig.2.12 depicts the component of both AC capacitor current and DC voltage, the peak-to-peak value of the output ripple voltageVCPP can be easily calculated with a simple geometric manner.
During the time intervalt1 t t2 , since the capacitor current is positive, the capacitor is in the charge phase (capacitor voltage value is increasing). The mean value of current during this interval, bring the capacitor voltage from the minimum to the maximum values.
Calculating the quantity of charge QC Charge stored in the capacitor during this interval by the equation (2.26). 2 1 max max arg 2 2 ( ) 2 8 LPP S t LPP C Ch e C S t i T i Q i t dt f (2.26)