Science Arts & Métiers (SAM)
is an open access repository that collects the work of Arts et Métiers Institute of
Technology researchers and makes it freely available over the web where possible.
This is an author-deposited version published in: https://sam.ensam.eu Handle ID: .http://hdl.handle.net/10985/20020
This document is available under CC BY license
To cite this version :
Mohamad EL YOUSSEF, Adrien VAN GORP, Stéphane CLENET, Abdelkader BENABOU, Pierre FAVEROLLE, Jean-Claude MIPO - Experimental set up for magnetomechanical measurements with a closed flux path sample - Open Physics - Vol. 18, n°1, p.517-525 - 2020
Any correspondence concerning this service should be sent to the repository Administrator : archiveouverte@ensam.eu
Experimental set up for magneto mechanical
measurements with a closed flux path sample
Mohamad EL YOUSSEF12, Adrien VAN GORP2, Stéphane CLENET1, Abdelkader BENABOU1,Pierre FAVEROLLE3, Jean-Claude MIPO3
1Univ. Lille, Centrale Lille, Arts et Metiers ParisTech, HEI, HeSam, EA 2697 - L2EP – Laboratoire
d’Électrotechnique et d’Électronique de Puissance, F-59000 Lille, France
2Arts & Metiers ParisTech; Mechanics, Surfaces and Materials Processing (MSMP); 8
Boulevard Louis XIV 59046 Lille, France
3Valeo-2 Rue André Charles Boulle, 94000 Créteil, France
Abstract— In this paper, an experimental procedure is presented in order to handle magnetic measurements under uniaxial tensile stress reaching the plastic domain. The main advantage of the proposed procedure is that it does not require an additional magnetic core to close the magnetic flux path through the studied sample. The flux flows only in the sample and no parasitic airgaps are introduced, which avoids the use of H-coil to evaluate the magnetic field, often very sensitive and not easy to calibrate. A specimen of non-oriented (NO) FeSi (1.3%) sheet (M330-35A) is characterized under uniaxial tensile stress. In order to validate the proposed procedure, a comparison with the single sheet tester procedure is carried out. The results obtained by the two procedures are in a good agreement. Moreover, to illustrate the possibilities offered by the proposed procedure, we confirm some results met in the literature. We show that positive plastic strain leads to significant degradation of magnetic behavior. An applied tensile stress on a virgin (un-strained) sample leads to a magnetic behavior degradation. Whereas, on a pre-strained sample, an applied tensile stress results in reducing the deterioration caused by the plastic strain until a stress value called optimum. Above this threshold, the magnetic behavior re-deteriorates progressively.
Keywords— Non-oriented FeSi steel, Magnetic characterization, Tensile stress, Plastic strain.
I. INTRODUCTION
The behavior of ferromagnetic materials depends on their composition but also highly on the mechanical and microstructural properties. It has been clearly shown that the mechanical stress and the plastic strain are one of the most important sources of the degradation of the magnetic behavior [1] [2] [3]. Since manufacturing processes like rolling, punching, bending and annealing modify the mechanical properties [4] [5] [6] [7] [8], they also modify deeply the magnetic behavior of ferromagnetic materials. Compared to the raw material, the characteristics of interest for energy conversion, like the B(H) curves or the iron losses, are almost always degraded. Thus, performances of the electrical machines, e.g. Slinky Stator which is obtained by rolling the lamination continuously, determined during the design stage, are always overestimated. In fact these ones are predicted based on the raw material characteristics without considering the degradation due to the manufacturing processes.
In order to predict more accurately the performances of electrical machines during the design stage, it is necessary to account for the effect of the manufacturing processes. To reach this goal, the relationship between the stress and plastic strain, on the one hand, and magnetic flux density and magnetic field, on the other hand, should be determined. Even if models are available in the literature [9] [10], this relationship is often obtained experimentally. In the literature, different experimental methods have been proposed, which are often based on standard characterization devices (Single Sheet Tester or Epstein Frame). In [11], Authors studied the impact of the plastic strain on the magnetic behavior of FeSi laminations. The magnetic measurement device consists of a ferromagnetic yoke with a primary winding, which is in contact with a pre-strained sample. The flux flowing through the sample is measured by a secondary winding located in the middle of the strained specimen. The same principle of measurement was used later with some improvements in [12]. An opposite ferromagnetic yoke was used in order to reduce the magnetic flux leakage. It leads to better magnetic field distribution in the sample and reduces the eddy currents impact in the sample parts in contact with the yokes. Nevertheless, the impact of parasitic air gap between the yokes and the sample as well as the neglected magnetic field circulation in the yokes leads to non-negligible error on the magnetic field estimation.
In order to avoid the parasitic effect of the air gap between the yoke and the sample, a H-coil probe could be used. It allows a direct measurement of the magnetic field in the air. However, some practical disadvantages have been reported on its use and have prevented the standardization of this method. Also, different devices presented in [13] and [14] enable electromagnetic properties measurements under elastic tension, which is limited and not adequate for our measurement application. In fact we are looking for a device which enables to perform magnetic measurements under elastic and plastic strains.
ferromagnetic material under uniaxial tensile stress reaching the plastic domain, without requiring an external magnetic yoke to close the magnetic flux path. The flux flows only in the sample in order to avoid parasitic airgaps. It enables also avoiding the use of H-coils to evaluate the magnetic field which are often very sensitive and not easy to calibrate. First, we present the proposed characterization device and the associated measurement procedure. Results obtained with the proposed device are compared to those obtained with a SST characterization method for a validation purpose. Then, we present the results of magnetic measurements performed for different tensile stresses and plastic strains.
II. CHARACTERIZATIONPROCEDURE A. Sample geometries
The developed device consists of two coils wound on a sample, which forms a closed magnetic path. Its geometry is quite similar to the window frame specimen that was presented in [15]. However, this new version enables accurate magnetic measurements without using H-coils. Magnetic characteristics are determined from the imposed current and the measured voltage on respectively the primary and the secondary windings (Fig.1). With this sample shape, by applying an external force with a tensile test machine, we expect to have a homogeneous stress and strain in the middle parts (MP). However, the closed parts (CP) should experience the less mechanical stress and strain as possible in order to keep the same characteristics as the raw material in this region. Moreover, in order to limit the effect of the cutting, the water jet process has been used to obtain the sample.
B. Calculation Principle
Regarding the mechanical properties, the stress is obtained by dividing the measured force by the sample cross-section (1). While the strain ε, of the two legs, is measured directly by strain gauges.
=12 (1)
Where, S refers to the section of the sample.
a) Magnetic field and flux density: For the magnetic characterization, the magnetic field H is obtained from the imposed current in the primary winding i (2) (Ampere’s law) and the magnetic flux ∅ is calculated from the measured voltage u (3) at the terminals of the secondary winding (Faraday’s law):
. = . (2)
= − . ∅ (3)
Where l refers the magnetic path length of the magnetic circuit, N1 and N2 refer to the numbers of primary and secondary winding turns. The magnetic flux density B is obtained by:
=∅ (4)
For a virgin sample (no stress-no strain), we assume that the sample is isotropic and has homogenous properties. Thus, for a magnetic flux density B at a fixed frequency, the sample has the same virgin reluctance per unit length all along the flux path. We denote Rv the reluctance per unit length. First of all, magnetic measurements are performed on the virgin sample (ie under no stress). We calculate the Rv from the current i and the magnetic flux ∅ according to the following expression:
= ∅.. (5)
Once we have the reluctance per unit length of the virgin material (Rv) in function of the magnetic flux and frequency, it is then possible to estimate the reluctance per unit length in the MP (Rdi) corresponding to the sample for a mechanical state di, which corresponds to a given stress and plastic strain levels. In fact, we assume that the reluctances of the CPs remain unchanged and are equal to Rv. In Fig.2, we
present the magnetic circuit corresponding to the sample, before and during test, representing a mechanical state di. The magnetic field and the magnetic flux density in the investigated MPs are then determined according to the following calculation:
. = 2 . ∅. 2 . ∅. (6)
= . − 2 . ∅. /2. ∅. (7)
= . ∅ (8)
=∅ (9)
Fig.1: The dimensions of the specimen’s geometry (mm) and the corresponding input and output signals required for magnetic and mechanical characterization
b) Total losses: The total losses in function of the magnetic flux density and the frequency for the virgin material are calculated first from the following equation:
=1 . . . (10)
=
(11)We apply again a similar procedure as the one applied to determine the B(H) curve proposed above. The total losses in the CPs are assumed, for given levels of magnetic flux and frequency, to remain unchanged when applying the tensile force. The change in the measured losses is associated to the MPs, which are deformed. Thus, the associated losses in the MPs per unit length can be calculated by:
=
−
2 !.
2 ! (12)Where WT are the total losses in the sample calculated by (10) when the current i and the voltage u are measured under stress.
III. VALIDATION
In order to verify the validity of the proposed approach, and particularly to check the assumptions made previously for the determination of the B(H) and loss curves associated to a sample subjected to stress, we have made some validation tests. Before carrying out any magneto-mechanical measurements, the processes of measuring the mechanical and magnetic characteristics have been checked independently.
A. Mechanical aspect
The verification of the mechanical hypotheses requires taking into consideration several points. Firstly, let us consider the hypothesis of having non-deformed zones in the CPs in order to consider that there is no modification of the reluctance in that area during the magneto mechanical characterization. To validate this assumption, the mechanical problem is simulated using a 2D FE model with Abaqus. The problem consists in a full constrained side of the sample while the other side is under displacement in the x direction. The displacement value is equal to 2mm. Also, the impact of strain rate is neglected, thus the velocity of the displacement is not considered (Fig. 3a).
In Fig. 3b, we present the distribution of the stress in the principle direction (x) and the plastic equivalent strain overall the sample. Results show that the stress and the plastic strain are almost homogeneous throughout the MPs, which is needed in this region of interest. We can notice that the stress is negligible (below 3MPa) in the middle of the CP (blue area in Fig. 3b). Thus the magnetic properties of this area are not modified during the tensile test. At the extremities of the CP, we can see a stress field with a maximum level (230MPa) below the one in the MPs (300MPa) while the plastic strain distribution in these square regions is well localized at their diagonals. This will lead to magnetic properties degradation and will generate error on the magnetic field estimation. Thus, error should be quantified. We have to not the stress distribution in the others direction are negligible.
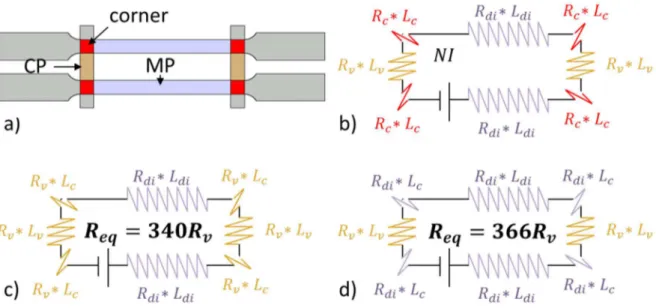
In order to estimate the generated error on magnetic field, we have separated the corners areas from the CPs (Fig. 4a). The magnetic circuit of the sample considering the corners reluctance is than presented in (Fig. 4b). Two extremum cases could be considered. The first case appears in Fig. 4c which represents our assumption. The reluctance at the corner is equal to the CPs one. The second one is presented in Fig. 4d. The reluctance at the corner is equal to the MPs one.
We will assume that the stress magnitude in the corners is equal to the stress in the MPs with an intensity level equals to the yield stress (240 MPa). Based on the results presented in [16], the maximal permeability of raw material is two times higher than the permeability at yield stress. Since permeability is proportional to the reluctance, the reluctance at yield stress is two times higher the one of the raw material. Thus, the equivalent reluctance of the magnetic circuits are then; 340Rv in the first case and 366Rv in the second one. The real equivalent reluctance is in between. Consequently, if we consider that the magnetic properties in the CP regions are not modified during the tensile test, we can guarantee an error over the magnetic field less than 8%.
Fig. 3: a) Schematic of the applied boundary conditions, b) The stress and equivalent plastic strain distribution for an applied force using finite element method.
Fig. 4: Equivalent magnetic circuits of the sample, a) Rv <Rc< Rdi b) Rc= Rv, d) Rc= Rdi
B. Magnetic aspect
In order to evaluate the accuracy of the magnetic measurements, the device is compared to a standardized characterization method. As the sample width is quite small (5mm) the impact of the cutting method could be more pronounced than for a regular SST sample where the size of the sample, in our case, is 200mm x 50mm. Thus, some degradation should be expected. In order to evaluate this degradation due to the cutting technique, a set of 10 strips of 5mm (the width of the MPs), cut by water jet and joint together, are characterized with the SST device on a Brockhaus MPG200D equipment. If the cutting process has no effect, the two B(H) curves obtained
with the 10 strips and with the reference sample should be the same. In Fig.5, three normal curves have been superposed:
• -the one corresponding to the sample characterized by the developed device
• -the one obtained on the 10 strips with the SST
• -the one obtained on the reference sample with the SST
When we compare the two samples characterized with the SST, we can notice a degradation introduced by the cutting. However, the normal curve resulting from the developed device is in good agreement with the set of strips characterized by the SST. It means that our device enables to characterize the B(H) curve in an equivalent way as a SST. Furthermore, in order to evaluate the procedure of reconstructing the B(H) curve under deformation as presented in section II, we have deformed three samples according to the following plastic strain 0.45%, 0.75% and 1.75%, then, we have measured for each of them the B(H) curve using the SST. Beside, we have, for almost the same plastic strain, measured the B(H) curves on our device applying the proposed procedure. We compare in Fig.6 the normal curves obtained for both characterization methods and for the three plastic strain levels. We can notice that the normal curves are almost superposed for the 3 plastic strains. So, we can consider that the proposed procedure enables to measure B(H) under axial stress.
Fig.5: Comparison of the normal curve obtained by the proposed device with the normal curves obtained
by SST
Fig.6: Comparison between normal curves of samples deformed by tensile test characterized by
the proposed device (dashed lines) and a SST (continuous lines).
IV. IMPACTOFMECHANICALCHARACTERISTICSONTHEMAGNETICPROPERTIES In this part, we present the magnetic measurement performed under different mechanical states di (a given stress and plastic strain values) using the developed experimental device.
A. Methodology
In order to reach different mechanical states, we have applied almost the same principle of the method used in [12]. A cyclic loading is applied; each cycle is represented by four states. The loaded one, illustrated by the “State 1” label in Fig.7, is represented by the sample that is submitted to an increasing tensile stress in the elastic domain. During this step, for each magnetic measurement, the deformation is kept constant which implies a constant loading stress. Since measurements are carried out for different magneto-motive forces at different frequencies, the period of magnetic characterization, for a given stress and plastic strain, is around 25 minutes. Thus the relaxation phenomenon is considered negligible in the elastic domain. The next state, “State 2”, is performed in the elasto-plastic domain. It consists in applying an increasing force in order to reach a well-defined total strain. Then, in “State 3” we maintain the deformation. In the plastic domain the relaxation stress cannot be ignored. Thus, we wait 20min, an estimated duration to get a stabilized stress, before the magnetic characterization. Finally, the “State 4” consists in a progressive unloading until we have no applied stress on the sample. This entire experimental protocol is repeated for other plastic strain states. We can note that the magnetic characterization is performed at 50Hz with an applied magnetic field that reaches around 4500A/m. The mechanical measurements are performed with stresses between [0-185] MPa and plastic strain values up to
F lu x d e n s it y ( T )
3%.
Fig.7: The experimental procedure for mechanical stress application.
B. Magnetic behavior of pre-strained specimens under elastic stresses
In the previous section, we have presented the considered procedure to span different mechanical states corresponding to a given tensile stress and plastic strain εp. Magnetic measurements are carried out at different
mechanical states. As example, we present in Fig.8a, the required magnetic field, to reach a magnetic flux density of 1T at 50Hz in function of the mechanical state. Focusing on the plastic strain, we note that the required magnetic field is increasing with plastic strain εp. We can also see that the degradation is more
pronounced for low plastic strain levels. In Fig.8b, we present the evolution of the magnetic field’s gradient over the plastic strain; we notice that its value at 0.5% εp (~94%) is much higher than the gradient value (~3%) at
3.3% εp.
Also, we can denote that the magnetic behavior under plastic strain cases in the unload state is more degraded than those under tensile load. In order to reach the same flux density level, a higher magnetic field level is required. The evolution of the required magnetic field with the applied stress is in accordance with the observations made by Iordache [12]. We notice that the magnetic behavior improves, when a tensile stress is applied, up to a limit stress level corresponding to a minimal required magnetic field. Beyond this level, the magnetic behavior deteriorates gradually again (Fig.9a). Also, we notice that the optimal stress level increases with the plastic strain level (Fig.9b). For a 0.37% plastic strain, the optimal stress is around 71 MPa, whereas for a 3.3% plastic strain it is around 157MPa. We can conclude that this optimal stress value is a function of the plastic strain.
Fig.8:a) Evolution of the required magnetic field, to reach a flux density level of 1T, with the stress for a frequency of 50 Hz, b) the evolution of the magnetic field’s gradient.
"
%$
%
&'( )*+ ,0
5
10
15
20
/ 0 * 23 / 0 * 43$
$
5 / 0 * 63 / 0 * 73 / 0 * 2852 / 0 * 4852 / 0 * 685 2 / 0 * 785 2$
9Fig.9: a) The evolution of the required magnetic field, to reach a flux density level of 1T, with the stress for a frequency of 50 Hz, b) the evolution of optimal stress with plastic strain.
V. CONCLUSION
This work presents, firstly, a new experimental procedure allowing magneto mechanical measurements on electrical steel strip samples under an applied uniaxial (tensile) stress approaching and exceeding the macroscopic elastic limit. The principle consists in characterizing a sample, with closed magnetic path and without parasitic air-gap, based on the flux-metric method using two winding coils (primary and secondary). The device has been developed with the capacity to measure the magnetic hysteresis loops under any magnetic field waveform. The comparison of the measurements with those obtained on a standard SST shows that the proposed device ensures a good reliability and accuracy of the measurements.
Secondly, an in situ experimental investigation of a NO FeSi sheet (M330-35A) is reported. Several conclusions can be drawn: a slight applied tensile stress, on a pre-strained material, in the unloaded case (stress=zero) the magnetic properties are more deteriorated than in the loaded one. In that case, a tensile stress reduces the deterioration of magnetic behavior performed by the plastic strain until an optimum stress value. Beyond this, the behavior tends to re-deteriorate gradually. We have extracted from the measurement the optimal stress in function of the plastic strain to be applied which enables to optimize the magnetic characteristics.
REFERENCES
[1] N. Leuning, S. Steentjes, M. Schulte, W. Bleck, et K. Hameyer, « Effect of elastic and plastic tensile mechanical loading on the magnetic properties of NGO electrical steel », J. Magn. Magn. Mater., vol. 417, p. 42‑48, nov. 2016.
[2] E. Hug, O. Hubert, et J. J. Van Houtte, « Effect of internal stresses on the magnetic properties of non-oriented Fe–3wt.% Si and (Fe, Co)–2wt.% V alloys », Mater. Sci. Eng. A, vol. 332, no 1, p. 193–202, 2002.
[3] J. M. Makar et B. K. Tanner, « The effect of plastic deformation and residual stress on the permeability and magnetostriction of steels », J. Magn. Magn. Mater., vol. 222, no 3, p. 291‑304, déc. 2000.
[4] M. El Youssef, A. Van Gorp, S. Clenet, A. Benabou, P. Faverolle, J.-C. Mipo, Y. Lavalley, C. Cour, et T. Lecuppe, « Slinky stator: The impact of manufacturing process on the magnetic properties », présenté à IEEE International Electric Machines & Drives Conference (IEMDC), 2017, p. 1‑8.
[5] M. F. de Campos, M. J. Sablik, F. J. G. Landgraf, T. K. Hirsch, R. Machado, R. Magnabosco, C. J. Gutierrez, et A. Bandyopadhyay, « Effect of rolling on the residual stresses and magnetic properties of a 0.5% Si electrical steel », J. Magn. Magn. Mater., vol. 320, no 14, p. e377‑e380, juill. 2008.
[6] H. A. Weiss, N. Leuning, S. Steentjes, K. Hameyer, T. Andorfer, S. Jenner, et W. Volk, « Influence of shear cutting parameters on the electromagnetic properties of non-oriented electrical steel sheets », J. Magn. Magn. Mater., vol. 421, p. 250‑259, janv. 2017.
[7] W. Wu, H. Cao, H. Ou, Z. Chen, X. Zhang, Z. Luo, S. Chen, et R. Li, « Effects of punching process on crystal orientations, magnetic and mechanical properties in non-oriented silicon steel », J. Magn. Magn. Mater., vol. 444, p. 211‑217, déc. 2017.
[8] M. E. Youssef, A. Benabou, T. Coorevits, A. Van Gorp, S. Clenet, P. Faverolle, J.-C. Mipo, Y. Lavalley, et T. Lecuppe, « Punching effect directly on electrical machine stator strips », Int. J. Appl. Electromagn. Mech., p. S1‑S8, juin 2019.
[9] O. Hubert et S. Lazreg, « Two phase modeling of the influence of plastic strain on the magnetic and magnetostrictive behaviors of ferromagnetic materials », J. Magn. Magn. Mater., vol. 424, p. 421‑442, févr. 2017.
[10] O. Hubert et L. Daniel, « Multiscale modeling of the magneto-mechanical behavior of grain-oriented silicon steels », J. Magn.
Magn. Mater., vol. 320, no 7, p. 1412‑1422, avr. 2008.
[11] E. Hug, O. Hubert, et M. Clavel, « Some aspects of the magnetomechanical coupling in the strengthening of nonoriented and grain-oriented 3% sife alloys », Magn. IEEE Trans. On, vol. 33, no 1, p. 763–771, 1997.
[12] V. E. Iordache, F. Ossart, et E. Hug, « Magnetic characterisation of elastically and plastically tensile strained non-oriented Fe– 3.2% Si steel », J. Magn. Magn. Mater., vol. 254, p. 57–59, 2003.
[13] M. Rekik, O. Hubert, L. Daniel, B. Raka, P. Mella, et P. Aimedieu, « Dispositif de mesure du comportement magnéto-mécanique d’un alliage de fer-silicium sous chargement mécanique multiaxial », in Congrès Français de Mécanique 2013, 2013.
[14] O. Perevertov, « Influence of the applied elastic tensile and compressive stress on the hysteresis curves of Fe-3%Si non-oriented steel », J. Magn. Magn. Mater., vol. 428, p. 223‑228, avr. 2017.
[15] O. Stupakov, J. Pal’a, I. Tomáš, J. Bydžovský, et V. Novák, « Investigation of magnetic response to plastic deformation of low-carbon steel », Mater. Sci. Eng. A, vol. 462, no 1‑2, p. 351‑354, juill. 2007.
[16] V. E. Iordache, E. Hug, et N. Buiron, « Magnetic behaviour versus tensile deformation mechanisms in a non-oriented Fe–(3 wt.%)Si steel », Mater. Sci. Eng. A, vol. 359, no 1‑2, p. 62‑74, oct. 2003.