Science Arts & Métiers (SAM)
is an open access repository that collects the work of Arts et Métiers Institute of
Technology researchers and makes it freely available over the web where possible.
This is an author-deposited version published in:
https://sam.ensam.eu
Handle ID: .
http://hdl.handle.net/10985/17647
To cite this version :
Nan KANG, Mohamed EL MANSORI, Fabrice GUITTONNEAU, Hanlin LIAO, Y. FU, E. AUBRY
-Controllable mesostructure, magnetic properties of soft magnetic Fe-Ni-Si by using selective laser
melting from nickel coated high silicon steel powder - Applied Surface Science - Vol. 455,
p.736-741 - 2018
Any correspondence concerning this service should be sent to the repository
Administrator :
archiveouverte@ensam.eu
Controllable mesostructure, magnetic properties of soft magnetic Fe-Ni-Si by
using selective laser melting from nickel coated high silicon steel powder
N. Kang
a,e,⁎, M. El Mansori
a, F. Guittonneau
a, H. Liao
b, Y. Fu
c, E. Aubry
d aMSMP Laboratory, EA-7350, Arts et Métiers ParisTech, Aix-en-Provence, FrancebICB UMR 6303, CNRS, Univ. Bourgogne Franche-Comté, UTBM, F-90010 Belfort, France cDepartment of Materials Science and Engineering, Dalian Maritime University, 116026 Dalian, China dNipson Technology, Al des Marronniers, 90000 Belfort, France
eState Key Laboratory of Solidification Processing, Key Laboratory of Metal High Performance Additive Manufacturing and Innovative Design, MIIT china, Northwestern
Polytechnical University, Xi’an 710072, PR China
Keywords:
Additive manufacturing Selective laser melting Soft magnetic materials Anisotropic mesostructure
A B S T R A C T
Fe-Ni-Si soft magnetic parts, using Ni coated high silicon steel powder, were manufactured by selective laser melting process. The type of defect changes from porosity to cracks and the relative density increases, from 50% to 99%, with the decreasing laser scanning speed. The microstructural analyses indicate that the low laser scanning speed fully melted the nickel coating and high-silicon steel core. The EBSD study showed that the separated island and lamellar mesostructures appeared on the top and side view respectively. Moreover, no apparent texture were observed. The magnetization saturation of SLM processed sample decreased, as the laser scanning speed was increased. Consequently, the magnetic properties of SLM processed Fe-Ni-Si alloy also showed anisotropic feature in building and scanning directions, which can be attributed to their different me-sostructure.
1. Introduction
Selective laser melting (SLM), a powder-bed additive manufacturing (AM) process, is relatively a new near net-shaped AM process with high dimensional producing accuracy. In this process, the 3D computer-aided design (CAD) model is created and then virtually sliced into thin layers with typical (from several micrometers to hundreds micrometers) layer thickness. The component is built layer by layer with a controlled high energy laser beam from the powder feedstock[1–3]. As one kind of material processing technology, the parameter-defect-microstructure relation during SLM plays a vital role in the extended potential appli-cations. Kasperovich et al. [4] investigated the correlation between porosity and processing parameters in SLM processed TiAl6V4 and in-dicates that the defect can be defined as two dominant types based in the energy density. In general, the laser input energy density could be controlled by process parameters such as laser power scanning speed, layer thickness, and so forth. Moreover, Qi et al.[5]reported that the defocusing distance has a significant effect on the melting mode, which presents nonnegligible influence on the microstructural and mechanical properties. Furthermore, the solidification behavior during SLM process was studied by Acharya et al.[6]with the IN718 powder and concluded that the dimension and temperature gradient in the molten pool affect
the microstructural and mechanical properties of the SLM processed components.
Given to its high permeability, low coercivity, and low hysteresis loss, the soft ferromagnetic material is usually used to amplify theflux density generated by a magneticfield[7]. For example, the silicon steel presents superior soft magnetic properties, which is suitable to produce the iron core of the motors [8]. Conventionally, the silicon steel is prepared into a sheet by using several cold and hot rolling followed by annealing to get oriented grains with the Goss texture (cube-on-edge) obtaining low magnetic loss and then machined to the desirable form
[9]. The magnetic properties, such as magnetostriction, suppresses magneto-crystalline anisotropy, and so forth., could be improved by high silicon content, which is favor of high performance soft magnetic materials. In contrast, the ductility of silicon steel decreases sig-nificantly as the silicon content increases, for eg. Fe-6.5 wt% Si with near zero ductility. Thus, it significantly limits its potential application due to the small machining process window[10]. Up to now, the high silicon steel (over 3 wt%) could be manufactured by melt spinning
[11,12], chemical vapor deposition [13], spraying forming [14]and thermal spraying[15]. However, all of these technologies show lim-itations on the production of any complex component. Considering the structure of silicon steel sheet, the layer by layer manufacturing, AM,
⁎Corresponding author at: MSMP-Arts et Métiers Paristech, 2, Cours des Arts et Métiers, 13617 Aix-en-Provence, France.
E-mail address:nan.kang@ensam.eu(N. Kang).
could be an efficient net-shaped process for the high-silicon steel. Re-cently, Garibaldi et al.[16–18]have investigated the SLM processed high silicon steel and indicated that this process could be one of the promising methods to manufacture the soft magnetic component with complex morphology. Additionally, Zhang et al. [19]did the para-metrical analysis with the SLM processed Fe-Ni alloys for obtaining high relative density component. Fe-Ni intermetallics, such as FeNi3,
are considered as another essential soft magnetic material. The ternary Fe-Ni-Si soft magnetic parts[20–22]were manufactured by SLM using nickel coated high silicon steel powder. The coated commercial powder combines the advantages of chemical homogeneity and low cost, compared with the pre-alloyed powder and powder mixture.
2. Experimental
The cubic samples, 8 × 8 × 8 mm3, were produced using an MCP-realizer SLM 250 equipment (MCP-HEK Tooling GmbH, Germany) equipped with an Nd-YAGfiber laser with a spot size of 40 µm and maximum power of 400 W. This system employs a hopper of feedstock
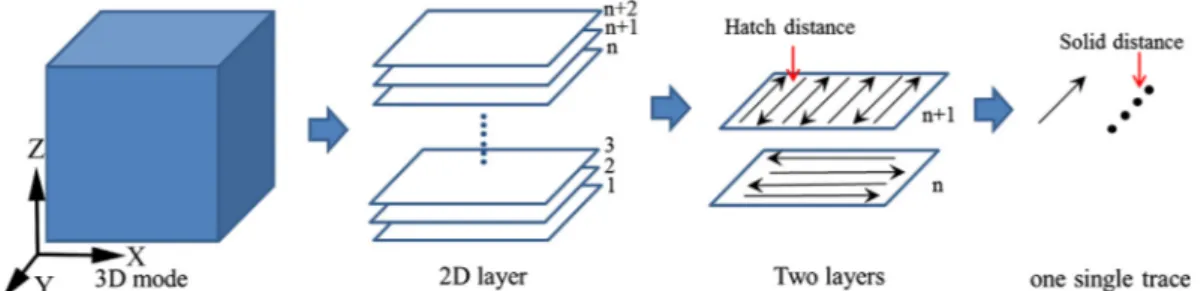
powder. In order to obtain high production efficiency and controllable mesostructure, the laser power, hatch distance, and layer thickness werefixed at 300 W, 120 μm and 50 μm respectively. Laser scanning speed ranged from 0.5 to 6 m/s. The laser path rotation between two adjacent layers was 90°. The building processing and scanning mode are shown inFig. 1. It can be seen that the cubic sample consists of layers with a thickness of 50μm, and laser scanning realizes each layer with hatch distance of 120μm. Moreover, the laser discontinuous moved with solid distance of 120μm during the laser melting process. Thus, the scanning speed was controlled by the exposure time from the equation:
=
v Solid distance
exposure time
2.1. Materials characterization
The relative density was measured by an image analysis method. The phases of SLM processed samples were characterized by X-ray Fig. 1. Building processing and scanning mode of SLM process (Z: building direction (BD), X: scanning direction (SDX), Y: scanning direction (SDY)).
diffraction with scanning speed about of 1°/min. The microstructure was studied by a Scanning Electron Microscope (SEM JEOL-5900 LV, Japan) equipped with X-ray energy dispersive spectroscopy (EDS). Electron backscattered diffraction (EBSD) analyses were performed on a JEOL JSM-7001F fitted with an HKL Nordlys camera from Oxford Instruments and controlled by CHANNEL5 software suite, as Flamenco for acquisition. The two maps were acquired at 20 kV, probe current 16 (a.u.), magnification ×100, working distance 20 mm, camera gain low, binning 4 × 4 pixels, averaging six images, Hough resolution 70, step size 1.7 µm, grid size 700 × 500 points. Maps were extrapolated at the
five neighbors’ level in Tango; inverse pole figures were constructed in Mambo software. The magnetic measurements were performed by using a hysteresimeter Bull M2000/2010, which allowed to measure coercivity and saturation magnetization. The magnetic properties were measured from three different directions, X, Y, and Z (see inFig. 1). 2.2. Powder characterizations
The high-silicon steel powder (0.5Ni6.5Si93.0Fe wt.%) was pre-pared by gas atomization and then coated pure nickel by using hy-drometallurgy (Institute of Process Engineering, Chinese Academy of Sciences). FromFig. 2(a), it can be seen that the nickel coated high silicon steel powder presents particulate morphologies in two types: (1) smooth surface (irregular form) (2) rough surface (spherical form). Furthermore, the microstructures of powder cross section are illustrated inFig. 2(b). It can be observed that the particle with smooth surface is formed by a group of small high silicon steel powders and then covered by nickel. The rough surface appears on the large spherical high-silicon steel particle. Image with high magnification of Ni-coated large high silicon steel powder is shown inFig. 2(c). No clear diffusion layer was
observed from the cross section microstructure (Fig. 2(b and c)). Due to the Ni content fluctuation for each particle, the nickel content was measured by image analysis for around hundreds of particles from three picture of powder bed, which is average about of 43 ( ± 5) wt. %. The measured error is the average of variance from 3 pictures. The laser diffraction particle size test indicated the powder presented a mean size of about 57μm with a normal distribution (see inFig. 2(d)).
3. Results and discussion 3.1. Densification and phase analysis
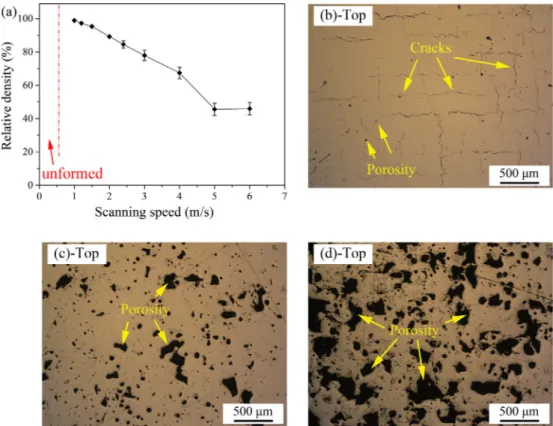
The relative density of sample prepared with several laser scanning speeds ranged from 0.5 to 6 m/s is shown inFig. 3(a). For the sample obtained at laser scanning speed of 0.5 m/s, due to the high input Fig. 3. (a) The relative density of SLM processed Fe-Ni-Si alloys and defects morphologies of SLM processed sample at laser scanning speed of (b) 1 m/s, (c) 2 m/s and (d) 4 m/s.
Fig. 4. XRD patterns of SLM processed Fe-Ni-Si alloys at several laser scanning speeds (1.2 and 4.0 m/s) and several cross-sections (top and side view).
energy and fragile mechanical properties, the cubic sample cannot be prepared successfully. The sample processed at laser scanning speed of 1 m/s presents the highest relative density about of 99%. As the laser scanning speed increases from 1 to 6 m/s, the relative density con-tinually decreases from 99% to 50%, which is similar to the work of Qiu et al.[23]in case of SLM processed invar alloys. Moreover, the OM images corresponding to SLM processed samples in laser scanning speed of 1, 2, and 4 m/s are shown inFig. 3(b–d). The cracks appear in the sample fabricated at low scanning speed (see inFig. 3(b)), causing low
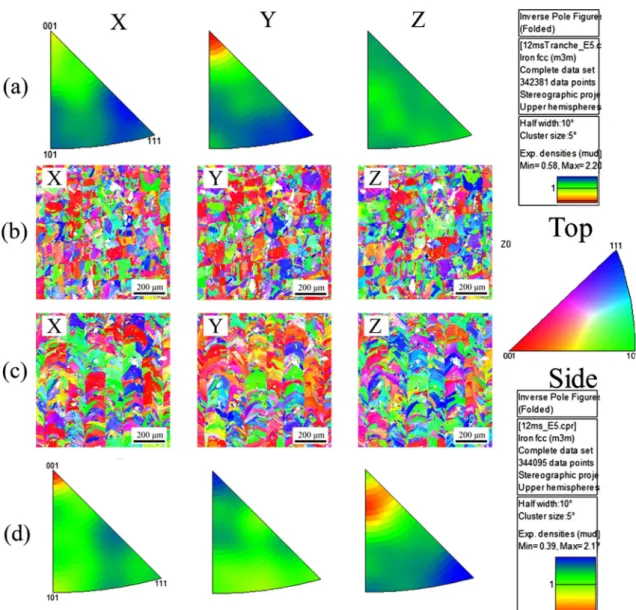
ductility of high-silicon steel and high energy input. The similar result is also reported by Garibaldi et al.[17], indicated that the high energy input causes the low cooling rate of the molten pool. Moreover, in SLM process, the thermal gradient in the molten pool also acts as a source for crack during the solidification[5]. As the laser scanning speed rises, the large irregular porosity appears instead of micro-crack. According to the report of Kasperovich et al.[4], the high laser scanning speed (low energy density) leads to large irregular porosity due to insufficient energy input. Moreover, the cracks can be observed at the interfacial Fig. 5. (a, d) Inverse polefigures and (b, c) EBSD orientation maps of SLM processed Fe-Ni-Si alloy from side and top views respectively in the three directions.
Fig. 6. The microstructures (after etching) of SLM processed Fe-Ni-Si alloys at laser scanning speed 1.2 m/s of (a) side and (b) top cross-sec-tions. (yellow line: molten pool boundary; red line: lamellar austenite interfaces). (For inter-pretation of the references to colour in thisfigure legend, the reader is referred to the web version of this article.)
regions between rod-like structures, which can be attributed to the weak bonding strength between laser tracks.
The XRD patterns of SLM processed Fe-Ni-Si alloys are shown in
Fig. 4. The sample manufactured at high scanning speed (4.0 m/s) presents a phase mixture, composed of fccγ (Fe, Ni), bcc α (Fe, Ni) and nickel phase. Qiu et al.[23]reported the appearance of fccγ (Fe, Ni) and bccα (Fe, Ni) in case of SLM processed invar alloy as the result of rapid solidification of SLM process. In this study, the Fe and Ni pos-sessed the similar composition ratio. Thus, bothγ (Fe, Ni) and α (Fe, Ni) appeared in the SLM sample at high laser scanning speed. As the laser scanning speed decreased to 1.2 m/s, the partial melted Ni coating was fully melted, and only fccγ (Fe, Ni) was observed in XRD pattern due to the decreased cooling rate[20,21]. On the other hand, the XRD patterns from the top and side views of SLM processed dense sample (1.2 m/s) are also illustrated inFig. 4. From the point view of phase composition, the two sides present the same fccγ (Fe, Ni) phase. However, the in-tensity of phase’s peak is different, in details, the intensity ratio
between (1 1 1) plane and (2 0 0) plane of top view is higher than that of the side view. It indicates that the preferred orientation ofγ (Fe, Ni)-(1 1 1) plane of top-section is slightly stronger than that of side-section. A further EBSD analysis is shown inFig. 5.
3.2. Microstructure
During the SLM process, the surroundings, for example, the thermal conductivity of powder and solidified material near the molten pool, affects the temperature gradient significantly. Therefore, the heat conduction in building direction is higher than that of spatial direc-tions. It causes anisotropy in both microstructure and mechanical/ physical properties. The EBSD images and analysis results from both side and top views in consideration of industrial requirement (speed 1.2 m/s) are shown inFig. 5. Fig. 5(b) and (c) represent orientation maps of“inverse pole figure” type, whileFig. 5(a) and (d) represents inverse pole figures, with a stereographic projection. The top view EBSD maps present the island microstructure weaved by laser scanning in X and Y directions,Fig. 5(b). Each square has a side length of 120μm, which correspond to the hatch distance during SLM process. The EBSD maps of side view indicate a lath-shaped microstructure parallel to the BD with a bandwidth of 120μm, which well corresponds to the hatch distance, too (see inFig. 5(c)).
Random colors in orientation maps and very low maximum den-sities (∼2.2 mud) in IPF for both top and side views indicate the ab-sence of texture in the material. Also, grain boundaries are random, and no particular boundary (like coincidence site lattice, CSL, e.g.,Σ3) had been created during the process. On the grain shape, the grains viewed from the top appear much more round or square (low ratio between high diameter and small diameter of thefitted ellipse) while the grains seen from the side seem much more elongated (higher ratio between high diameter and small diameter of thefitted ellipse). On the grain size (considering a grain diameter > 6 µm, i.e., 10 pixels, and a grain boundary threshold of 5°), for top view d=14.8 m,μ σ = 12.3 µm,
N = 3274, Max = 137 µm; for side view d =15.9 m,μ σ = 13.9 µm,
N = 2750, Max = 157 µm. Finally, kernel average misorientation (KAM) values for a 7 × 7 size grid are low in the two measurements (peak center at about 0.7°) which indicate the material is not deformed. The chemical etched (Nital) microstructure of SLM processed dense part from the side, and top views are shown in Fig. 6. From both images, it can be observed a mixed structure consists of cellular aus-tenite and lamellar ausaus-tenite. The cellular ausaus-tenite appears mainly in the central region of the molten pool due to the low cooling rate without distinct thermal gradient. In contrast, the lamellar austenite can be observed near the boundary of the molten pool with grow di-rection to center[24], which can be attributed to the higher thermal conductivity of dense previous fabricated layer than that of meal liquid and powder. Moreover, the interface between the lamellar austenite of two contacted molten pools, which is indicated by the red line, is the high-angled grain boundary. As shown inFig. 6(a), their accumulations by side view lead to the formation of lamellar structure. Meanwhile, the island structure in EBSD, which can be seenFig. 5, is the result of top view accumulation (see inFig. 6(b) by the red line).
3.3. Magnetic properties
The average values of magnetization saturation (Ms), residual magnetization (Mr) and coercivity (Hc) of SLM processed Fe-Ni-Si with laser scanning speed of 1.2 m/s, 2 m/s, and 4 m/s are summarized in
Table 1. Meanwhile, the ratios between Ms and Mr, which presents the soft magnetic properties, were also calculated and shown as S in
Table 1. Firstly, it can be observed that the soft magnetic properties (S) of SLM processed sample gradually become worse, as the laser scanning speed increases from 1.2 m/s to 4 m/s. This trend can be attributed to two factors: (1) macro-structural effect and (2) crystallography effect. Moreover, Ms is defined as magnetization saturation per gram, that is to Table 1
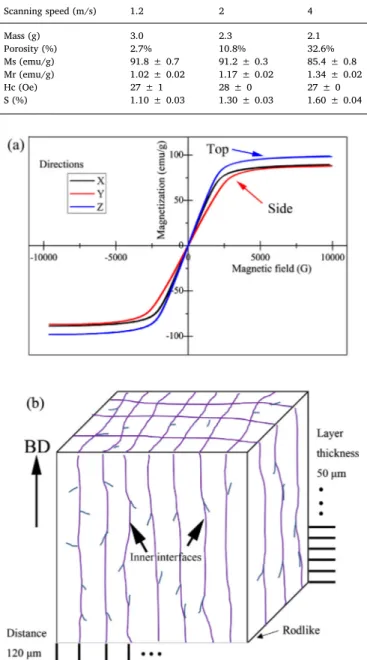
Magnetic properties of SLM processed Fe-Ni-Si alloys at laser scanning speed of 1.2 m/s, 2 m/s and 4 m/s. Scanning speed (m/s) 1.2 2 4 Mass (g) 3.0 2.3 2.1 Porosity (%) 2.7% 10.8% 32.6% Ms (emu/g) 91.8 ± 0.7 91.2 ± 0.3 85.4 ± 0.8 Mr (emu/g) 1.02 ± 0.02 1.17 ± 0.02 1.34 ± 0.02 Hc (Oe) 27 ± 1 28 ± 0 27 ± 0 S (%) 1.10 ± 0.03 1.30 ± 0.03 1.60 ± 0.04
Fig. 7. (a) Series of hysteresis loops of SLM processed Fe-Ni-Si alloys with laser scanning speed and (b) the schematic illustration of mesostructure.
say, the effect of relative density was eliminated. However, the ap-pearance of pores influences the microstructure of SLM processed sample. Igarashi et al.[25]investigated the effect of porosity on mag-netic properties and reported that the demagnetization is proportion to the porosity. For the second factor, in general, Ms of the magnetic material decreases as the grain size decreases[25]. In SLM process, the higher laser scanning speed (low energy input), the smaller molten pool with the results of higher cooling rate[26]. So the sample prepared at high scanning speed tends to possess ultra-fine or metastable micro-structure, which presents small Ms. Additionally, the unmelted nickel coating in the sample obtained at high laser scanning speed also causes a decrement of Ms. Lastly, fromTable 1, it can be seen that the coer-civity is independent of laser scanning speed. According to the work of Igarashi et al.[25], the porosity illustrates no influence on coercivity.
Unfortunately, the reasons for stable coercivity of SLM processed Fe-Ni-Si alloys are not precise and more work will be performed in the future. On the other hand, the hysteresis loops of SLM processed dense Fe-Ni-Si sample (1.2 m/s) along three different directions X and Y (scan-ning direction) and Z (build direction), Fig. 7, which illustrates the anisotropic magnetic properties in different measured directions. For instance, the Ms in Z direction is higher than that of X and Y directions. In general, to reduce the induced eddy current, the silicon steel is manufactured in the form of a sheet. In this work, as shown inFig. 5(b), the SLM processed Fe-Ni-Si sample presents an in-situ lamellar micro-structure from the side views and island micromicro-structure from the top view. Therefore, the 3D structure of SLM processed sample can be schematically illustrated inFig. 7(b). In general, a very common mag-netizing direction is the axis of the part[27]. Due to this anisotropic structure of SLM processed sample, consequently, the magnetic prop-erties present also anisotropic feature. On the other hand, as shown in
Fig. 5, no texture can be determined in the SLM processed sample. Furthermore, the porosity/crack distribution, ordering in the micro-structure and residual stress distribution [28] have influence on mag-netic properties. This work proposed that the rod-like mesostructured may be another important factor on the anisotropic magnetic proper-ties. Unfortunately, the synergistic effect of those factor is still an open question. Plus work will be carried out to investigate the effect of each factor on magnetic properties. Additionally, during the SLM process, the rod-like mesostructure can be successfully controlled by process parameters, e.g., hatch distance. So, the in-situ formation of the sepa-rated structure by SLM with desirable mesostructure could be an ef-fective way to produce the soft magnetic Fe-Ni-Si system.
4. Conclusion
The dense Fe-Ni-Si soft magnetic alloy was manufactured by SLM process from nickel coated high silicon steel powder.
(1) With the increment of energy input, the porosity can be nearly eliminated. However, the cracks appear in the low porosity sample due to the low ductility of Fe-Ni-Si alloys.
(2) Only the fccγ(Fe, Ni) can be observed in XRD pattern of the SLM processed sample with laser scanning speed of 1.2 m/s. Moreover, the dense part presents a separated lamellar microstructure with low texture content from the side view.
(3) This in-situ manufactured rod-like structure could be an important reason for the anisotropic magnetic properties in XOY and XOZ/ YOZ sections, which should be considered as an essential factor in the design of soft magnetic component with complex morphology. (4) In general, the magnetization saturation presents a negative cor-relation with laser scanning speed, which can be attributed to macro-structure and crystallography. As the laser scanning speed
increases from 1 to 4 m/s, the coercivity remains constant about 27 Oe.
References
[1] D. Gu, C. Ma, M. Xia, D. Dai, Q. Shi, A multiscale understanding of the thermo-dynamic and kinetic mechanisms of laser additive manufacturing, Engineering 3 (2017) 675–684.
[2] P. Wei, Z. Wei, Z. Chen, J. Du, Y. He, J. Li, Y. Zhou, The AlSi10Mg samples produced by selective laser melting: single track, densification, microstructure and mechan-ical behavior, Appl. Surf. Sci. 408 (2017) 38–50.
[3] N. Kang, P. Coddet, H. Liao, T. Baur, C. Coddet, Wear behavior and microstructure of hypereutectic Al-Si alloys prepared by selective laser melting, Appl. Surf. Sci. 378 (2016) 142–149.
[4] G. Kasperovich, J. Haubrich, J. Gussone, G. Requena, Correlation between porosity and processing parameters in TiAl6V4produced by selective laser melting, Mater. Des. 105 (2016) 160–170.
[5] T. Qi, H. Zhu, H. Zhang, J. Yin, L. Ke, X. Zeng, Selective laser melting of Al7050 powder: melting mode transition and comparison of the characteristics between the keyhole and conduction mode, Mater. Des. 135 (2017) 257–266.
[6] R. Acharya, J.A. Sharon, A. Staroselsky, Prediction of microstructure in laser powder bed fusion process, Acta Mater. 124 (2017) 360–371.
[7] S. Chikazumi, Physics of Ferromagnetism, secnd ed., Clarendon Press, Oxford, 1997.
[8] W. Chen, J. Liu, Z. Cheng, X. Lin, J. Zhu, Effect of chromium on microstructure, ordered phase and magnetic properties of Fe-6.5 wt% Si alloy, Mater. Today Proc. 2 (2015) S314–S318.
[9] J.A. Sandoval Robles, A. Salas Zamarripa, M.P. Guerrero Mata, J. Cabrera, Texture evolution of experimental silicon steel grades. Part I: hot rolling, J. Magn. Magn. Mater. 429 (2017) 367–371.
[10] Y.F. Liang, J.P. Lin, F. Ye, Y.J. Li, Y.L. Wang, G.L. Chen, Microstructure and me-chanical properties of rapidly quenched Fe–6.5wt.% Si alloy, J. Alloys Compd. 504 (2010) S476–S479.
[11] K.I. Arai, N. Tsuya, Ribbon-form silicon-iron alloy containing around 6.5 percent silicon, IEEE Trans. Magn. 16 (1980) 126–129.
[12] T. Watanabe, H. Fujii, H. Oikawa, K.I. Arai, Grain boundaries in rapidly solidified and annealed Fe-6.5 mass% Si polycrystalline ribbons with high ductility, Acta Metall. 37 (1989) 941–952.
[13] X.D. He, X. Li, Y. Sun, Microstructure and magnetic properties of high silicon electrical steel produced by electron beam physical vapor deposition, J. Magn. Magn. Mater. 320 (2008) 217–221.
[14] R.D. Cava, W.J. Botta, C.S. Kiminami, M. Olzon-Dionysio, S.D. Souza, A.M. Jorge Jr., C. Bolfarini, Ordered phases and texture in spray-formed Fe-5 wt% Si, J. Alloys Compd. 509 (2011) 260–264.
[15] N.E. Fenineche, M. Cherigui, H. Aourag, C. Coddet, Structure and magnetic prop-erties study of iron-based thermally sprayed alloys, Mater. Lett. 58 (2004) 1797–1801.
[16] J.N. Lemke, M. Simonelli, M. Garibaldi, I. Ashcroft, R. Hague, M. Vedani, R. Wildman, C. Tuck, Calorimetric study and microstructure analysis of the order-disorder phase transformation in silicon steel built by SLM, J. Alloys Compd. 722 (2017) 293–301.
[17] M. Garibaldi, I. Ashcroft, M. Simonelli, R. Hague, Metallurgy of high-silicon steel parts produced using Selective Laser Melting, Acta Mater. 110 (2016) 207–216. [18] M. Garibaldi, I. Ashcroft, J.N. Lemke, M. Simonelli, R. Hague, Effect of annealing on
the microstructure and magnetic properties of soft magnetic Fe-Si produced via laser additive manufacturing, Scr. Mater. 142 (2018) 121–125.
[19] B. Zhang, N.E. Fenineche, H. Liao, C. Coddet, Magnetic properties of in-situ syn-thesized FeNi3 by selective laser melting Fe-80%Ni powders, J. Magn. Magn. Mater. 336 (2013) 49–54.
[20] O. Ikeda, Y. Himuro, I. Ohnuma, R. Kainuma, K. Ishida, Phase equilibria in the Fe-rich portion of the Fe–Ni–Si system, J. Alloys Compd. 268 (1998) 130–136. [21] W.W. Zhang, H.H. Xu, J.L. Liang, W. Xiong, Y. Du, Phase equilibria of the Fe–Ni–Si
system at 850 °C, J. Alloys Compd. 481 (2009) 509–514.
[22] U.C. Özöğüt, A. Çakır, Investigation of temperature dependent magnetization and
elastic modulus in Si-doped Fe 65 Ni 35 invar alloys, J. Alloys Compd. 705 (2017) 126–130.
[23] C. Qiu, N.J.E. Adkins, M.M. Attallah, Selective laser melting of Invar 36: micro-structure and properties, Acta Mater. 103 (2016) 382–395.
[24] N. Kang, C. Verdy, P. Coddet, Y. Xie, Y. Fu, H. Liao, C. Coddet, Effects of laser remelting process on the microstructure, roughness and microhardness of in-situ cold sprayed hypoeutectic Al-Si coating, Surf. Coat. Technol. 318 (2017) 355–359. [25] H. Igarashi, K. Okazaki, Effects of porosity and grain size on the magnetic properties
of NiZn ferrite, J. Am. Ceram. Soc. 60 (1977) 51–54.
[26] T. Niendorf, S. Leuders, A. Riemer, H.A. Richard, T. Tröster, D. Schwarze, Highly anisotropic steel processed by selective laser melting, Metall. Mater. Trans. B Process Metall. Mater. Process. Sci. 44 (2013) 794–796.
[27] R. Hilzinger, W. Rodewald, Magnetic Materials: Fundamentals, Products, Properties, Applications, Publicis Publishing, Erlangen, 2013.