QUASI 2D-NUMERICAL MODEL OF AERATED FLOW
OVER STEPPED CHUTES
ANDRÉ1, S., DEWALS2, B., PIROTTON3, M., SCHLEISS4, A.J.
1
Research associate, 2FNRS Research Fellow, 3Professor, 4Professor
1,4
Laboratory of the Hydraulic Constructions (LCH), Swiss Federal Institute of Technology Lausanne (EPFL), CH-1015 Lausanne, Switzerland
Tel: +41 21 693 23 85 – Fax: + 41 21 693 22 64
2,3
Laboratory of Applied Hydrodynamics and Hydraulic Constructions (HACH), University of Liege (ULG), Ch. Des Chevreuils 1, Bat. B52/3+1, B-4000 Liege, Belgium
Tel: +32 4 366 95 36 – Fax: + 32 4 366 95 58
Email: stephanie.andre@epfl.ch, B.Dewals@ulg.ac.be, michel.Pirotton@ulg.ac.be, anton.schleiss@epfl.ch
ABSTRACT: Aerated flow over stepped chutes is principally studied on laboratory models. Consequently, the obtained design relations have a limited field of application. In order to propose a more general description of the flow, a quasi-2D numerical model is developed. The fluid is considered as an air-water mixture governed by the shallow-water equations. Moreover, a transport equation for air concentration represents the self-aeration of the flow and a coefficient of uneven vertical velocity distribution integrates indirectly the turbulent structures. The paper includes a brief description of the flow behaviour, the quasi-2D model equations, and a comparison of the numerical results with the measured flow characteristics in a 30° stepped flume.
KEYWORDS: Stepped-chutes, Self-aeration, Uneven vertical velocity distribution, Free surface waves, Finite volume, Depth-average, Navier-Stokes equations.
INTRODUCTION
Because of the high turbulence, the self aeration process and the irregular wavy free surface, most of the studies of the hydraulics of flow over stepped chutes are made on physical models. They have provided a panel of empirical hydraulic design relations, generally closely related and limited to their tested domain.
In order to provide a more general and accurate description of the flow behaviour, one of the objectives of the research being conducted at LCH-EPFL, is to propose a mathematical description of the aerated flow over macro-roughness. For this purpose, a quasi-2D model of aerated flow over conventional stepped chutes is developed by HACH-ULG on the basis of an existing finite volume 2D numerical model for free surface non-aerated flows. This mathematical and numerical approach is validated in the framework of a collaboration between LCH-EPFL and HACH-ULG.
Appropriate 2D vertical (2DV) or 3D models have recently been presented by a few authors, in particular Chen & al. (2001, 2002). However, only a very small number of these attempts are currently available and validated for this type of flows. As a consequence, improving depth-averaged models for aerated flows is of high interest because of its attractive compromise between realism and cost-time efficiency.
The purpose of this paper is to present the mathematical approach, which consists of modelling and validating the experimental 30° stepped flume of LCH-EPFL.
FLOW BEHAVIOUR
The main characteristics of a flow over steep stepped spillways are the self-aeration of the fluid due to its high turbulence and the macro-turbulent structures due to the form effects of the steps. They are briefly reviewed in the following. More details of the flow characteristics are given in André & al. (2002).
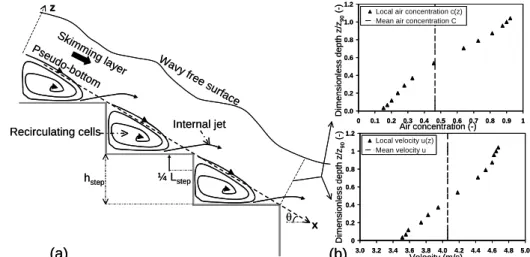
For a given stepped chute, depending on the discharge, different flow regimes can occur. For low discharge, it is comparable to a nappe (so-called nappe regime) which jumps from step to step, impacting the downstream portion of the horizontal step face. An air cavity is trapped under the nappe (Pinheiro & Fael 2000). As the discharge increases, the air cavity is progressively filled and the flow begins to slide over the pseudo-bottom (Fig. 1a). This transition regime endures until small air cavities are observed in some of the trapped water pools under the pseudo-bottom (Matos 2001). With increasing kinetic energy, a circulating movement is entrained inside the pool while the skimming layer gets thicker and flows in the mean chute slope direction (so-called skimming regime). The recirculating cells are spread over almost the whole step length and over the whole step height. Near the step edge, an internal jet, transverse to the main flow, creates a flow exchange at the pseudo-bottom (Fig. 1a). This regime is the most observed on prototypes since it corresponds to high discharges. For these 3 regimes, the high turbulence of the flow involves air entrainment.
Similarly to conventional smooth chutes (Wood 1991), for transition and skimming regimes, the flow can be divided into distinct regions along the slope:
- the non-aerated region, close to the chute crest, characterised by an irrotational flow as well asa smooth and glassy surface, withoutair entrainment.
- the aerated region, downstream ofthe so-called inception point. The turbulent energy is sufficient to involve self-aeration. The mixture of air and water gradually extends through the flowing fluid till reaching equilibrium. A quasi-uniform flow is then established. The free surface in this region becomes greatly irregular, wavy and white, with spray ejections, which makes difficult to define its delimitation.
0 0.2 0.4 0.6 0.8 1 1.2 3.0 3.2 3.4 3.6 3.8 4.0 4.2 4.4 4.6 4.8 5.0 Local velocity u(z)
Mean velocity u 0.0 0.2 0.4 0.6 0.8 1.0 1.2 0 0.1 0.2 0.3 0.4 0.5 0.6 0.7 0.8 0.9 1 Local air concentration c(z)
Mean air concentration C
¼ Lstep Recirculating cells Internal jet
Skim min g la yer Pse udo-bo ttom Wa vy free s urface hstep z x θ (a) (b) Dim e nsi o n less dept h z/z 90 (-) D im ensionl es s dept h z /z90 (-) Air concentration (-) Velocity (m/s) 0 0.2 0.4 0.6 0.8 1 1.2 3.0 3.2 3.4 3.6 3.8 4.0 4.2 4.4 4.6 4.8 5.0 Local velocity u(z)
Mean velocity u 0.0 0.2 0.4 0.6 0.8 1.0 1.2 0 0.1 0.2 0.3 0.4 0.5 0.6 0.7 0.8 0.9 1 Local air concentration c(z)
Mean air concentration C
¼ Lstep Recirculating cells Internal jet
Skim min g la yer Pse udo-bo ttom Wa vy free s urface hstep z x θ (a) (b) Dim e nsi o n less dept h z/z 90 (-) D im ensionl es s dept h z /z90 (-) Air concentration (-) Velocity (m/s)
Figure 1: Schematic description of the skimming flow behaviour (a) and (b) illustration of the air concentration and velocity profiles measured inthe 30° stepped flume
One of the main effects of the air, in addition to a swelling of the flow depth, is the significant reduction of the shear stress along the slope (Wood 1991). However,
compared to smooth slope, steps increase drastically energy losses. In fact, for nappe regime, the energy dissipation is mainly due to jet impact on the step, jet break-up in the air and a possibleformation of a hydraulic jump. For transition and skimming regimes, it is due to the friction induced by the recirculating cells and to the local head losses created by the internal transverse jet.
NUMERICAL MODEL
The experimental data highlight the two-dimensional structure of the flow in the vertical plane. However, this fact does not preclude any chance of assessing the relevant characteristics of the flow with a depth-averaged technique. In fact, as shown below, a simple quasi-2D model can provide accurate results at a low cost-time. On the other hand, 2DV and 3D models are still widely restrictive and expensive in terms of CPU. For instance, existing methods like Volume of Fluid (VOF) (Hirt & Nichols 1981, Zaleski 2000) or Marker-and-Cell (MAC) (Tome & al. 1994) especially require CPU resources. The major difficulty lies in the development of an effective and accurate tracking of the free surface location. In addition, reliable turbulence modelling remains a difficult task, especially in 2DV or 3D models with free surface because of the need for appropriate boundary conditions and sufficient mesh refinement.
Therefore, the proposed numerical approach consists in applying the classical shallow-water equations as a relevant basis and to extend them in order to take into account the: - self-aeration process with an air-transport equation,
- uneven vertical velocity distribution due to turbulence,
- macro-roughness dissipation effects as recirculating cells and internal jet with an adapted friction coefficient based on the experimental results.
The present numerical developments are included in the software package WOLF, which has been developed for several years at HACH-ULG. WOLF includes a complete set of numerical tools designed for simulating free surface flows in a wide range of applications: hydrology, quasi-2D and quasi-3D hydrodynamic models, 2DV, optimisation and solid transport (Dewals & al. 2002a, 2002b). The modelling of the aerated flow is based on the quasi-2D model.
HYDRODYNAMIC MODEL
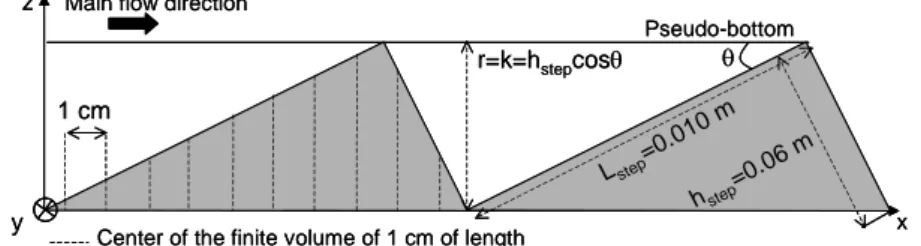
A sketch of the modelled flume is given in Fig. 2. The depth integration is carried out along the z axis.
The model is based on the description of the air-water mixture as a single fluid of mean density ρ
( )
x t, =ρw(
1−C)
+ρaC, with ρw and ρa respectively the density of water and of air, C the local mean air concentration, and h , the mixture height transported with a longitudinal velocity u .Pseudo-bottom
x
z
y
Main flow direction
Center of the finite volume of 1 cm of length
1 cm r=k=hstepcosθ hstep =0.06 m Lstep =0.01 0 m θ Pseudo-bottom x z y
Main flow direction
Center of the finite volume of 1 cm of length
1 cm r=k=hstepcosθ hstep =0.06 m Lstep =0.01 0 m θ
Depth-averaged continuity equation (mass balance)
( )
h(
hu)
0t ρ x ρ
∂ + ∂ =
∂ ∂ (1)
Depth-averaged momentum equation
In this first stage, assuming small velocity components normal to the main flow direction allows a simplification of the corresponding momentum equation. As a consequence the pressure field p is found to be almost hydrostatic everywhere.
A depth-averaging operation applied to the second local momentum equation results thus in the momentum balance:
(
)
(
2)
2 bb
cos cos sin
2 xx x z g hu h u h gh gh t ρ x ρ ρ x ρ θ ρ θ x ρ θ τ ∂ ∂ + ∂ + ∂ ⎛ ⎞+ = + ⎜ ⎟ ∂ ∂ ∂ ⎝ ⎠ ∂ , (2)
with g , the gravity acceleration, θ, the inclination of the main flow direction, z , the local b
bed elevation, τbx, the losses term and ρxx, a coefficient which takes into account the uneven velocity profile along the water depth. The diffusive contributions, which are not explicitly included, can be combined with the losses term.
Air transport
On the basis of the laboratory observations, it appears that the aeration process along the chute can be represented by a transport equation:
a C C u S t x ∂ + ∂ = ∂ ∂ (3)
with S , the air source term. a
This set of equations forms the mathematical system to be solved for the three primitive unknowns h , u and C . It can be slightly simplified by considering that ρ ρ≈ w(1−C). NUMERICAL IMPLEMENTATION
The mathematical system has been rewritten as a function of the conservative unknowns h
(
1−C)
, hu(
1−C)
and hC : S f f x t d + = ∂ ∂ + ∂ ∂ + − ) ( , (4)with d , the vector containing the three unknowns, f , the purely advective flux and + f −
the pressure flux, while S gathers the source terms:
(
)
(
)
2(
)
2(
)
b b w a 0 0 1f 1 ; f 1 cos ; S 1 sin cos
2 0 x xx h C u z g h C u C h C gh x hCu h S τ ρ θ θ θ ρ + − ⎛ ⎞ ⎛ ⎞ − ⎛ ⎞ ⎜ ⎟ ⎜ ⎟ ∂ ⎜ ⎟ ⎜ ⎟ ⎜ ⎛ ⎞ ⎟ =⎜ − ⎟ = − =⎜ − ⎜ − ⎟+ ⎟ ⎜ ⎟ ⎝ ∂ ⎠ ⎜ ⎟ ⎜ ⎟ ⎜ ⎟ ⎝ ⎠ ⎝ ⎠ ⎜⎝ ⎟⎠
A simple study of the characteristic velocities c of the system (4) leads to values, which i
are independent of the air concentration:
(
)
(
)
21 1 cos 1 1, 0, 1
i xx i i xx xx i
where ρxx is assumed constant. Examining the sign of expression (5) enables to identify the number of boundary conditions required at inflow and outflow.
A finite volume scheme is applied for the space discretization, in order to assure exact mass and momentum conservation. A simple splitting of the flux is used, as presented in Dewals & al. (2002a). The scheme is based, on an upstream approximation of f+ and a downstream one for f−. The stability of this scheme has been proved by way of a theoretical study of the mathematical system.
The time discretization is achieved with a classical 3-step Runge-Kutta algorithm. The efficiency of such an explicit method is well known because of its low computation-cost. Moreover the coefficients have been tuned to emphasize the dissipation and the stability properties of the scheme.
MODELLING OF THE FLOW CHARACTERISTICS Air source term
a
S has to take into account air entrainment and detrainment as a function of the flow
conditions and in order to satisfy the observed conditions: C= upstream of0 the inception point and C isincreasing along the chute up to C=Csat in the uniform region.
sat
C represents the air saturation concentration as a function of the chute slope, of the
roughness Froude number
3 * sin w q Fr g θ k
= with k=hstepcosθ and qw the water discharge. For this purpose, S is globally expressed by eq. 6: a
2 a ( sat) r 1 u S m C C U C C x β ∂ ⎛ ⎞ = −Γ ⎜ ⎟ − − − ∂ ⎝ ⎠ (6)
with Γ and β , calibrated coefficients of the advective air bubble source term, U , the air r
bubble release velocity of the diffusive term and respectively m= or 0 m= upstream 1 and downstream of the inception point.
Uneven vertical velocity repartition
xx
ρ (eq. 7) is integrated in the momentum to take into account the non uniformity of the vertical velocity profile, thus indirectly the macro-turbulent structures of the flow.
2 2 xx A A u dA q ρ =
∫∫
(7)Inside the step, for z< (Fig. 2), in a first approach, the recirculating cells are assumed r
to be characterised with a triangular velocity profile. At the pseudo-bottom, the interface velocity u is given according to the experimental results. Above the pseudo-bottom, for b z> , the velocity of the skimming layer is assumed to be non-uniform, characterised by r
edge
ρ , the calculated uneven distribution coefficient based on the velocity profile measurements at the step edge.
2 b edge 2 1 3 ( ) xx u hr h h r u h r ρ = ⎛⎜ ⎞⎟ + ρ − ⎝ ⎠ − (8) Friction term
At this stage, the losses along the chute are assumed to be represented by the Manning relation (eq. 9) with n , the Manning coefficient fitted according to the experimental results: 2 2 4 / 3 (1 ) xx bx u gn h C u h ρ τ = − (9)
RESULTS AND COMPARISONS WITH MEASUREMENT
In order to verify the proposed general theoretical model of aerated flows over macro-roughness, the numerical developments from HACH-ULG are used for modelling the 30° stepped chute assembled at LCH (André & al. 2001), for transition and skimming flow regimes. The validation of the model is based on:
- the free surface form: waves amplitude and phase of the surface of the flow, - the air concentration evolution along the chute,
- the longitudinal mean velocity in the uniform region. Air entrainment
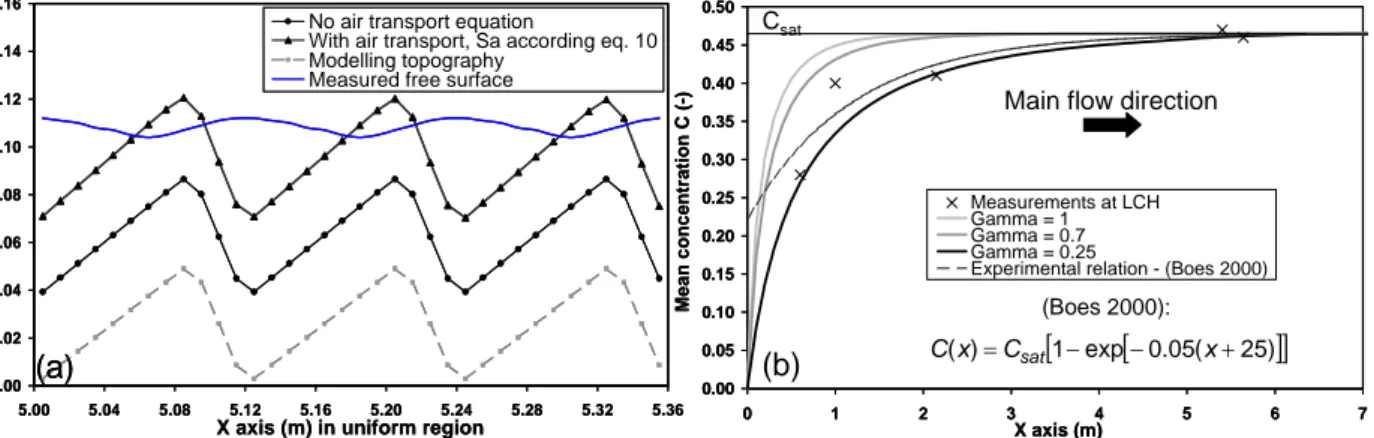
The air transport increases the mixture flow depth but does not cushion the topography effect on the free surface (Fig. 3a). The optimal representation of the self-aeration process is given by the term source:
( )
a sat
S = −Γm C−C (10)
As shown in Fig. 3b, with Γ =0.25, the longitudinal evolution of the air concentration represents quite realistically the longitudinal variation of C , fitting with the measurements and also with the experimental relation proposed by Boes (2000).
In fact, the consideration of the diffusive term U Cr 1− as well as the factor C
(
)
2/
u x
β
∂ ∂ in S showed incoherent variations of C and hence of h along the slope a
without reaching C . sat
0.00 0.05 0.10 0.15 0.20 0.25 0.30 0.35 0.40 0.45 0.50 0 1 2 3 4 5 6 7 X axis (m) Mean concentr ation C (-) Measurements at LCH Gamma = 1 Gamma = 0.7 Gamma = 0.25
Experimental relation - (Boes 2000)
0.00 0.02 0.04 0.06 0.08 0.10 0.12 0.14 0.16 5.00 5.04 5.08 5.12 5.16 5.20 5.24 5.28 5.32 5.36 X axis (m) in uniform region
Z axi
s (
m
)
No air transport equation
With air transport, Sa according eq. 10 Modelling topography
Measured free surface
Main flow direction Csat [ ] [1 exp 0.05( 25)] ) (x =C − − x+ C sat (Boes 2000): (b) (a) 0.00 0.05 0.10 0.15 0.20 0.25 0.30 0.35 0.40 0.45 0.50 0 1 2 3 4 5 6 7 X axis (m) Mean concentr ation C (-) Measurements at LCH Gamma = 1 Gamma = 0.7 Gamma = 0.25
Experimental relation - (Boes 2000)
0.00 0.02 0.04 0.06 0.08 0.10 0.12 0.14 0.16 5.00 5.04 5.08 5.12 5.16 5.20 5.24 5.28 5.32 5.36 X axis (m) in uniform region
Z axi
s (
m
)
No air transport equation
With air transport, Sa according eq. 10 Modelling topography
Measured free surface
Main flow direction Csat [ ] [1 exp 0.05( 25)] ) (x =C − − x+ C sat (Boes 2000): (b) (a)
Figure 3: Air entrainment effect (a) on the surface flow in the uniform region and (b) on the longitudinal variation of C, for qw=0.12 m
2 /s
Uneven vertical velocity distribution
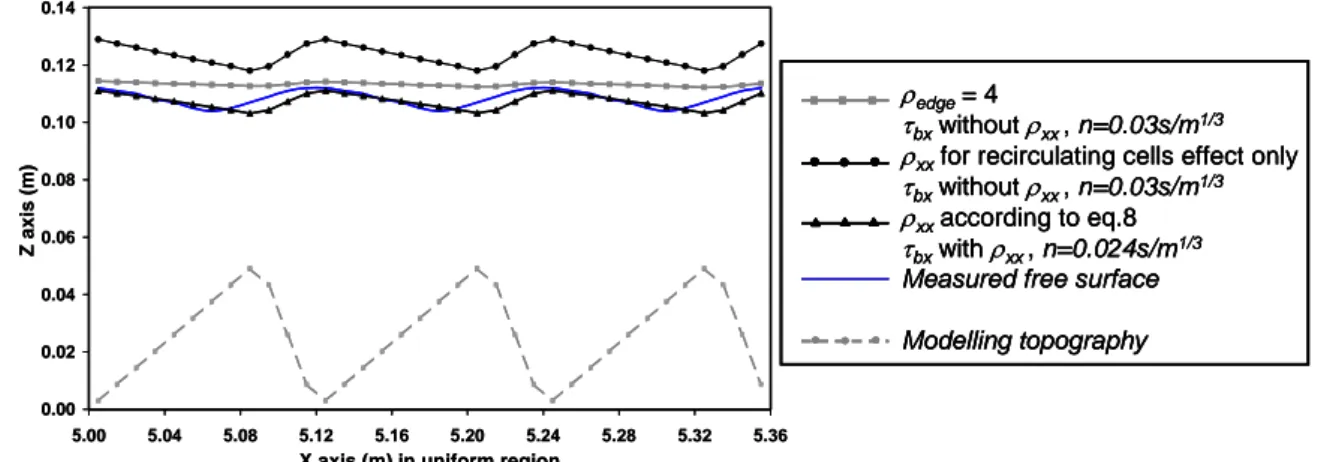
Sensitivity analysis of ρxx effects in the momentum balance has been carried out, first only considering the contribution of the internal jet effect (ρxx =ρedge), then with the only contribution of the recirculating cells inside the step ( 2
2 3
( ) ( )
h
xx h r h r
ρ = − − ) and finally with the global ρxx according to eq. 8 (Fig.4). The tests haveclearly shown that ρxx:
- contributes to the swelling of the flow depth,
- acts on the waves amplitudes of the free surface, similarly to the observations: for increasing discharge, the waves amplitudes decrease significantly,
- has no influence on the waves phases. In fact, the observations have shown that the waves extrema are shifted downstream with an increasing discharge. It will be modelled in a next stage, with the introduction of a non-hydrostatic pressure distribution.
Finally, the optimised uneven velocity distribution coefficient is given by eq. 8, with ub u ≈ a
and ρedge =bFr*+ , with a , b and c obtained from experimental results. c
0.00 0.02 0.04 0.06 0.08 0.10 0.12 0.14 5.00 5.04 5.08 5.12 5.16 5.20 5.24 5.28 5.32 5.36
X axis (m) in uniform region
Z axi s ( m ) ρedge= 4 τbxwithout ρxx , n=0.03s/m1/3
ρxxfor recirculating cells effect only
τbxwithout ρxx , n=0.03s/m1/3
ρxxaccording to eq.8
τbxwith ρxx , n=0.024s/m1/3
Measured free surface Modelling topography 0.00 0.02 0.04 0.06 0.08 0.10 0.12 0.14 5.00 5.04 5.08 5.12 5.16 5.20 5.24 5.28 5.32 5.36
X axis (m) in uniform region
Z axi s ( m ) ρedge= 4 τbxwithout ρxx , n=0.03s/m1/3
ρxxfor recirculating cells effect only
τbxwithout ρxx , n=0.03s/m1/3
ρxxaccording to eq.8
τbxwith ρxx , n=0.024s/m1/3
Measured free surface Modelling topography
ρedge= 4
τbxwithout ρxx , n=0.03s/m1/3
ρxxfor recirculating cells effect only
τbxwithout ρxx , n=0.03s/m1/3
ρxxaccording to eq.8
τbxwith ρxx , n=0.024s/m1/3
Measured free surface Modelling topography
Figure 4: Effect of ρxx on the flow characteristics in the uniform region, for qw=0.12 m2/s.
Friction term
On the basis of the measurements in the uniform region, the Manning coefficient for the 30° stepped flume decreases from 0.0227 s/m1/3 for qw=0.06 m2/s to 0.0218 s/m1/3 for
qw=0.28 m2/s (André & al. 2002). Without considering ρxx in the losses term τbx, the
calculated mean flow velocity is about 25% faster than the measured one. The consideration of ρxx in τbx has resulted in a good fit of the flow characteristic but only for a Manning coefficient of 0.024 s/m1/3, then over-estimated. That means that the Manning relation is not well adapted for modelling the dissipation energy process along the steps.
CONCLUSION AND PERSPECTIVES
The presented model for describing the hydraulic behaviour of aerated flows over a 30° stepped flume, based on the depth-averaged balance of mass and momentum for an air-water mixture, and on a transport equation for the air concentration, has provided promising results. The consideration of specific flow properties with the coefficient of uneven vertical velocity distribution and with the friction factor fitted to the measurements has permitted to model indirectly, in a first stage, the macro-turbulent
structures of the flow inside the step (recirculating cells) and at the step edge (internal jet). This first optimisation has resulted in flow characteristics (mixture depth, mean velocity and concentration) at the step edge which are quite similar to the measurements and showing a realistic wavy free surface.
Moreover, still a higher degree of realism could be achieved, in particular by:
- the definition of an effective flow over the pseudo-bottom represented with a specific roughness, which effectively transports the momentum and the air concentration, - a non-hydrostatic pressure distribution, associated to a vertical velocity component
due to the macro-turbulent structures of the flow,
- a dissipation force, including a friction term based on a velocity distribution approach and a drag term, both represented through an effective roughness at the pseudo-bottom.
The validation of this numerical model with the laboratory measures of the flow characteristics will enable the development of a more general description of aerated flow over macro-roughness.
AKNOWLEDGEMENTS
The authors gratefully thank the Federal Office for Water and Geology, Switzerland, which finances this research project, as well as the European Research Community On Flow, Turbulence and Combustion and the Deprez foundation of ULG.
REFERENCES
André, S., Boillat, J.-L., Schleiss, A. 2001. High velocity two-phase turbulent flow over macro-roughness stepped chutes: Focus on dynamic pressures. In ISEH (eds), Proc.
Int. Symposium on Environmental Hydraulics: CD. Tempe, Arizona, USA.
André, S., Boillat, J.-L., Schleiss, A. 2002. Efficient surface protection by macro-roughness linings for overtopped embankment dams. In Llanos et al. (eds), Swets & Zeitlinger Publishers, Proc. Int. congress on conservation and rehabilitation of dams: pp.407-415. Balkema.
Boes R.M. 2000. Zweiphasenströmung und Energieumsetzung an Grosskaskaden. PhD
thesis. Minor H.-E. editor. VAW-ETHZ, Zurich.
Chen, Q., Dai, G., and Liu, H. 2001. The Turbulence Numerical Simulation for the Stepped Spillway Overflow. Proc. of the XXIX IAHR Congress: CD. Beijing, China. Chen, Q., Dai, G., and Liu, H. 2002. Volume of Fluid Model for Turbulence Numerical
Simulation of Stepped Spillway Overflow. J. of Hydr. Engineering, 128(7): 683-688. Dewals, B. & al. 2002a. Dam-break hazard assessment with geomorphic flow, using
WOLF 2D hydrodynamic software in Risk Analysis III, C. Brebbia, Editor. WIT Press. Dewals, B., & al. 2002b. Coupled computations of highly erosive flows with WOLF
software. Proc. of the 5th Int. Conference on Hydro -Science & Engineering. Warsaw. Hirt, C. and Nichols, B. 1981. Volume of Fluid (VOF) Method for the Dynamics of Free
Boundaries. Journal of Computational Physics, 39: 201-225.
Matos, J. 2001. Onset of skimming flow on stepped spillways – Discussion. J. Hydr.
Engineering, 127(7): pp. 519-521.
Pinheiro, A.N., Fael, C.S. 2000. Nappe flow in stepped channels – occurrence and energy dissipation. In Minor & Hager (eds), Proc. Int. workshop on hydraulics of
stepped spillways: 119-126. Rotterdam: Balkema.
Tome, M., McKee, S. Gensmack. 1994 A Computational Marker and Cell Method for Free Surface Flows in General Domains. J. of Computational Physics, 110: 171-186. Wood, I.R. 1991. Free surface air entrainment on spillways. In Wood I.R.(eds), Hydraulic
structures design manual on air entrainment in free-surface flows: 55-84. Rotterdam:
Balkema.
Zaleski, S. 2000. Multiphase-Flow CFD with Volume of Fluid (VOF) Methods. Proc. of