Analytic search methods in online social networks
by
Christopher E. Marks
B.S., United States Military Academy S.M., Massachusetts Institute of Technology Submitted to the Sloan School of Management in partial fulfillment of the requirements for the degree of
Doctor of Philosophy in Operations Research at the
MASSACHUSETTS INSTITUTE OF TECHNOLOGY June 2017
c
○2017 Christopher E. Marks, All rights reserved.
The author hereby grants to MIT and The Charles Stark Draper Laboratory, Inc. per-mission to reproduce and to distribute publicly paper and electronic copies of this thesis document in whole or in any part medium now known or hereafter created.
Author . . . . Sloan School of Management
May 16, 2017 Certified by . . . . John Irvine Draper, Inc. Thesis Supervisor Certified by . . . . Tauhid Zaman KDD Professor Thesis Supervisor Accepted by . . . . Dimitiris Bertsimis Boeing Professor of Operations Research Co-Director, Operations Research Center
Analytic search methods in online social networks by
Christopher E. Marks
Submitted to the Sloan School of Management on May 16, 2017, in partial fulfillment of the
requirements for the degree of
Doctor of Philosophy in Operations Research
Abstract
This thesis presents and evaluates methods for searching and analyzing social media data in order to improve situational awareness. We begin by proposing a method for network vertex search that looks for the target vertex by sequentially examining the neighbors of a set of “known” vertices. Using a dynamic programming approach, we show that there is always an optimal “block” search policy, in which all of the neighbors of a known vertex are examined before moving on to another vertex. We provide a precise characterization of the optimal policy in two specific cases: (1) when the connections between the known vertices and the target vertex are independent, and (2) when the target vertex is connected to at most one known vertex. We then apply this result to the problem of finding new accounts belonging to Twitter users whose previous accounts had been suspended for extremist activity, quantifying the performance of our optimal search policy in this application against other policies. In this application we use thousands of Twitter accounts related to the Islamic State in Iraq and Syria (ISIS) to develop a behavioral models for these extremist users. These models are used to identify new extremist accounts, identify pairs of accounts belonging to the same user, and predict to whom a user will connect when opening an account. We use this final model to inform our network search application. Finally, we develop a more general application of network search and classification that obtains a set of social media users from a specified location or group. We propose an expand—classify methodology which recursively collects users that have social network connections to users inside the target location, and then classifies all of the users by maximizing the probability over a factor graph model. This factor graph model accounts for the implications of both observed user profile features and social network connections in inferring location. Using geo-located data to evaluate our method, we find that our classification method typically outperforms Twitter’s native search methods in building a dataset of Twitter users in a specific location.
Thesis Supervisor: John Irvine Title: Draper, Inc.
Thesis Supervisor: Tauhid Zaman Title: KDD Professor
Acknowledgments
Dr. Jytte Klausen at Brandeis provided access to her ISIS dataset and data collection guidance, from which we built our database of ISIS Twitter accounts. This database directly supported our analyses of online extremist activities, behavioral and predictive models, motivated the development of our network search methodology.
Dr. Mark Abramson, Dr. John Irvine, and Dr. Steve Kolitz from Draper provided valuable direction, contributions, and questions throughout this research. Dr. Kolitz’s guidance and support during this time has been invaluable, and I look forward to future collaborative efforts and continued research.
Lieutenant Krishnan Rajagopalan served as a fellow researcher and friend during our two-year overlap. I appreciate his input and perspectives on my earlier research efforts, and wish him the best in his career in the U.S. Navy.
Many of my colleagues and supervisors in the U.S. Army also provided invaluable support. I especially appreciate the research discussions with Lieutenant Colonel Chris Smith, Lieutenant Colonel Mike Teter, Lieutenant Colonel Matt Benigni, and Lieutenant Colonel Kevin Cummiskey, who all provided feedback and additional insights on my research efforts.
All of the faculty and staff that I have worked with at MIT have been superb. I especially thank my advisor, Professor Tauhid Zaman, for his guidance, mentoring, and support. While it has been a lot of work, Tauhid kept our research interesting, relevant, and fun. I hope we find opportunities for continued collaboration in the future.
Finally, this I could not have devoted the time and focus needed in this program without the loving support and seemingly endless patience of my wife, Carol, and my children, Sarah, MJ, and Bobby. I am eternally grateful, and I look forward to whatever adventures the future has in store.
Contents
1 Introduction 17 1.1 Problem . . . 17 1.1.1 Technical Approach . . . 18 1.1.2 Experimentation . . . 18 1.2 Social Media . . . 18 1.2.1 Twitter . . . 20 1.3 Previous Work . . . 25 1.3.1 Social Networks . . . 26 1.3.2 Social Media . . . 291.4 Situational Awareness and Intelligence . . . 31
1.5 Thesis Organization . . . 32
2 Optimal User Search in Online Social Networks 35 2.1 Background and Motivation . . . 35
2.1.1 Application . . . 37
2.1.2 Previous Work . . . 37
2.2 Multi-urn Search Model . . . 41
2.2.1 Dynamic Programming Framework . . . 44
2.2.2 Costs . . . 47
2.3 Key Results . . . 49
2.3.1 Block Policy Optimality . . . 49
2.3.2 Independent Urns . . . 50
2.3.3 One Marble . . . 53
2.3.5 Urn Correlation Dynamics . . . 57
2.4 Summary of Network Search Contributions . . . 59
2.5 Proofs of Statements . . . 61
2.6 Proof of Theorem 1 . . . 61
2.7 Proof of Theorem 2 . . . 65
2.7.1 Preparatory Material . . . 65
2.7.2 Proof of Main Result . . . 67
2.8 Proof of Theorem 3 . . . 72
2.9 Proof of Theorem 4 . . . 73
2.10 Proof of Theorem 6 . . . 76
2.11 Proof of Theorem 7 . . . 78
2.12 Proof of Theorem 8 . . . 80
3 Finding Online Extremists in Social Networks 83 3.1 Background and Motivation . . . 83
3.1.1 Overview of Contributions . . . 84
3.1.2 Previous Work . . . 86
3.2 Data . . . 87
3.3 Predicting Account Suspensions . . . 88
3.3.1 Results . . . 89
3.4 Detecting Multiple Accounts . . . 91
3.4.1 Suspended User Behavior . . . 92
3.4.2 Profile Comparison Metrics . . . 94
3.4.3 Data Set Construction . . . 96
3.4.4 Data Labeling . . . 97
3.4.5 Classification Model . . . 99
3.4.6 Classification Threshold Sensitivity . . . 102
3.5 Re-following Model . . . 105
3.5.1 Data . . . 106
3.5.2 Features . . . 107
3.5.3 Kernel Logistic Regression . . . 108
3.6 Suspended User Search . . . 110
3.6.1 Suspended User Search Model . . . 111
3.6.2 Initialization . . . 113
3.6.3 The Discrete Stochastic Search Process . . . 113
3.6.4 Search Process Dynamics . . . 115
3.6.5 Analysis: ¯𝜌 = 0 . . . 119
3.6.6 Results . . . 123
3.6.7 Discussion: ¯𝜌 > 0 . . . 127
3.7 Summary of ISIS Search Contributions . . . 127
4 Building a Location-Based Set of Social Media Users 129 4.1 Background and Motivation . . . 129
4.1.1 Previous Work . . . 132
4.1.2 Expand—Classify Methodology . . . 134
4.2 Classification Model . . . 135
4.2.1 Factor Graph Representation . . . 135
4.2.2 Model Characteristics . . . 137
4.2.3 Classification Optimization . . . 139
4.3 Choosing the Energy Functions . . . 144
4.3.1 Link Energy Model . . . 144
4.3.2 Profile Energy Function . . . 147
4.4 Implementations . . . 149
4.4.1 Corinto, Colombia . . . 149
4.4.2 Casimiro de Abreu, Brazil . . . 157
4.4.3 Caracas, Venezuela . . . 161
4.4.4 Summary of Results on All Locations . . . 165
4.5 Non-location Grouping . . . 167
4.6 Conclusion & Future Research . . . 168
5 Conclusion 171
List of Figures
1-1 Growth in the number of Internet users 1995–2016 [71]. . . 19
1-2 A screen capture of the profile page for Mayor “Beng” Climaco of Zamboanga City, Philippines [141]. . . 21
1-3 Example Tweet from the Boston Globe [141]. . . 23
1-4 The information hierarchy, taken directly from [144, Figure 1-1, p. 1-3]. . . 32
2-1 Network search representation as a multi-urn model. . . 36
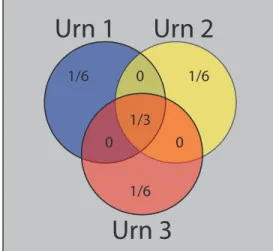
2-2 Venn diagram of the probabilities in the three-urn example. . . 58
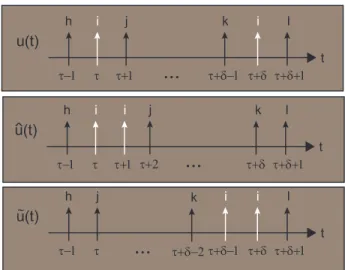
2-3 Comparison of policies u, ^u, and ˜u. . . 68
3-1 ROC curve for the regularized logistic regression classifier for Twitter suspensions (𝑃𝐹 is the false detection rate and 𝑃𝐷 is the true detection rate). . . 90
3-2 Histogram of screen names for active and suspended accounts in our data. The average numbers of screen names for suspended and active accounts are listed in the legend. . . 94
3-3 Examples of Levenshtein ratios for different pairs of screen names. . . 95
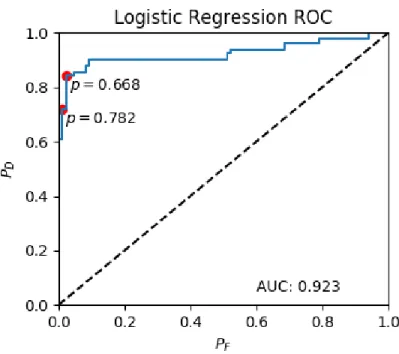
3-4 Logistic regression ROC curve on hand labeled data (𝑃𝐹 is the false detection rate and 𝑃𝐷 is the true detection rate). . . 100
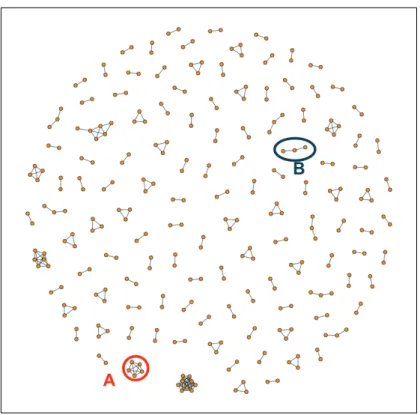
3-5 Graph representation of accounts belonging to the same user using our regression model and equation (3.3) with a threshold of 0.782. . . 101
3-6 Paired accounts graph properties as a function of threshold 𝑃 . The threshold value 0.782 from equation (3.3) is indicated on the plot. . . 103
3-7 Graph representation of accounts belonging to the same user using our regression model and equation (3.3) with a threshold of 0.668. . . 104
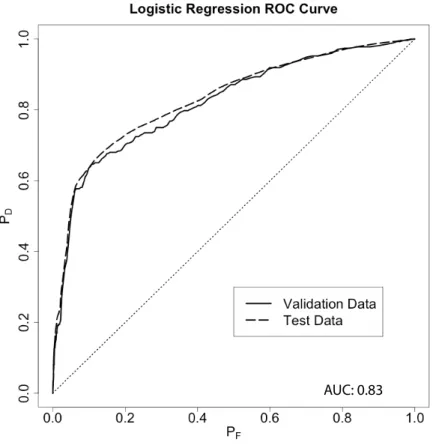
3-8 ROC curve for 𝐿2-regularized quadratic kernel logistic regression model for predict-ing re-follows evaluated on out-of-sample test data. (left) Test data and trainpredict-ing and validation data can contain the same user. (right) Test data and training and
validation data do not contain the same users. . . 109
3-9 Probability of finding the target user’s new account, given it exists, as a function of number of queries of former friend 𝑗. . . 119
3-10 Box plots of the percentage above optimal of the (left) expected cost and (right) actual cost of different search polices for ISIS users in Twitter. . . 125
4-1 FARC attack locations near Corinto, Colombia since 2002 [104], plotted using Google Maps [64]. . . 131
4-2 Expand—Classify Methodology . . . 134
4-3 Factor graph model for social media user location classes. . . 136
4-4 Energy graph representation of the energy equation corresponding to the factor graph in Figure 4-3. . . 140
4-5 Illustration of Case 1 cut. Nodes in set 𝑆L are shaded green, while nodes in set 𝑇L are shaded red. Dashed edges are in cut-set 𝐶L. . . 142
4-6 Illustrations of both minimum cut possibilities for Case 2. Nodes in set 𝑆Lare shaded green, while nodes in set 𝑇L are shaded red. Dashed edges are in cut-set 𝐶L. . . 142
4-7 Illustration of Case 3 cut. Nodes in set 𝑆L are shaded green, while nodes in set 𝑇L are shaded red. Dashed edges are in cut-set 𝐶L. . . 143
4-8 Decay of link energy 𝜓(z1,2, 1, 0) as the number of user 1 friends or number of user 2 followers increases. . . 146
4-9 Corinto, Colombia label radius, plotted on Google Maps [64]. . . 150
4-10 Corinto user classification ROC using logistic regression model for profile energy. . . 153
4-11 Sensitivity of Corinto user classification to parameter 𝛾. . . 155
4-12 Sensitivity of Corinto user classification to parameter 𝜆. . . 155
4-13 Sensitivity of Corinto user classification to logistic regression regularization. . . 156
4-14 Casimiro de Abreu, Brazil label radius, plotted on Google Maps [64]. . . 157
4-15 Results and Sensitivity of Casimiro de Abreu user classification. . . 160
4-16 Caracas, Venezuela label radius, plotted on Google Maps[64]. . . 161
4-18 Times to complete Caracas collection iterations. . . 163 4-19 ROC for Pizzagate user classification using hand-labeled test data. . . 168
List of Tables
1.1 Twitter REST API methods, results, maximum results returned per query (RPQ), and maximum queries per 15-minute interval (Limit) [138]. . . 25
3.1 Features for predicting Twitter suspensions. . . 89 3.2 Summary of sampled accounts from those incorrectly classified as suspensions using
the regularized logistic regression model. . . 91 3.3 Partial screen name—tweet timelines for two Twitter user accounts purportedly
be-longing to Sally Jones. These accounts have been suspended by Twitter and are no longer available. . . 93 3.4 Accounts exhibiting very low similarity, according to the selection criterion given in
equation (3.1). . . 98 3.5 Accounts exhibiting very high similarity, according to selection criterion given in
equation (3.2). These accounts were manually labeled as belonging to the same user, i.e., 𝑦(𝑖,𝑗)= 1. . . . 98
3.6 Regression coefficients for matching accounts. . . 99 3.7 Accounts comprising component A. While average hash values for profile pictures are
abbreviated, they are the same for all profiles. . . 102 3.8 Accounts comprising component B. . . 102 3.9 Accounts comprising component C. . . 105 3.10 Example of @MusabGharieb18’s re-following behavior upon opening new account
@MusabGharieb13. The entries in the table indicate who these two accounts followed.106 3.11 Example data rows resulting from re-following behavior given in Table 3.10. Features
are omitted but include, for example, characteristics from each friend’s profile. . . 106 3.12 Randomly selected account pairs for testing. . . 123 3.13 Cost comparisons for different policies. . . 125
4.1 Example odds tabled used to construct a profile energy function. . . 148 4.2 List of character strings 𝑊1 used to extract profile features for Corinto logistic
re-gression. . . 151 4.3 Categorization lists for Casimiro de Abreu, Brazil. . . 159 4.4 Odds Table Used in Naive Implementations . . . 159 4.5 List of character strings 𝑊1 used to extract profile features for Caracas logistic
re-gression. . . 162 4.6 Results from user set collections from nine locations. . . 165
Chapter 1
Introduction
In 2013, Philippine journalist Maria Ressa published From Bin Laden to Facebook [118], which documented the growing role social media was playing in the growth and reach of extremist organi-zations. In the 10 years since her first book, Seeds of Terror [117], which meticulously documented Al Qaeda’s pre-social media formation and organization in southeast Asia, it seemed that much had changed.
Ms. Ressa was on to something. A year after From Bin Laden to Facebook was published, the Islamic State in Iraq and Syria (ISIS) surprised the U.S. and the world with its rapid organization and territorial advances [55, 94]. In addition to its reputation for brutality, ISIS is widely known for its ability to leverage social media for recruiting, propaganda, and communications [13, 61]. The rise of ISIS provides a striking example of the role social media can play in shaping events.
The ubiquity and importance of social media in global events goes beyond ISIS. Access to social media is becoming nearly universal, and much of the content is publicly accessible and available. This content could be an invaluable data source for attaining situational awareness, which has its applications in business, military, law enforcement, politics, emergency response, and more. The goal of this research effort is to make meaningful contributions to the growing body of research that aims to attain better understanding, detection, and prediction of events, groups, and societies through the analysis of social media data.
1.1
Problem
The problem we address is to provide new methods of collecting and searching social media data that contribute to improving situational awareness, with a focus on military and security applications.
1.1.1 Technical Approach
This thesis is comprised of three main efforts. In the first effort, we formulate the problem of finding a specific user in a social network based on a probability model assumed on the user’s social connections. We use a dynamic programming approach to formulate the network search and provide necessary and sufficient conditions for optimal search policies in general and in specific cases.
In the second effort, we address the problem of finding Twitter accounts belonging to ISIS users. In this section we use logistic regression models to classify accounts and to provide a probability model on social network connections. We use the results of this probability model and our optimal network search results to find new accounts belonging to previously suspended users.
In the third effort, we address a more general network search problem in which the objective is not to find a specific user, but rather to find all of the users belonging to a specific group or location. We use a factor graph to model the observed social network, and again rely on logistic regression to inform the factor potentials. Efficient optimization is performed using graph cuts in order to find the maximum likelihood classification according to this graph model, with validation and test data used to fit and analyze model parameters.
1.1.2 Experimentation
Because of the relative ease of collecting user generated content, as well as its public availability in general, all of our experimentation in this thesis is carried out on real social media data collected from Twitter [141]. We analyze the performance of our ISIS classification models and our network search model on a dataset consisting of known ISIS members and their social network connections. We analyze our group collection method by applying it to collect Twitter users from nine population centers, and compare the results to those obtained using Twitter’s native search methods.
To evaluate the performance of our classification models, we use the Receiver Operator Charac-teristic (ROC) curve, which compares the rate of correct positive classifications against the rate of incorrect positive classifications. We use the area under the ROC curve (AUC) as a single metric of performance and to compare different classification models
1.2
Social Media
In the first decade of the 21st century the nature of the World Wide Web changed. Simultaneously, the number of people connected to the Internet as users (Figure 1-1) began to climb rapidly, the cost
of online data storage declined, and users’ ability to populate sites with their own original content increased [108, p. 2]. The ensuing evolution has come to be known as “Web 2.0,” referring not to any specific technological changes but rather a change in how the World Wide Web was being used [78, p 61]. In contrast to the older “Web 1.0” convention in which a relatively small set of developers created applications and content for users to consume, the environment of Web 2.0 came to be one of collaborative development among users. As a result, the World Wide Web came to be characterized by User Generated Content and Social Media [78, pp 60–61].
Figure 1-1: Growth in the number of Internet users 1995–2016 [71].
The notion of what constitutes “social media” continues to evolve as new applications are in-troduced and others are closed or decline in popularity. Boyd and Ellison [21, p. 211] use the term “social network sites” to refer to web based services in which users can create a public (or semi-public) profile, list connections to other users, and view the profiles of their connections and the connections of other users on the site. Kaplan and Haenlein [78, p. 61] provide a simpler definition: “Social media is a group of Internet-based applications that build on the ideological and technological foundations of Web 2.0, and that allow the creation and exchange of User Generated Content.” Obar and Wildman [108, p. 2] defines social media services as those having the following features:
1. They are Web 2.0 Internet-based applications.
2. User Generated Content constitutes the application’s “lifeblood.”
3. Users or groups create profiles on the site provided by the social media service.
4. The services enable social networking, so that users can have their profiles connected to those of other users.
The specific implementation of these social media capabilities varies among applications, with the current spectrum of social media sites offering a wide range of diversity in scope, functionality, purpose, and user-base [80, p. 242]. Some sites adapted over time in response to the perceived pref-erences and specific applications of the users. MySpace, for example, found early success connecting independent rock bands with fans [21, p. 217]. Others, like LinkedIn, were designed to appeal to a specific type of user for a specific purpose. Facebook began as a niche private network for Harvard students, but expanded to include other universities as well, then to high schools, and eventually opened its access to all users to become one of the most frequented social media application in the world [21, p. 218].
Facebook and Twitter, two of the most popular social media applications, are general in nature and widely accessible throughout the world. In both of these applications and in many others like them, individual user identifying information is limited. Facebook allows users to post a substantial amount of identifying information, but users ultimately choose what information to provide and, of what they provide, what information is publicly visible. Twitter allows users to provide a name, a short description, a URL, a picture, and a few other personalizations to their profile [73, p. 59]. Many users of Facebook, Twitter, and other social media use pseudonyms, so that their identities are not immediately apparent.
1.2.1 Twitter
In our experimentation we will use data obtained from Twitter [141], primarily due to the following useful features:
∙ The Twitter Application Program Interface (API) [138] makes it relatively easy to collect data
from this site.
∙ As a micro-blogging application, use of Twitter centers on real-time updates and conversations
∙ Much of the data is publicly available. While users can “protect” their accounts and their
content so that only their “followers” can see it [141], the default setting is for user profiles and User Generated Content to be visible to anybody accessing the site.
User Generated Content in Twitter is restricted to short posts, or tweets, by a user. These posts are currently limited to 140 characters, with exceptions or adjustments to this limit when the post includes a URL or attached media. Twitter users can browse other users’ profiles and choose to follow specific users. When a user logs on, the Twitter application shows him a timeline consisting of recent posts from all of the users he is following, generally sorted in reverse chronological order.
Creating an Account
Upon creating an account, a new Twitter user chooses a unique screen name that serves as an account login and identifier. The user can also choose a name that does not have to be unique, upload a profile picture and a background picture, provide a short description, input a location, and include a personal URL. Twitter assigns each new account a unique, integer user ID and stores the date and time of account creation. Figure 1-2 provides an example of an account profile page.
Figure 1-2: A screen capture of the profile page for Mayor “Beng” Climaco of Zamboanga City, Philippines [141].
Tweeting
Once a user has created an account, he can immediately start tweeting. Tweets can include up to 140 characters of text, or can include up to 117 characters of text and a URL hyperlink or attached
photo or video. Twitter assigns each tweet a unique status ID (Twitter refers to tweets as statuses) and stores the time and date it was posted, as well as the author’s user ID. Each tweet is posted with a link to the author’s profile page.
In addition to including URLs and media, the user can mention other users in a Tweet or include hashtags. A hashtag is simply a sequence of numbers and letters preceded by a “hash” symbol (#), which serves as a label on the tweet for the purpose of efficient searching. User mentions are references to other Twitter users by screen name, preceded by the “at” symbol (@). Twitter extracts hashtags and user mentions from tweets and stores them as tweet “entities.” These entities are hyperlinked in the tweet when it is displayed, so that a click on a user mention directs to the mentioned user’s profile page, while a click on a hashtag provides the search results for that hashtag. Figure 1-3 provides an example of a tweet display. The tweet contains the hashtags “#BREAK-ING” and “#Bridgegate,” and has two images attached.
Retweeting
A user also has the ability to retweet a tweet from another user. A retweet is similar to a “regular” tweet, except that the retweet contains an explicit reference to the original tweet by beginning with the character string “RT” followed by a user mention citing the original author. Otherwise, the effect of a retweet is the same as that of a tweet: if a user posts a retweet, then that user’s followers will be able to view the retweet on their home timelines. For retweets, Twitter stores the originating tweet’s ID. Twitter also displays the number of retweets with each tweet, which links to the profiles of those that retweeted. As indicated, at the time of the screen capture the tweet in Figure 1-3 has been retweeted 14 times.
Replying
Users can reply directly to tweets. Replies are also treated as tweets, but with special behavior. Replies do not appear on followers’ timelines. Instead, they appear attached to the original, “replied-to” tweet on the original tweet author’s timeline. Replies generally begin with a user mention of the original tweet’s author. Twitter stores replies as tweets with unique tweet IDs and also records the original tweets ID as the in_reply_to_status_id. A single reply can be seen to the tweet in Figure 1-3, although there were more below the screen capture. The reply begins with a user mention of the original tweet’s author but contains another user mention as well. Also, the Twitter web interface provides the authenticating user (me, in Figure 1-3) with the means reply immediately below the
Figure 1-3: Example Tweet from the Boston Globe [141].
tweet.
Liking
A user can indicate interest in a tweet by “liking” the tweet, usually by clicking a button below the tweet. This information is recorded and displayed with the tweet, so that both the number of likes and the screen names of the “likers” can be easily viewed. The tweet in Figure 1-3 had been liked 11 times at the time of screen capture.
Following
If a user is interested in reading content posted by another user, he can follow that user. If the account of interest is protected, then this relationship must be approved by the followed user. Otherwise, consent is assumed (the content is public anyway) and the followed user’s tweets will appear on the follower user’s home timeline.
Searching
Any Twitter user, and even web users without Twitter accounts, can execute search queries through Twitter’s web interface. Twitter returns tweets that match the query criteria. These results can be sorted by most recent, most relevant (as determined by a Twitter algorithm that accounts for how recently the content was posted and how many likes, retweets, and replies it generated), or a mixture of both. Search queries can include hashtags or screen names. Users can also search for accounts, as opposed to tweets, that have names or screen names matching the search criteria.
Surfing Twitter
With the functionality Twitter provides, Twitter users can conduct searches and follow embedded links to related tweets (e.g., by clicking on a hashtag) or user profile pages (by clicking on a user mention or tweet author). In this way the user interacts: replying to and retweeting material the user finds interesting, following other users based on their profile characteristics and their tweets, as well as posting original content.
A user’s profile page provides a concise description of the user. In addition to displaying the relevant information provided by the user (name, screen name, profile and background pictures, description, location, and web URL), the page provides some useful statistics: number of tweets, number of “friends” (accounts the user is following), number of followers, and number of “likes” (tweets the user has liked). Respective links direct a web surfer to displays of all of the user’s friends, followers, or liked tweets. Finally, the user’s profile page enables various options for displaying all of the (unrestricted) content posted by the user.
Figure 1-2 shows the profile page for Mayor Maria Isabella “Beng” Climaco of Zamboanga City, Philippines. Mayor Climaco’s account name, “Beng Climaco”, and screen name, “Beng_Climaco,” are clearly indicated along with the optional description, location, and URL she provided. Much other relevant information is provided as discussed, in a format that is intuitive and easy to under-stand. The figure also shows that the authenticating user is following Mayor Climaco, so that her tweets will appear on his (my) timeline.
The characteristics and functionality of Twitter as a “micro-blogging” service are designed to enable users to provide real-time updates [80, p. 242]. People use Twitter to share information, report news, keep up with friends, and consume information [73, p. 63]. Observing what information people are sharing, and how it is moving through the social network within the application, could
be useful in attaining situational awareness.
The Twitter API
We have mentioned that collecting data from Twitter is relatively easy through the site’s Repre-sentation State Transfer (REST) APIs. Queries can be sent to these interfaces, which return the results in an easily readable (e.g. JavaScript Object Notation, or JSON) format. Typical data objects returned by the API methods include user profile objects, which contain the user account information (user ID, screen name, name, description, etc.) and statistics (number of tweets, friends, followers, etc.) for a specific user, and status or tweet objects, which contain the unique tweet ID, text, posting time, entities, and user profile associated with a specific tweet.
In order to prevent abuse, the various API methods require authentication and have limits on the rate of requests. Table 1.1 provides a summary of some of the more useful queries, the results they return, and their rate limits.
Table 1.1: Twitter REST API methods, results, maximum results returned per query (RPQ), and maximum queries per 15-minute interval (Limit) [138].
API Method Returns RPQ Limit
Search Tweet objects matching the
query criteria
100 180
Lookup User User profile objects for queried users
100 900
Get Friends IDs User IDs for friends of queried user
5000 15
Get Followers IDs User IDs for followers of queried user
5000 15
1.3
Previous Work
As social media applications have become pervasive over the past two decades [107, p. 9], research related to social media has also become quite common. Some efforts focus on characterizing and quantifying different aspects of the social networks that grow within these applications. Much research has dealt with how social media has played a role in political and social uprisings. There has also been substantial effort in investigations into how extremist groups, such as the Islamic State in Iraq and Syria (ISIS), have made use of social media as a recruiting and propaganda tool. People have examined how social media can be used to monitor significant events, such as disasters
or protests, in real time, and many of these and other efforts have aimed to employ social media data also as a predictive tool. In this section we provide a survey of some of the recent research activities dealing with social media and their findings.
1.3.1 Social Networks
Sociologists have shown that social networks have played an important role in human societies for centuries [110]. Increases in technology-based connectivity in societies in recent decades has generated increased interest in researching social networks. Some of this work has focused on producing social network generative models that produce networks that are similar to observed social networks. Erdős and Rényi [51] provided a well-known foundation for contemporary network analyses with their random graph model. Many variations, adaptations, and extensions of the random graph model have now been developed. For example, the preferential attachment model [10] has become one of the more popular tools in representing social network formation in recent years. This generative model assumes that new vertices entering the graph connect to higher-degree vertices with higher probability. The authors show that this model naturally leads to a scale-free degree distribution, which closely approximates the empirical degree distributions often found in studied networks.
Community Formation Detection
Another aspect of social networks that has been observed empirically is that they tend to be tightly clustered, which has led to the development of several measures of this phenomenon (e.g. average clustering coefficient) [72, p. 34]. This clustering could be at least partially explained by homophily, i.e., the tendency of edges to form between vertices that are similar in some way (e.g., people of the same ethnicity), which has also been extensively documented empirically [50, pp. 77-84]. Backstrom et al. [8] use empirical social network data to show that community formation growth depends on underlying network structure.
However, identifying and characterizing the community structure in a social network is not a well-defined problem, while the building blocks of such a characterization, e.g., finding cliques in a network, are computationally complex operations [53]. Several techniques have emerged to address the community detection problem. Because community detection is an unsupervised task, tradi-tional unsupervised learning methods are often applied. Hierarchical methods, both agglomerative (bottom-up) and divisive (top-down) have been applied, but do not scale well and can be prone to
missing underlying community structures that are not hierarchical in nature [53, p. 93].
Newman and Girvan [106] discuss divisive clustering methods on graphs using various criteria (edge betweenness measures) for ordering the sequence of edge removal. As edges with high be-tweenness measures are removed from the network, the network begins to separate into separate components, which form the communities. The authors use this process to find the community structure that maximizes graph modularity, a metric they develop to measure the quality of a particular network division in terms of its community strength.
Latent variable methods have also been applied to the community detection problem. Airoldi et al. [3] suggest a mixed membership stochastic block model, and propose an algorithm for learning block (or group) memberships. Membership models have been shown empirically to explain some of the community structure in social networks [24] and have been used in network generative models as well.
One of the canonical examples of community formation in social networks is from Zachary [152], which presents an in-depth analysis of the fracturing of a social network along ideological lines. While dated, this analysis provides a motivating example for our work, as it demonstrates how social network structure and evolution over time can serve as indicators of real world events, ideological group formation, and social upheaval. Our problem is to obtain this information from social media data, which is inherently different than the data used by Zachary to construct his famous Karate Club network.
Information and Adoption
Closely related to the study of social network structure is the study of how information and adoption of behavior spreads through a social network. In addition to providing a detailed analysis of the changing structure of the Karate Club, Zachary [152] discusses at length the implications of the structure of the social network on the flow of information.
An interesting structural property concerning the flow of information that has been observed in social networks is what has been termed the “small world” phenomenon, in which randomly selected people (nodes) in very large social networks are typically connected by relatively short paths. Milgram famously studied this property in the 1960s [101, 74]. More recently, Watts and Strogatz [146] and Kleinberg [83] have proposed generative and information models that help explain how social networks might come to exhibit this property and how individuals are often able to use it to transmit a message to another person to whom they have no personal ties.
Other research has focused on the spread of information, ideology, and behavioral adoption, often termed diffusion, throughout a social network. A common approach is to apply disease contagion models, such as the susceptible-infected (SI)model or the susceptible-infected-recovered (SIR) model to represent how information propagates through a social network [72]. Many adaptations of this fundamental approach have been proposed and studied in the context of diffusion in social networks.
One of the general classes of diffusion models are linear threshold models, in which an individ-ual in a network deterministically receives information, or adopts a certain ideological position or behavior, once the fraction of the individual’s neighbors that have adopted the behavior exceeds a given threshold [66].
Another class of models takes a probabilistic approach, in which an individual becomes infected in each discrete stage according to a probability that depends on the number of infected neighbors the individual has [62]. Gomez Rodriguez et al. [63] use this approach to infer a social network based on observations of information diffusion or adoption behavior.
Dow et al. [46] provide an empirical study of how a small proportion of user-generated content propagates quickly over large social networks, or “goes viral,” while most does not spread beyond a small subgraph. Another study by Yang et al. [148] employs semi-supervised learning with some success to predict how users will propagate information by “retweeting” other users’ content on Twitter. Cheng et al. [32] show that the “shape” of the overall diffusion of a topic in social media can be predicted based on characteristics of its initial spread.
Influence
In the course of studying diffusion, it is natural to also investigate which people within a social network are the most influential, i.e., would have the most impact on propagation of information or adoption throughout the network. Because finding influential people has many applications, such as marketing and politics, much work has been done in this area. Kempe et al. [79] investigate the problem of determining the most influential nodes in a social network using both the context of linear threshold models and probabilistic cascade models of diffusion. Pei et al. [112] provide an empirical look at different measures of influence in the context of information diffusion, finding in some cases that the underlying graph structure can be misleading. Shah and Zaman [128] introduce a metric for detecting an information source given propagation information.
1.3.2 Social Media
The transition to Web 2.0 and the rise of social media have provided rich sources of data that is difficult to concisely characterize. Embedded in social media applications are network structures: the ability of users to connect to one another has been proposed as a defining characteristic of social media [108, p. 2]. Much research has treated these networks as observable social networks, but not all agree. Couldry and van Dijck [36] provide an interesting principle-based argument for why social media is not at all “social” in a traditional sense. Ariel and Avidar [6] conduct a similar inquiry with a less pessimistic approach, and conclude by admonishing researchers to always investigate the interactive social nature of social media applications, rather than assuming them. Furthermore, structural phenomena such as “condensation,” in which a single “superstar” vertex obtains a positive fraction of the edges in a graph, have been observed in online social media networks [17] but do not easily translate to real-world social networks.
Situational Awareness and Understanding
Many varying applications of enhancing situational awareness using social media, and especially Twitter, have been investigated. Examples include tracking earthquakes [37, 124], visualizing events through geotagged photos [103], tracking the spread of infectious diseases [29, 102], and monitoring natural disasters, emergencies, and emergency relief operations [145, 116, 150, 65].
Other studies have focused on more subtle elements of situational awareness. For example, Java et al. [73] analyze why people use Twitter and investigate underlying community structures. The authors assert that this information could be beneficial to Twitter in developing new features and retaining users. In this case, user-generated content is analyzed to infer invisible characteristics of a population, rather than visible events and activities.
The use of social media data and analyses to attain situational awareness have led to ethical implications in some cases. Lory [95] investigates the ethical implications of using Facebook accounts to recruit and evaluate prospective job applicants. In some cases, employers were even asking candidates for their social media passwords, a practice that led to many states enacting laws banning such practices [39]. In mid 2016, Twitter suspended U.S. Intelligence agencies’ access to data collected by Dataminr, Inc., because the social media provider did not want its data used for government surveillance purposes [133]. Even more recently, Facebook and Twitter cut off data access to Geofeedia, a firm that inferred user location based on user-generated content and network
structure, citing similar concerns [135]. Some work has been done in investigating the ethics and legality of these uses of social media [57], while governmental organizations have been developing official social media policies (e.g., [109]). These cases serve as a caution on the ethical implications of our work, which must be careful to maintain privacy and adhere to social media site terms of use.
We now review some of the relevant literature on social media in specific contexts relevant to our problem. We include research explicitly focused on deriving situational awareness from social media, as well as investigations into the role social media plays in shaping real-world events. We include research in the latter category because it could provide additional insights into how social media could be of use in enhancing situational awareness.
Political Polarization, Unrest, and Conflict
Even before the transition to Web 2.0, several studies had observed that, given the freedom to do so, people tended to self-segregate into homogeneous groups (e.g., see [18]). Rosenau [121, p. 17] and others have suggested that the unprecedented connectivity enabled by new technologies have increased the fragmentation and polarization in society, making it easier than ever for a person to connect with and mobilize other like-minded people.
Nissen [107] provides an in-depth analysis of the role social media has played in armed conflicts since the 1999 Kosovo War. Several authors have analyzed how social media was used to catalyze the 2011 Egypt Revolution and the Arab Spring uprisings [81, 131, 49, 4, 126, 42, 28]. Others have examined the utility of using social media to track ongoing conflicts. Carley et al. [30] outline a procedure for obtaining real-time information on developing crises using Twitter and open source media, using the 2012 attack on the U.S. Consulate in Benghazi, Libya as a case study. Starbird et al. [132] employ a collaborative filtering technique to identify social media users who are physically present during mass disruptions.
Other work focuses on using social media as a means to track and quantify underlying controver-sies and conflicts within a population. Marres and Moats [98] give an assessment of the usefulness of social media in analyzing controversy. Romero et al. [120] explore how controversial topics have different diffusion patterns than non-controversial topics in Twitter. Many case studies have looked at how specific causes have evolved on social media, e.g., [70]. Seo et al. [127] use community de-tection on topics to determine how polarized a population is, using tweets collected during the 2011 Egypt Revolution as a case study.
Terrorism & Law Enforcement
In addition to studies on how social media can be used to influence, identify, and track controversy, unrest, and conflict, much work has investigated social media’s potential in law enforcement and terrorism applications. Nauta [105] proposes a method for using Twitter to locate and track a person of interest, Peters [114] suggests using social media as a nation-wide reporting system for suspicious activity, and Fresenko [54] analyzes the utility and challenges associated with standing up government-operated social media analysis centers for law enforcement purposes.
The rise of the Islamic State in Iraq and Syria (ISIS) has directed much attention at the role social media can play in both spreading and combating terrorism. Ressa [118] alludes terrorist groups’ use of social media prior to the formation of ISIS. Berger [13] and Klausen [82] provide empirical analyses of ISIS’s use of Twitter to recruit, garner support, propagandize, and intimidate. Alpern and Lidbetter [5], and Benigni and Carley [11], provide methodologies for finding, detecting, and monitoring online terrorists. Meanwhile, social media sites such as Twitter continue to suspend accounts that promote violence and extremism [1].
1.4
Situational Awareness and Intelligence
Our research goal is to exploit social media data in ways that are useful in the context of situational awareness. In this section we provide a very brief overview of situational awareness in the context of military operations.
The notion of situational awareness, sometimes referred to as situational understanding, is ubiq-uitous in military operations, but has applications in politics, emergency response, and many other areas. Describing the operational environment is accomplished through military intelligence [143, p IV-5], with the primary objective of reducing uncertainty by “providing accurate, timely, and relevant knowledge about the threat and surrounding environment.” [144, p. 1-1]
The military defines the operational environment as “the composite of the conditions, circum-stances, and influences that affect the employment of capabilities and bear on the decisions of the commander.” U.S. military intelligence doctrine applies a “holistic” view to understanding the oper-ational environment that encompasses physical areas and factors and the information environment [142, p. I-2].
Achieving situational awareness is more than just possessing data or information [144, p. 1-3]. Figure 1-4 provides a depiction of the information hierarchy, and suggests a process by which
data and information are collection, analyzed, and transformed into situational awareness that is ultimately used in decision making. In the military, this process is known as the intelligence cycle [144, p. 1-3] or intelligence process [142, p I-5]. Our intent is to contribute methods that enable the processing of social media data into useful intelligence.
Figure 1-4: The information hierarchy, taken directly from [144, Figure 1-1, p. 1-3].
1.5
Thesis Organization
Chapter 2 presents the formulation of the social network search problem, described in the context of drawing marbles from urns. This chapter provides a derivation of general necessary conditions for optimal search policies as well as a complete characterization of the optimal policy in two specific cases. Technical proofs of our optimality conditions and other findings are included at the end of this chapter.
Chapter 3 introduces the ISIS dataset and provides multiple analyses on this data. These analyses address several problems: identification of extremist accounts within the data, identification of multiple accounts belonging to a single user, prediction of individual user networking behavior
when opening a new account, and finding a new Twitter account belonging to a specific user. This final effort applies the optimal search policies found in Chapter 2, and includes analysis of performance using the ISIS dataset.
Chapter 4 presents a collection methodology and factor graph classification approach to obtain-ing a set of users belongobtain-ing to a specific group or location. Collections of users from nine population centers and one ideological group are performed and evaluated.
Finally, Chapter 5 provides some final comments on future work and applications, concluding this thesis.
Chapter 2
Optimal User Search in Online Social
Networks
In this chapter, we analyze the problem of searching a social network for a particular target in-dividual by sequentially examining the neighbors of other known users. Social media applications enable users to connect with each other, forming social networks. For different reasons which we will discuss, one may wish to find a target individual in the social network. One may have prior knowledge that the target individual is connected with a set of known users, and so the most logical place to begin searching is the neighbors of these known users. If querying each of these neighbors incurs some sort of cost, then the goal would be to find the target with as few queries as possible.
2.1
Background and Motivation
Suppose Mary is searching a social media application for an account belonging to John, an old friend from school with whom she has lost contact. From what she knows about John, Mary might be able to develop a list of accounts she knows about within the social media application to which John’s account might be connected. For example, she might recall that John was good friends with Matt, who has a social media account that is known to Mary. She also might remember John was active in a certain charity, which also maintains a social media account known to Mary.
After developing such a list, Mary could sequentially explore each account’s connections, but doing so could take a substantial amount of time. In order to find John’s account quickly (assuming John has an account), Mary might devise a search strategy. For example, she might start by looking at accounts she feels are the most likely to be connected with John’s account. Alternatively, she
might start by looking at accounts with fewer connections, because her goal is to find John’s account while minimizing the time spent exploring.
In this hypothetical scenario, what Mary is doing is an example of a network vertex search in which the sought object, or target might be found by examining the neighbors of a finite set of known vertices. Once the search target is found, the search typically terminates. Each known vertex 𝑖 might have a different degree, 𝑁𝑖, requiring a different number of search queries to exhaustively search.
From our scenario, we also consider that each known vertex 𝑖 might have a different probability of being connected to the target vertex, which we denote as 𝜙𝑖.
This scenario motivates our probabilistic “multi-urn” search model for finding users in social networks, in which we represent each known vertex as an urn containing a finite number of marbles. Each marble in an urn represents one of the respective vertex’s neighbors. The search consists of successively drawing and and examining individual marbles from the urns with the goal of finding a red marble, representing the search target, in the fewest number of draws. Figure 2-1 depicts the multi-urn model for a network search on three known vertices. In this example, each of the known vertices is connected to the search target, so each urn contains a single red marble. Additionally, each urn contains a number of blue marbles that represent the other neighbors belonging to each respective vertex. Employing a dynamic programming framework, we provide some insight into the optimal search policy in this general model and give an explicit characterization of the optimal policy under certain conditions.
A B C A B C Target NA=3 NB=2 NC=3
2.1.1 Application
Our model applies to any scenario where one must sequentially search for the target amongst a set of entities which are separated into different clusters. In our vertex search problem, the entities are vertices and the clusters are neighborhoods of the known vertices. Our main motivation for this model is in social media applications where many times the goal is to find users who harass others, incite violence, or engage in other dangerous behaviors. Twitter has been suspending large numbers of users, many of which support or engage in violent extremism, from its micro-blogging application for violating the site’s published rules [67]. The challenge is that these users can simply create a new account each time one is suspended. However, from historical data Twitter could predict the accounts to which the suspended user is likely to connect. Using this information, Twitter administrators could then apply our optimality criteria to efficiently locate new accounts belonging to suspended users.
There are other scenarios where this model can apply. For instance, for law enforcement and intelligence applications, the search entities could be suspects in a crime and the clusters could be geographical locations. Or if one is examining a dump of emails from a suspect’s server, one may be looking for an incriminating email, so the entities are emails and the clusters could be recipients of the emails. In both of these examples, the process of querying the entities requires a non-trivial amount of resources (interviewing a suspect, reading an email), so it is important to find the target as quickly as possible. Using an optimal or near-optimal search strategy is therefore crucial in these examples.
2.1.2 Previous Work
Much of the work that has been done in the context of network search is focused on finding relevant vertices in a large scale network. Google’s PageRank algorithm is probably the most well known example of these methods, of which many adaptations and generalizations exist [15]. Our work looks at an essentially different type of network search: one of finding a specific vertex in a network, presumably identifiable by certain features, by investigating network neighborhoods in which the vertex is likely to appear.
Our network vertex search problem is more closely related to classical search problems in oper-ations research. Black [19] poses a simple search problem in which the searcher can look in a finite number of locations, each of which has a search cost, a probability of containing the target, and a
known “miss” probability of not finding the target upon searching the location, given the target is there. These probabilities are assumed to be stationary.
Black’s method and findings somewhat parallel ours, although our network vertex search requires substantially different assumptions. For one, the probability of finding the target vertex neighboring a certain known vertex changes with the number of times it has been searched, and the known vertex’s neighbors can eventually be exhausted. Also, the target can be found neighboring more than one of the known vertices in the network, and therefore might be found in multiple “locations” in our network vertex search.
Physical network search problems are also addressed in the literature. These typically differ from Black’s search model, as well as from the network vertex search we propose, by applying network flow constraints to the searcher and the target. Dagan and Gal [38] provide such a model in which the search target is assumed to be “hiding” at a stationary point (not necessarily at a vertex) in a network. The searcher in this problem chooses his starting point, and then choses a search path with the objective of minimizing expected time to find the target. This model is related to the well-known Chinese Postman Problem, which involves finding the minimal cost path that traverses every edge in a network.
[93] considers a more general search model that consists of 𝑘 balls (targets) hidden among 𝑚 boxes, an approach that closely resembles our development. In this approach, the objective is to search the boxes in an order that minimizes the expected cost of finding all 𝑘 distinct objects. In addition to providing relevant theoretical results on optimality under their modeling assumptions, the authors show that in this search problem, as in ours, there is no benefit to making decisions based on previous search results. The authors also relate this problem to other work on physical network search, specifically their findings on expanding searches [5].
Similar to the early model proposed by Black [19], the network vertex search problem we propose has many of the characteristics of the well-studied multi-arm bandit problem. Bubeck and Cesa-Bianchi [27] provide a broad survey of many variations of the multi-arm bandit problem and their respective applications. These problems are typically likened to a gambler who has a choice of playing from a set of slot machines. At each discrete stage in the process the gambler selects and plays a slot machine for a certain cost and receives a stochastic reward from an unknown distribution. The more times the gambler plays a particular machine, the more he is able to learn about its reward distribution.
low-payout slot machines just to learn their reward distribution. This quandary is the fundamental trade-off between exploration and exploitation, which is inherent in multi-arm bandit problems. In order to make money, the gambler wants to play only the highest-payout slot machine. However, he never really knows the true distributions of any of the machines. As a result, optimal multi-arm bandit policies often include a balance of exploratory actions, in which decisions are made for the sole purpose of observing outcomes, and exploitative actions, in which decisions are made to optimize the outcomes based on what has been learned.
The multi-arm bandit problem objective is often characterized as the minimization of regret, which is essentially the difference in expectation between what the gambler earns and what he would have earned by playing the best machine. Lai and Robbins [88] provide a very well-known method for constructing adaptive multi-arm bandit policies using upper confidence bounds, for which regret grows proportional to the logarithm of the number of plays in the limit. Auer et al. [7] show that this same bound on regret is also achievable in finite time.
The multi-urn search model we present could be cast in the context of a finite time multi-arm bandit problem, but there are a few notable differences. Our objective, to find the search target as quickly as possible, does not immediately cast itself as minimizing regret. Gittins [60] overcomes this difficulty by augmenting the state space in the multi-arm bandit formulation with a “success” state, from which no additional costs or rewards are incurred. Building on this adaptation, Gittins describes a class of search problems that are very similar to our network search problem, and characterizes the optimal search policy based on his well-known dynamic allocation index [59].
Our search problem differs from that of Gittins [60], however, in that each vertex has a fixed, finite, and known number of neighbors. In essence, we assume the reward distribution of each slot machine is known, and we only allow a fixed, finite number of plays on each machine. Unlike the bandit approach, the outcomes of successive marble draws from a single urn are not assumed to be independent observations from an unknown distribution. Instead, our model uses a known distribution on each machine but limits each machine to allowing at most a single win. Furthermore, in our approach we allow for dependencies between the urns, whereas the multi-arm bandit approach typically assumes each slot machine’s outcomes are independent of the others.
In spite of these differences, the dynamic allocation index applied in the class of search mod-els proposed by Gittins [60] has many similarities to our development. The system dynamics in both cases are governed by Bayesian probability updates. We show that in at least two cases the optimal policy can be characterized by a priority index, which is derived directly from the system
dynamics and can be interpreted as the expected rewards of decisions. Gittins [60] also mentions monotonicity properties of his dynamic allocation index in the context of search that are similar to the monotonicity properties we derive. Our method for proving optimality uses similar logic to the proofs given by Frostig and Weiss [56], which are based on the original development by Gittins and Jones.
Like multi-arm bandit problems, urn models have been applied in many contexts, including discrete decision processes. The Pólya urn process is a well-known construct using urns that has been adapted and used in many applications [96]. This process generally consists of one or more urns, each containing certain numbers of marbles of different colors. At each stage in the process a marble is randomly drawn from an urn and its color observed. This color then dictates an action involving placing one or more marbles of certain colors into certain urns.
Wei [147] provides a specific adaptation the Pólya urn process to the problem of conducting medical trials in a way that is meant to exploit the use of treatments that have shown positive results in the past, which is very similar to multi-arm bandit models applied in the same context. The Pólya urn process has also been used as a preferential attachment model in the formation of networks [34]. This application can be useful in considering how links form in social networks, and is similar to our problem. We assume, however, that the links are already present in the network and are instead interested in finding the optimal way to investigate these existing links.
Downey et al. [47] employ a multi-urn model that is very similar to ours but serves a different purpose: unsupervised information extraction. The model these authors propose uses urns to repre-sent different collections of documents. Marbles drawn from the urns reprerepre-sent specific documents, from which specific labels are extracted. The objective of the model is to learn which labels are the correct, or “target” labels, and which labels are erroneous extractions.
The urn model proposed by Downey et al. [47] differs substantially from ours in its objective. Downey et al. have the objective of learning model parameters and, in the unsupervised case, learn-ing which labels are correct. In the urn model we present, we assume the probability distributions and the target labels are known a priori, and we aim to to find a target marble as efficiently as possible.
Our network search problem is also related to the problem of mutual information maximization. If our goal was mutual information maximization, we would not necessarily focus our search effort on trying to find the target vertex. Instead, we would examine the places that would give us the most information about where the target is likely to be. This is similar to the goal of exploration in the
multi-arm bandit problem. Chen et al. [31] analyze a sequential information maximization problem that parallels our development, using a dynamic programming approach and giving bounds on the performance of the greedy approach. The problem the authors propose involves learning about the distribution of an unknown parameter of interest by sequentially observing other variables. Each observation provides some information about the unknown parameter, and the objective is to maximize the total information gained in a fixed number of observations.
Our multi-urn search model departs most substantially from the development of Chen et al. [31] by imposing additional constraints and dynamics in the way observations are made. In our model, the urns are depleted over time, changing the amount of information contained in each successive marble drawn in predictable, but sometimes unintuitive ways. Our main contributions in this chapter are the characterizations of optimal search policies under various probability models, which come directly from analysis of the dynamics inherent in our multi-urn search model.
Finally, recent work in scheduling and inspection policies employ similar dynamic programming approaches to characterize optimal policies. Levi et al. [91] use dynamic programming to find policies that optimally allocate resources between information gathering and task execution. This class of models provides a natural extension to our network search problem. While we assume a probability model on a set of known vertices, using this approach we could attempt to find the optimal balance between the time spent learning a probability model on a set of known vertices and the time spent executing the search on the current known vertex set.
2.2
Multi-urn Search Model
We return to the context of network vertex search as presented in the introduction. We make the following assumptions:
∙ We have a known set of users, or vertices in the social network, which might be connected to
the target user. Let 𝒱 be this set of vertices.
∙ We know the number of connections each user in set 𝒱 has. In other words, we know the
degree of each vertex 𝑖 ∈ 𝒱. Let 𝑁𝑖 be the degree of user 𝑖. This is the number of search
queries required to exhaustively search through all of 𝑖’s connections.
∙ If we have not executed a query to examine a particular neighbor of user 𝑖 ∈ 𝒱, then we have
no information about that neighbor.
∙ The neighbors of each vertex are queried in a random order, so that each individual neighbor
query of a particular vertex is equally likely to be the search target, given that the target is connected to the queried vertex.
∙ We have a probability model that quantifies our belief that our search target is connected to
each user 𝑖 ∈ 𝒱.
∙ The target user’s account is immediately identifiable to the searcher, i.e., there is no
uncer-tainty when examining a user account as to whether or not the account belongs to the target user.
Under these assumptions, we can represent this search problem as an experiment involving randomly drawing marbles from a set of urns, where each urn represents a known vertex in the network. Each marble in urn 𝑖 ∈ 𝒱 represents a neighbor of vertex 𝑖. The degree of vertex 𝑖 is 𝑁𝑖,
so urn 𝑖 initially has 𝑁𝑖 marbles. With probability 𝜙𝑖 > 0, exactly one of the 𝑁𝑖 marbles in urn 𝑖
is red, indicating that known vertex 𝑖 is connected to the target vertex. Otherwise, all marbles in all urns are blue.
Querying a random neighbor of vertex 𝑖 in search of the target is analogous to drawing a random marble from urn 𝑖 and observing its color. If the marble is red, the target vertex has been located. If the marble is blue, the target has not been found and the search continues with the remaining marbles. Note that blue marbles are not put back into the urns; once they are drawn they are discarded. Just as Mary desires to find her old friend John with as few searches as possible, the goal in this experiment is to minimize the number of blue marbles drawn, or neighbor queries executed, before finding the target.
We now more completely specify the probability model that accounts for how the target vertex might be connected to the set of known vertices, i.e., how red marbles might be distributed among the urns. Let 𝐴𝑖 be the event that the target vertex is connected to vertex 𝑖. We have already defined
𝜙𝑖= P(𝐴𝑖).
More generally, we let
𝜙𝑈 = P (︃ ⋂︁ 𝑖∈𝑈 𝐴𝑖 )︃
be the probability that the target vertex is connected to all vertices in set 𝑈 ⊆ 𝒱. If we were to assume that the target would connect to the members of 𝑈 independently, then 𝜙𝑈 = ∏︀𝑖∈𝑈𝜙𝑖.
In general, the connections might not be independent. For example, Mary might think that if John connected with a certain musician he liked, he might be more likely to connect to other, similar musicians. In other cases, a connection to a particular vertex might imply a decrease in the probability of connection to another vertex.
In our urn model, we assume a known probability 𝜙𝑈 for all subsets {𝑈 : 𝑈 ⊆ 𝒱}, which fully specifies a probability model on the locations of the red marbles among the urns. It allows for arbitrary correlations between urns, so that the presence of a red marble in one urn (or subset of urns) can have a positive or negative correlation with the presence of a red marble in another urn (or another subset of urns).
We note now that the empty set ∅ ∈ {𝑈 : 𝑈 ⊆ 𝒱}. By convention, we set ⋂︀
𝑖∈∅𝐴𝑖 = Ω, so
that 𝜙∅ = 1. This term is implicitly included in summations over all subsets expressed in our development. For example, the summation
∑︁
𝑈 ⊆𝒱
(−1)|𝑈 |𝜙𝑈
includes a “1” corresponding to the case in which 𝑈 = ∅.
Given this set of probabilities, the probability of any specific outcome of marble locations, or vertex connections, can be determined using the well-known inclusion-exclusion formula. For example, suppose we are interested in the probability that the marble is located in all of the urns in set 𝑈 and no other urns. This event can be written as(︀⋂︀𝑖∈𝑈𝐴𝑖)︀ ∩
(︁ ⋂︀ 𝑗∈𝒱∖𝑈𝐴𝑐𝑗 )︁ , with P ⎛ ⎝ (︃ ⋂︁ 𝑖∈𝑈 𝐴𝑖 )︃ ∩ ⎛ ⎝ ⋂︁ 𝑗∈𝒱∖𝑈 𝐴𝑐𝑗 ⎞ ⎠ ⎞ ⎠= ∑︁ 𝑆:𝑆⊆𝒱, 𝑈 ⊆𝑆 (−1)|𝑆|−|𝑈 |𝜙𝑆≥ 0. (2.1)
We refer to the type of search described in this section as a multi-urn search problem which we now more formally define.
Definition 1. A multi-urn search problem is a search problem that can be modeled as sequentially drawing marbles from a set of urns, 𝒱, where
1. The objective of the searcher is to find a red marble with as few draws as possible.
![Figure 1-1: Growth in the number of Internet users 1995–2016 [71].](https://thumb-eu.123doks.com/thumbv2/123doknet/13988502.454846/19.918.245.649.357.741/figure-growth-number-internet-users.webp)
![Figure 1-2: A screen capture of the profile page for Mayor “Beng” Climaco of Zamboanga City, Philippines [141].](https://thumb-eu.123doks.com/thumbv2/123doknet/13988502.454846/21.918.197.725.581.882/figure-screen-capture-profile-mayor-climaco-zamboanga-philippines.webp)
![Figure 1-3: Example Tweet from the Boston Globe [141].](https://thumb-eu.123doks.com/thumbv2/123doknet/13988502.454846/23.918.278.643.97.545/figure-example-tweet-boston-globe.webp)
![Table 1.1: Twitter REST API methods, results, maximum results returned per query (RPQ), and maximum queries per 15-minute interval (Limit) [138].](https://thumb-eu.123doks.com/thumbv2/123doknet/13988502.454846/25.918.213.707.580.764/twitter-methods-results-maximum-results-returned-maximum-interval.webp)
![Figure 1-4: The information hierarchy, taken directly from [144, Figure 1-1, p. 1-3].](https://thumb-eu.123doks.com/thumbv2/123doknet/13988502.454846/32.918.182.738.237.689/figure-information-hierarchy-taken-directly-figure-p.webp)