A Decentralized Mechanical Ventilation System with Heat
Recovery: Experimental Assessment of Thermal Comfort and
Pollutant Removal Ability
Youness Ajaji
#1, Philippe André
#2 #Department of Environmental Sciences and Management, University of Liège 185 Avenue de Longwy 6700 Arlon Belgium
1
youness.ajaji@ulg.ac.be
2p.andre@ulg.ac.be
Abstract
In decentralized mechanical ventilation, air supply being very close to exhaust, a short-circuit from supply towards the extraction point may occur, increasing energy consumption and decreasing air diffusion quality. To estimate this quality together with thermal comfort, we measured in a climatic chamber, thermal comfort parameters and local ventilation effectiveness for temperature, at 12 locations and 3 heights within the occupied zone, for 4 ventilation regimes and 3 thermal configurations of the climatic chamber. We also assessed the system ability to remove carbon dioxide.
The results show that the maximum air velocity measured is 0.12m/s, the predicted mean votes fluctuate from -0.8 to -0.5 and local ventilation effectiveness is from 0.94 to 1. In addition, the decentralized system maintains carbon dioxide concentration below 1250ppm for most configurations tested. The predicted mean votes are quite low because the heating set point is also quite low: 20°C. We conclude that no thermal discomfort can be felt, the system has a great ability to remove pollutants, and the risk that a short-circuit occurs is low.
Keywords - local ventilation; thermal comfort; local ventilation effectiveness; ability to remove pollutant; climatic chamber
1. Introduction
Because of the need to reduce the use of energy, since the mid-1970s and because the energy consumption for maintaining an acceptable environment in buildings constitutes the largest part of the total energy demand in developed countries, several measures have been taken by governments, groups and individuals to reduce the use of energy for heating and cooling buildings [1]. That’s why insulation and tightness of envelope buildings became better. The improvement of envelope buildings tightness involves a strong decrease of natural infiltrations/exfiltrations which contribute to air change of indoor environment, and the necessity of using additional ventilation to bring fresh air to the occupant. The main
advantages of decentralized mechanical systems compared to centralized ones are flexibility as they provide ventilation on demand in each room ensuring a maximum effectiveness and a minimum of energy waste [2], and ergonomics as they are simply installed on an exterior wall or a window frame. Thus they are preferred in residential buildings under renovation. Air supply being very close to exhaust, short-circuiting of the supply air towards the extraction point may occur, decreasing air diffusion quality and increasing energy consumption of the system.
In two previous papers [3, 4] we estimated experimentally this quality together with thermal comfort under isothermal conditions. We concluded that the tested local ventilation prototype achieved a good air diffusion quality for nominal ventilation regime or higher. For low regimes, ventilation was not effective. In this paper we test a new local ventilation prototype with heat recovery (Fig. 1) under non isothermal conditions in a climatic chamber.
A) B)
Fig. 1 A) Previous prototype. Fresh air is pulsed from the upper part of the ventilation system over the entire width while stale air exhaust is performed at the lower part through a grille exhaust, also over the entire width of the machine. B) Current prototype including an air heat exchanger. Fresh air is pulsed at the same height as stale air exhaust is performed.
We assessed thermal comfort within the occupied zone of a ventilated space, we measured local ventilation effectiveness for the temperature distribution within the occupied zone, and we evaluated the ability of the system to remove carbon dioxide emitted by occupants.
2. Methods
2.1 Thermal Comfort
Tests were performed in a climatic chamber the volume of which is 50m3. Thermal comfort was assessed at 12 locations within the occupied zone (Fig. 2). At these 12 locations we measured air velocities using 3 hot-film omnidirectional anemometers. Their measurement range is [0.08; 5m/s] and their accuracy is 0.08m/s. The sensors were placed at 3 heights: 0.8m above the ground, 1.2m and 1.7m. We also measured air temperatures at the same locations as air velocities were measured at 0.6m, 1.2m and 1.7m
above the ground, using 9 thermocouples of which accuracy is 0.1°C, and operative temperatures using 9 globe thermometers. We tested 4 ventilation regimes:
Fig. 2 Local Ventilation, occupant, temperature and air velocities sensors arrangement within the occupied zone of the climatic chamber. The air diffusion device is placed 2m above the ground and 0.5m below the ceiling. The emerging air jet is oriented 10° upwardly.
20%, 40%, 60% (nominal regime) and 100% of maximum fan speed. All sensors were connected to a data analyser. Data were recorded each 10s. Each measurement was recorded for 5min. After each recording we wait for 5min before recording the following measurements until conditions within the climatic chamber can be considered as uniform. We also measured relative humidity using only one sensor. Moreover we performed all tests for 3 different thermal configurations of the climatic chamber. 1. Ceiling heating – set temperature = 20°C + a plexiglas cylinder located between locations 5 and 6 heated by two 65W bulbs to simulate an occupant. 2. Ceiling heating – set temperature = 20°C + a vertical radiant unit over an area equivalent to that of a window, located on the wall below the ventilation system, through which a flow rate of cold water passes in order to represent the thermal behaviour of a window. The cold water maintains the wall at about 16°C. 3. A radiator located below the ventilation system – set temperature = 20°C + the window model. Finally we did 144 tests or 432 measurements (12 locations х 3 heights х 4 ventilation regimes х 3 thermal configurations of the climatic chamber). We assessed PMV (predicted mean votes) and PPD (predicted percentage of dissatisfied) assuming clothing thermal resistance equal to 1clo and activity equivalent to 1.2met. Tests were conducted under semi-winter conditions. For the first
thermal configuration, the lowest temperature of outdoor supply air was 3.1°C and the supply temperature of the air was 11°C. The highest temperature of outdoor supply air was 11°C which corresponds to a temperature of supply air of 18°C. For the last thermal configuration temperatures of outdoor air supply fluctuated from 2.2 to 16.5°C. Moreover, plumes produced by the radiator prevented us from correctly measuring supply air temperature. Indeed we often measured 20°C while the outdoor air supply temperature was much lower.
2.2 Local Ventilation Effectiveness
We measured outdoor air supply temperatures and exhaust air temperatures to assess local ventilation effectiveness for the temperature distribution at the 12 locations within the occupied zone and the 3 heights for the second thermal configuration [1]:
e t p
t
t
t
t
, (1)where te = temperature of exhaust air; t= temperature of outdoor supply air; tp = temperature at a location p. If this effectiveness is much lower than 1, it means that temperatures within the occupied zone are lower than the temperature of exhaust air and air was not well mixed. Or it means that a short-circuit from supply to exhaust exists. On the other hand if the ventilation effectiveness is equal or close to 1 for most measurements, then it means that temperatures are uniform within the occupied zone and there is no short-circuit from supply to exhaust. It’s a good way to assess the thermal comfort quality and to detect the presence of a possible short-circuit. Finally we assessed 12х3х4=144 values of local ventilation effectiveness.
2.3 Carbon Dioxide Removal
We injected a constant flow rate of CO2 for 4h or 8h, within the occupied area between the locations 5 and 6 at 1m above the ground. Then we turned on the ventilation system and we measured the CO2 concentration at locations 6 and 8 at 1.5m above the ground and at 0.6m above the ground. We did 6 carbon dioxide removal tests. 1. Constant injection of CO2: 0.5L/min or 982mg/min (normal volume) for 8h. This is the flow emitted by 2 average people resting. Indeed the rate of production of carbon dioxide by human respiration, G, is related to the metabolic rate by the equation [1]:
where G = CO2 production (l/s); M = Metabolic rate (W/m2); A = body surface area (m2). Two average adults resting produce G = 2 х 4.10-5 х 58 х 1.8 х 60 = 0.5L/min. This production is that of a 2 adults’ bedroom; rest period: from 22h00 to 6h00. For this configuration the ventilation regime was 40%, less than the nominal regime because of the noise that would be generated at rated speed. 2. Same configuration as the previous one but the ventilation system is not switched on. 3. Constant injection of CO2: 1.2L/min or 2.36g/min (normal volume) for 4h. This is the average production of 4 sedentary adults (70W/m2) in a living-room from 18h00 to 22h00 for example. For this configuration the ventilation regime is 60% (nominal ventilation rate). 4. Same configuration as the previous one but the ventilation system is not switched on. For the 4 previous configurations sensors were located 1.5m above the ground. 5-6. For the configurations 3 and 4 we also measured CO2 concentrations at 0.6m above the ground.
We performed all these measurements using 2 non dispersive infrared CO2 sensors (NDIR) designed for HVAC applications. Their accuracy is 50ppm + 2% read value. We only tested the thermal configuration ceiling heating + cold wall modelling a window. The flow regulator used was designed by the technician of the laboratory. Flow measurement is performed by a thermal mass flow meter. The sensor is connected to a Wheatstone bridge and a differential amplifier making the output electrical signal be proportional to the gas mass flow. Finally a PID controller using an electro valve maintains the set point with a 0.2s response time. Measurement ranges are [0; 200mL/min], [200; 1L/min], [1L/min; 10L/min].
3. Results and Discussion 3.1 Thermal Comfort
In this paper we only summarize the main results. The maximum air velocity recorded for the 432 measurements is 0.12m/s at location 4 at 0.8m above the ground. It was for the 100% ventilation regime and the second thermal configuration of the climatic chamber. At this regime the average inlet air velocity is greater than 6m/s. For this thermal configuration we measured 0.1m/s at locations 1 and 4 at 1.2m above the ground. For the first thermal configuration, the maximum air velocity measured was 0.1m/s at location 2 at 1.2m above the ground. The lowest velocities were recorded for the third thermal configuration. Velocities did not exceed 0.09m/s for the 100% ventilation regime and we measured a 0 velocity at locations 12, 8, 9. The plume above the radiator would not favour the diffusion within the occupied area. Most PMV values assessed were in the range [-0.8; -0.5] and most PPD values were in the range [10%; 20%]. This corresponds to the
category 3 of thermal environment quality according to standard ISO 7730 [5]. PMVs are negative and absolute values are quite high because the set temperature in the climatic chamber is lower than that recommended by standard ISO 7730 and the control is performed with respect to the operative temperature measured by a sensor located 2m above the ground. Thus the operative temperatures measured at different heights fluctuate from 17.5 to 20°C. That’s why PMV absolute values are quite high. This does not result from too high velocities. For the nominal regime most velocities are 0. At this regime average inlet air velocity is 4.3m/s.
3.2 Local Ventilation Effectiveness
144 values of local ventilation effectiveness for the temperature were assessed for the 2nd thermal configuration. Fig. 3 summarizes the results.
Fig. 3 Most of the values of local ventilation effectiveness are very close to 1. The mean value for the local ventilation effectiveness is 0.975. The standard deviation is 0.013 and the interquartile range is 0.99-0.98=0.02.
75% of the values are in the range [0.98; 0.99] and we measured 1 for 8 different conditions. So the ratio between exhaust air temperature and air temperature at locations within the occupied area are very close to 1. Distribution of temperatures within the occupied zone is uniform. We can conclude that air diffusion induced by this prototype does not produce any thermal discomfort and no short-circuit can be detected.
3.3 Carbon Dioxide Removal
“The maximum concentration of CO2 for 8h occupation which is
recommended by various ventilation standards is 0.5% although it has been reported and now generally acknowledged that concentration below 0.1% (1000ppm) are required” [1]. In fact, CO2 is not a pollutant but it is often used to control supply outdoor air flow rates because it represents levels of pollution. There are no European standards requiring that 1000ppm not be exceeded or any other value of CO2 in residential buildings. However, for tertiary buildings the EN 13779 standard [6] requires a maximum value of 1000ppm. Furthermore the European standard EN 15251 [7] provides examples of CO2 concentrations recommended for energy calculations in
the case of a modulated ventilation on demand in non residential buildings. The category 3 (800ppm above the outdoor CO2 concentration i.e. 1200ppm) is considered to be an acceptable and moderate level in existing non residential buildings. Thus 1000ppm seems to be a value that should not be exceeded in occupied residential buildings using a decentralized ventilation system. The following graphs (Fig. 4, 5, 6) summarize results of the 6 CO2 removal tests. The 40% ventilation regime, which should apply to bedrooms, corresponds to an outdoor air flow rate of 28m3/h or 0.39l/s.m2 or an air change rate ACH = 0.58h-1. The nominal regime corresponds to 50m3/h or 0.69l/s.m2 or ACH = 1h-1. This regime is designed for the living-room where people can accept a noise level higher than in bedliving-rooms. All removal tests were conducted in the climatic chamber with the door closed. According to climatic chamber air permeability measurements that we had performed according to standard EN ISO 13829 using the fan pressurization method [4], Q4pa = 0.4m3/h/m2 and n50 = 4.17V/h +/- 12.3% for depressurization test and 3.18V/h +/- 11.6% for pressurization test under ΔT = 5°C, where ΔT is the temperature difference between the climatic chamber and the buffer zone around the climatic chamber. We had also assessed the infiltration flow rate using tracer gas method. For the same ΔT it was Qi = 3.36m3/h [4]. However this air tightness corresponds to that of a new building in Luxembourg. This level of tightness is worse than that of a low energy building (1 < n50 < 2h-1) or a passive energy building (0.1 < n50 < 0.6). Thus the climatic chamber conditions can be compared to those of a living-room or bedroom in a renovated building of good air tightness where the door would be closed. Actually doors are often open. So we can expect that actual CO2 concentration levels are slightly lower than those we measured in the climatic chamber.
Fig. 4a The local ventilation maintains CO2 concentration below the acceptable level 1000ppm
for a configuration where emissions are those of 2 people resting for 8h. These measurements were performed at location 8 or 1.5m far from the emission source and at 1.5m above the ground.
Fig. 4b The local ventilation maintains CO2 concentration below the acceptable level 1000ppm
for a configuration where emissions are those of 2 people resting for 8h. These measurements were performed at location 6 or 0.5m far from the emission source and at 1.5m above the ground.
Without any mechanical ventilation CO2 concentration reaches 1100ppm (Fig. 4a) or 1200ppm (Fig. 4b) depending on the proximity of the sensor relative to the emission source, if the production is equivalent to that of 2 people resting for 8h. Since the mechanical ventilation is running at 40% regime (28m3/h), CO2 concentration does not exceed 800ppm (Fig. 4a) or 940ppm (Fig. 4b) depending on the location of the sensor. So the local ventilation system can achieve a good air quality in a 2 people bedroom even when operating at a relative low regime (28m3/h).
Fig. 5a The local ventilation maintains CO2 concentration below 1060ppm for a configuration
where emissions are those of 4 people in a sedentary activity for 4h. These measurements were performed at location 8 or 1.5m far from the emission source and 1.5m above the ground.
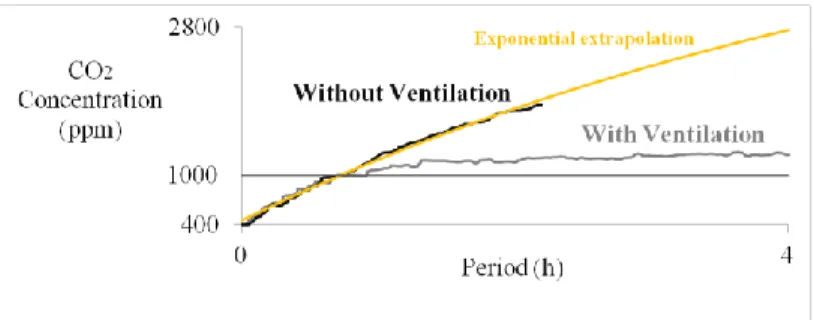
Fig. 5b The local ventilation maintains CO2 concentration below 1250ppm for a configuration
where emissions are those of 4 people in a sedentary activity for 4h. Without any mechanical ventilation CO2 concentration could reach 2800ppm. These measurements were performed at
location 6 or 0.5m far from the emission source and 1.5m above the ground.
Without any mechanical ventilation, CO2 concentration could reach values between 2000 and 2800ppm depending on the proximity of the sensor relative to the emission source, if the production is equivalent to that of 4 people in a sedentary activity for 4h. When the local ventilation is running at nominal regime (outdoor air flow rate = 50 m3/h), CO2 concentration quite far from the emission source reaches 1060ppm after 4h emission and 1000ppm after 3h15 (Fig. 5a). When approaching to the emission source (Fig. 5b), CO2 concentration reaches 1000ppm after 3/4h emission and stabilizes at 1250ppm after 4h and no longer tends to increase. This value is quite good even if it exceeds 1000ppm because tests were conducted under quite extreme conditions (4 people, door closed for 4h). Actually people leave and enter the living-room which would result in a lower production of CO2 and in flow rates between living room and surrounding rooms.
Fig. 6a CO2 concentration measurements at 0.6m above the ground and 1.5m far from the
emission source for a configuration where emissions are those of 4 people in sedentary activity for 4h. Without any mechanical ventilation CO2 concentration could reach 3000ppm. The local
Fig. 6b CO2 concentration measurements at 0.6m above the ground and 0.5m far from the
emission source for a configuration where emissions are those of 4 people in sedentary activity for 4h. Without any mechanical ventilation CO2 concentration could reach 1850ppm after
40min. The local ventilation system maintains the concentration at 1400ppm after 4h. Figures 6a and 6b confirm the results presented in figures 4 and 5. The local ventilation system decreases CO2 concentration from unacceptable levels for indoor air quality to correct levels. They also highlight that the distance from the emission source can contribute to a difference of CO2 concentration which can exceed 240ppm within the occupied area. Comparing figures 5 and 6, we notice the importance of CO2 stratification, especially when ventilation is not running. The use of mechanical ventilation decreases CO2 stratification. Moreover, the distance from the emission source is an important parameter to establish the distribution of CO2 concentration within the occupied area. The standard EN 15251 recommends assessing air indoor quality by using dynamic annual simulations. This kind of simulations assesses one concentration for each room because each room is considered as a node by the model. Thus this method takes into account neither the stratification of CO2 nor the change in concentration as a function of the distance from emission source. Only a CFD simulation can address the issue with sufficient accuracy.
4. Conclusion
With this local ventilation prototype no thermal discomfort can be felt and the risk that a short circuit occurs from supply to exhaust is low. Moreover, the prototype has got a high ability to remove pollutant even if it is running below nominal regime. Lastly, a CFD simulation would allow us to accurately assess the entire distribution of pollutants in a room.
Acknowledgement
The Walloon Region and the Mecatech Centre are gratefully acknowledged for funding this research, which is a part of the project called GREEN+.
References
[1] H.B. Awbi. Ventilation of Buildings. USA and Canada: Spon Press, 2003, 522 pages. [2] C. Aparecida Silva, S. Gendebien, J. Hannay, N. Hansen, J. Lebrun, M. Lengele, G. Masy and L. Prieels. Decentralized Mechanical Ventilation with Heat Recovery. In Proceedings of the 32nd AIVC Conference and 1st TighVent Conference on Optimal Airtightness Performance
– pp. 26-31, Brussels, 12-13 October 2011.
[3] Y. Ajaji and P. André. Ventilation Performance Measurement of a Decentralized Mechanical System with Heat Recovery using Tracer Gas Decay Method. In Proceedings of Healthy Buildings – Article 10G2, Brisbane, Australia, 8-12 July 2012.
[4] Y. Ajaji and P. André. Evaluation de la Qualité de Ventilation d’un Système Double-flux avec Récupération de Chaleur, par la Méthode du Gaz Traceur. In Proceedings of Colloque International Francophone d’Energétique et Mécanique – pp. 221, Ouagadougou, Burkina Faso, 2-4 May 2012.
[5] Standard ISO 7730. 2005. Ergonomics of the Thermal Environment – Analytical Determination and Interpretation of Thermal Comfort using Calculation of PMV and PPD indices and Local Thermal Comfort Criteria.
[6] Standard EN 13779. 2007. Ventilation for Non-Residential Buildings – Performance Requirements for Ventilation and Room Conditioning Systems.
[7] Standard EN 15251. 2007. Critères d’Ambiance Intérieure pour la Conception et Evaluation de la performance Energétique des Bâtiments couvrant la Qualité de l’Air Intérieur, la Thermique, l’Eclairage et l’Acoustique.