HAL Id: hal-01962869
https://hal-imt-atlantique.archives-ouvertes.fr/hal-01962869
Submitted on 20 Dec 2018
HAL is a multi-disciplinary open access
archive for the deposit and dissemination of
sci-entific research documents, whether they are
pub-lished or not. The documents may come from
teaching and research institutions in France or
abroad, or from public or private research centers.
L’archive ouverte pluridisciplinaire HAL, est
destinée au dépôt et à la diffusion de documents
scientifiques de niveau recherche, publiés ou non,
émanant des établissements d’enseignement et de
recherche français ou étrangers, des laboratoires
publics ou privés.
ARCD: a Solution for Root Cause Diagnosis in Mobile
Networks
Maha Mdini, Gwendal Simon, Alberto Blanc, Julien Lecoeuvre
To cite this version:
Maha Mdini, Gwendal Simon, Alberto Blanc, Julien Lecoeuvre. ARCD: a Solution for Root Cause
Diagnosis in Mobile Networks. 14th International Conference on Network and Service Management
(CNSM), Nov 2018, Roma, Italy. �hal-01962869�
ARCD: a Solution for Root Cause Diagnosis in
Mobile Networks
Maha Mdini
∗†, Gwendal Simon
∗, Alberto Blanc
∗, Julien Lecoeuvre
†,
∗
IMT Atlantique
†Exfo
Abstract—With the growth of cellular networks, the supervision and troubleshooting tasks have become troublesome. We present a root cause diagnosis framework that identifies the major contributors (devices, services, user groups) to the network overall inefficiency, classifies these major contributors into groups and explores the dependencies between the different groups. Our solution provides telecommunication experts with a graph summing up the fault locations and their eventual dependencies, which helps them to trigger the adequate maintenance operation.
I. INTRODUCTION
The growing complexity of cellular networks makes the task of supervising the network and identifying the cause of performance degradation more challenging for the network operators [1, 2]. Operators deploy monitoring systems in order to provide an accurate status of the network in real time by generating logs, which can be scrutinized by human experts to identify and address any issues. This analysis is often time consuming and inefficient. Operators would like to increase the automation of this analysis, in order to reduce the time needed to detect, and fix, performance issues and to detect more complicated cases that are not always detected by experts.
The monitoring system generates a large number of log entries (or simply logs), each of them being the report of what happened during a session (e.g. voice call, TCP connection). The log takes usually the form of a series of 2-tuples (feature, value). The feature describes the type of information that is measured (e.g. cell id, content provider), while the value is what has been collected for this particular session (in our example, a number that enables to uniquely identify the cell, the name of a provider). The root cause of a network malfunction can be either a certain 2-tuple, or a combination of k 2-tuples.
Despite an abundant literature on network monitoring, identifying the root cause of problems in modern cellular networks is still an open research question due to its specific requirements: First, a diagnosis system should work on various types of logs (phone, data, multimedia session). Second, a diagnosis solution has to deal with the increasing number of features. Logs can include features related to the service, the network, and to the user. Furthermore, these features can depend on each other due to the architecture of network and services. Third, a diagnosis solution has to address the complex interplay between features. For example, an Operating System (OS) version not supporting a
particular service. Finally, the diagnosis solution should identify and prioritize critical issues.
We introduce in this paper Automatic Root Cause Diagnosis (ARCD), which is a full solution to locate the root cause of network inefficiency. ARCD identifies the major contributors to the network performance degradation with respect to the aforementioned requirements of modern cellular networks. We also present the evaluation of ARCD running in real conditions with three different cellular networks. Our results show that with an unsupervised solution, we can not only carry out the analysis done by experts but we can go to a finer level of diagnosis and point the root causes of issues with high precision.
II. RELATEDWORK
In the vast literature on automatic root cause diagnosis [3], we distinguish two main approaches, depending on whether the diagnosis is implemented by scrutinizing one feature in particular, or by using dependency analysis.
Diagnosis on Isolated Features. This approach considers each feature in isolation, (e.g., handset type, cell identifier, service) applying statistical inference, Machine Learning techniques, or expert rules to identify the elements causing network inefficiency. Some paperss [4, 5, 6, 7] focus mainly on radio issues. Other studies [8, 9, 10, 11] have an end to end view of the network considering only one feature at a time. This approach, while accurate, easily understandable, and manageable by end users (since it compares elements of the same feature with one another), has its limits, because it does not take into account the dependencies between the features. The approaches based on considering one feature at a time have also the obvious limitation of ignoring all the problems caused by more than one feature, such as incompatibilities and causal effects. These induced effects cannot be detected unless one uses dependency analysis. Dependency-Based Diagnosis. Some researchers have focused on hierarchical dependencies resulting from the topology of the network, e.g., the content providers of a mis-configured service having their content undelivered. To identify such dependencies, they rely on the topology of the network and integrate it manually in the solution [12, 13, 14]. In so doing, one may miss some relevant occasional dependencies resulting from co-occurrence or coincidence, e.g., a group of cell phone roaming users (tourists) accessing the same cell. These dependencies are not predictable by the experts.
To explore both hierarchical and occasional dependencies, different statistical methods have been proposed [15, 16, 17]. These studies, while addressing some of the challenges, do not meet all the requirements of a complete diagnosis system previously outlined. On the one hand, the statistical tools employed cannot apply on a vast set of features (more than one hundred in Long Term Evolution (LTE) networks), a majority of them being categorial. On the other hand the authors did not provide a fully integrated solution. With the present work, we introduce a complete diagnosis system.
III. DATAMODEL ANDNOTATION
A. Data Records
Data Records are collected by the network operators to report every mobile communication that is established in the network [18]. A data record contains the technical details of a mobile communication without including its content. We call log an entry in the date records. A log is a series of 2-tuples (feature, value) where the features can be:
Service related such as Mobile Network Code (MNC), content provider.
Network related such as Radio Access Technology (RAT), Mobility Management Entity (MME), cell.
User related such as International Mobile Subscriber Identity (IMSI), handset type.
In a log, every feature is associated with a value. We show in Table I three logs with a few features. In the paper, every value is anonymized. As can be seen here, logs from the same cell (logs 0 and 2) or from the same service (0 and 1) can be tracked. We also show in this table the label feature, which has a binary value, either failed or successful. The label can be either a feature that is directly collected by the monitoring system, or it can be added in a post-processing step, based on the analysis of the values of the log. The label indicates whether the mobile communication was satisfactory or not.
first cell imsi tac service interface label 0 a3d2 97c8 c567 ea52 eccb failed 1 b37a 56ed ce31 ea52 19c4 successful 2 a3d2 fa3e c41e c98e f487 successful
Table I: Example of log entries with a few features
We consider two types of Data Records in this paper: Call Data Record (CDR) the records of voice calls. If a call
is dropped, the CDR is labeled as failed.
Session Data Record (SDR) the records created to track every Internet connection in cellular networks. SDRs are not labeled. However, they include metrics such as data rate and response time.
B. Notation
Let E be a set of logs and f1, f2, ..fn be the features of
the logs. A log x ∈ E can also be represented as a vector x = (x1, x2, ..., xn) where xi is the value of the feature fi as
collected for x. We distinguish in E the set of logs that are
labeled as being successful, noted S, and the set of logs that are labeled as failed, noted F . Since every log is labeled, we have E = S ∪ F and S ∩ F = ∅.
To group the logs that have certain similarities, we introduce the notion of signature. A k-signature s is restricted to k pre-determined features {fp1, fp2, . . . , fpk} where 1 ≤ pi≤ n, ∀i,
and for which the k values {sp1, sp2, . . . , spk} are given. The
parameter k is the order of the signature.
For instance, a 2-signature s that groups all logs issued from a given cell (ab34) from mobile phone running a given OS (b4e8) can be represented as:
((first cell, ab34) , (handset os, b4e8))
A log x ∈ E matches a signature s when spi = xpi ∀i,
denoted as s |= x. The subset of logs of a set E matching a signature s is denoted as E(s) = {x ∈ E|s |= x}. Similarly, we denote the set of failed logs matching s as F (s) = {x ∈ F |s |= x}.
C. Signature and Sets
We now introduce the notations for the set of signatures. In the following, the operator |.| denotes the cardinality of a set. Complementary Signature Proportion The complementary signature proportion π of a signature s is the proportion of logs that do not match s.
π(s) = 1 −|E(s)||E|
Complementary Failure Ratio The complementary failure ratio λ of a signature s is the proportion of failed logs in the data set without considering the logs matching s.
λ(s) = |F |−|F (s)||E|−|E(s)|
IV. OBJECTIVES OF THEDIAGNOSTICSYSTEM
The goal of a diagnosis system is to pinpoint the major contributors to the overall inefficiency of the network (bad Key Performance Indicators (KPIs) such as high porportion of dropped calls). The major contributors are elements (or combination of elements) that are involved in the mobile communication. An element is a couple (feature, value). Network operators consider that a major contributor is an element such that, when we consider all logs except those containing said element, the overall inefficiency decreases. The diagnostic system aims at identifying major contributors. Several challenges make the implementation of diagnostic system hard in practice: First, some elements are highly inefficient (they fail often), however they do not appear in a large number of logs. Second, some elements appear in a statistically significant number of logs, have a high failure ratio, but their inefficiency is extrinsic because of their connection to faulty elements. Last, an element may be incompatible with another one. The challenge here is to identify the combination of the two elements as the root problem and not each one separately.
V. AUTOMATICROOTCAUSEDIAGNOSIS
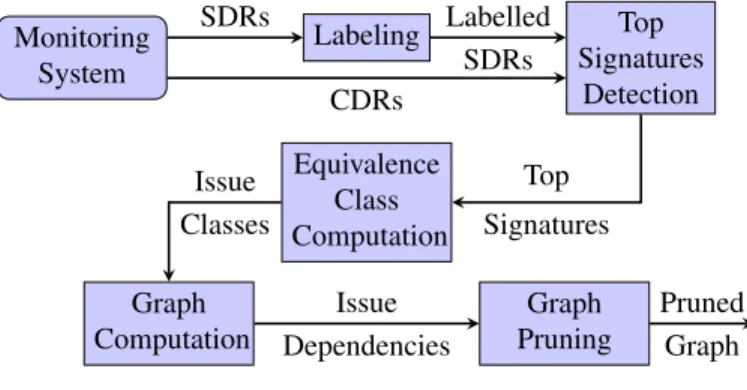
Figure 1 explains how ARCD processes data records to create a graph of dependencies between issues occurring within the network. First, it labels the data if the logs are not already labeled. Then, it identifies the top signatures responsible for the network inefficiency. These signatures are then classified into equivalence classes, which are groups of signatures corresponding to the same problem. Then it generates a graph outlining the dependencies between all the problems. As a last step, It prunes the graph to remove false problems (elements appearing as inefficient because they share a part of their logs with malfunctioning ones).
Monitoring System Labeling SDRs Top Signatures Detection Labelled SDRs CDRs Equivalence Class Computation Top Signatures Graph Computation Issue Classes Graph Pruning Issue Dependencies Pruned Graph
Figure 1: ARCD steps
A. Labeling
The first step consists in labeling the logs. If the data has no success/failure label, we create a binary feature based on standardized criteria specified by 3GPP. In the case of SDRs, we label data based on metrics such as mobile response time, server response time and retransmission ratio.
B. Top Signature Detection
The second step consists in identifying the top 1-signatures contributing to the overall inefficiency of the network. To do so, we start by generating the set of all 1-signatures. Then, for each signature we compute two values: π and λ. The 1-signatures with the smallest values of λ correspond to the “major contributors”: removing all the logs belonging to these signatures results in smallest overall failure ratio for the remaining logs. Some of these signatures contain a significant fraction of the logs in the system, for instance because the 1-signature corresponds to a device that handles a lot of traffic with a slightly higher failure ratio than the remaining of the network.
There is a trade-off between inefficiency and significance on the network. π indicates whether a 1-signature matters. The larger π(s) is, the less common is the signature s. On the one hand we want signatures with the smallest values of λ but not if the corresponding π is too small. We address this by maximizing a linear combination of these two values:
ν(s) = π(s) − αλ(s)
where α is a tunable parameter. Larger values of α correspond to the “major contributors” (matching many logs), while smaller values make the focus on “weak signal”, i.e., signatures with fewer matching logs but whose failure rate is high. To have a robust solution, we use several values of α. For each α, we compute ν for each 1-signature and we take the twenty signatures with the largest values of ν (“top twenty”). We then compute how many times one of these signatures is in a top twenty. A signature that appears often in the top twenty corresponds to a potential problem. We complete this step by taking the fifty signatures that appear more often in the top twenty. However, we cannot stop here because some of these 1-signatures could correspond to the same underlying problem. That is what the following step addresses.
C. Equivalence Class Computation
This step consists in grouping signatures related to the same problem. As an example, consider a user connecting to a cell, where he is the only active user, with a uncommon handset type. If the user experiences many consecutive bad sessions, the resulting logs are labeled as failed. In this case, the corresponding IMSI, handset type, and the cell id point to the same problem and have to be grouped into one 3-signature. In general, two signatures are equivalent when they cover approximately the same logs. As an aside, we cannot determine the causal relationship between the features and the failure (in our example the phone type, the IMSI or the cell could be the cause of the failure, or any combination of these three). The outcome of this step is classes of signatures, where each class denotes one problem.
D. Graph Computation
A hierarchical dependency is another case of multiple signatures corresponding to the same underlying problem. For instance, a Base Station Controller (BSC) connected to faulty cells could appear as inefficient. In order to highlight these dependencies, we create a graph to model the dependencies between equivalence classes. Equivalence classes are presented as the nodes of the graph. A node s1 is
a child node of a node s2 if the logs covered by s1 are
approximately a subset of the logs covered by s2. To have a
human readable graph, we use Depth-first Search algorithm to find all the paths between every pair of connected nodes and then we keep only the longest path. The output of this process is an acyclic directed graph.
E. Graph Pruning
To prune the graph and keep only valuable information we use two main rules:
• A child node is removed if it is not more inefficient than at least one of its parents. This way, we keep only the root of the inefficiency which is the parent.
• A parent node is removed if by removing the logs covered by one of its children, its inefficiency drops below the
overall network inefficiency. In this case, the child node is the root of the problem
Each time we remove a node, we connect its ancestors to its successors. The pruning process is repeated until convergence.
VI. EVALUATION
A. Data Sets
We applied ARCD to data sets from three different operators:
Set 1: 25 000 SDRs from a European country.
Set 2: 10 million SDRs from another European operator. Set 3: 1 million CDRs from an Asian operator.
For Set 1, we have the set of problems identified by human experts. For Set 2 and 3, we have implemented an expert system mimicking human operators.
B. Top Signature Identification
To evaluate our solution, we select the following metrics: True Positives (TP): inefficient elements detected by ARCD
and validated by the expert.
False Negatives (FN): inefficient elements detected by the expert but not detected by ARCD.
False Positives (FP): efficient elements detected by ARCD but not detected in the validation process.
Extra Features (EF): inefficient elements detected by ARCD but not detected in the validation process because of the limited number of features analyzed by experts due to time constraints.
Extra Values (EV): inefficient elements detected by ARCD but not detected in the validation process because experts analyze only the top 10 frequent elements of each considered feature.
TP FN FP EF EV Set 1 11 2 0 38 1 Set 2 5 2 5 30 10 Set 3 4 1 0 30 16
Table II: Results
Table II shows the overall performance of ARCD which is satisfying in terms of TPs, FPs and FNs. Interestingly, ARCD can detect issues that are not identified by experts since they focus only on highly frequent elements (such as handset types, services, core equipment, and Radio Access Network (RAN)) due to time constraints. For this reason, they miss issues occurring at a finer level of granularity, which ARCD does detect, such as roaming issues, bad cell coverage, Type Allocation Codes (TACs) not supporting specific services, individual users (bots) submitting a large number of call requests to unreachable numbers.
C. Root Cause Diagnosis: Use Case
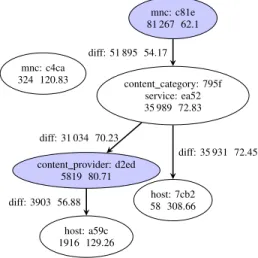
Figure 2 is a sub-graph of the output of the analysis of Set 2 by ARCD. The criterion for SDR tagging is the server response time. The nodes of the graph contain signatures
mnc: c81e 81 267 62.1 mnc: c4ca 324 120.83 content category: 795f service: ea52 35 989 72.83 diff: 51 895 54.17
content provider: d2ed 5819 80.71 diff: 31 034 70.23 host: 7cb2 58 308.66 diff: 35 931 72.45 host: a59c 1916 129.26 diff: 3903 56.88
Figure 2: Pruned Graph
detected as major contributors. Each node contains the features, a hash of their values (for confidentiality reasons) and two numbers: The number of logs containing the signature and the average response time of the data set covered by the signature. The labels on the edges contain the log size and the average response time of the set containing the parent signature and not containing the child signature. The nodes filled in gray are the nodes removed during the pruning process because they denote false problems. The overall server response time of the network is equal to 60 ms. The graph points an individual problems: a roaming issue (mnc: c4ca) and a set of codependent problems with the MNC c81e. This MNC has a large number of logs and a response time slightly higher than the overall network, suggesting a roaming issue. However by removing its child node, its average response time drops below the average value of the network. That is why this issue was tagged as a false problem and was removed in the pruning step. The same reasoning applies to the Content Provider: d2ed.
VII. CONCLUSION
In this paper, we have addressed the problem of automating the system that diagnoses cellular networks based on the data collected from large-scale monitoring systems. Our framework ARCD not only automates expert analysis, but it carries it to a deeper level. Our tests, along with the feedbacks of experts, show that we have promising results. Compared to the previous work, ARCD can run on a large number of categorial features, to identify the complex interplay between various features, and to provide an overview of the main identified malfunctioning devices and services, which can easily be double-checked by experts. In future work, we would like to link our root cause diagnosis framework to an anomaly detection system within the same monitoring platform. This way the anomaly detector would trigger the root cause diagnosis process.
REFERENCES
[1] J. Zhang and N. Ansari, “On assuring end-to-end qoe in next generation networks: challenges and a possible solution,” IEEE Communications Magazine, vol. 49, no. 7, pp. 185–191, 2011.
[2] M. A. Imran and A. Zoha, “Challenges in 5g: how to empower SON with big data for enabling 5g,” IEEE Network, vol. 28, no. 6, pp. 27–33, 2014.
[3] M. Steinder and A. S. Sethi, “A survey of fault localization techniques in computer networks,” Sci. Comput. Program., vol. 53, no. 2, pp. 165–194, 2004. [Online]. Available: https://doi.org/10.1016/j.scico.2004. 01.010
[4] A. G´omez-Andrades, P. M. Luengo, I. Serrano, and R. Barco, “Automatic root cause analysis for LTE networks based on unsupervised techniques,” IEEE Trans. Vehicular Technology, vol. 65, no. 4, pp. 2369– 2386, 2016.
[5] S. F. Rodriguez, R. Barco, and A. Aguilar-Garc´ıa, “Location-based distributed sleeping cell detection and root cause analysis for 5g ultra-dense networks,” EURASIP J. Wireless Comm. and Networking, vol. 2016, p. 149, 2016.
[6] D. Palacios, E. J. Khatib, and R. Barco, “Combination of multiple diagnosis systems in self-healing networks,” Expert Syst. Appl., vol. 64, pp. 56–68, 2016.
[7] E. J. Khatib, R. Barco, A. G´omez-Andrades, P. M. Luengo, and I. Serrano, “Data mining for fuzzy diagnosis systems in LTE networks,” Expert Syst. Appl., vol. 42, no. 21, pp. 7549–7559, 2015.
[8] R. Froehlich, “Knowledge base radio and core network prescriptive root cause analysis,” Aug. 18 2016, US Patent App. 14/621,101.
[9] Z. Zheng, L. Yu, Z. Lan, and T. Jones, “3-dimensional root cause diagnosis via co-analysis,” in 9th International Conference on Autonomic Computing, ICAC’12, San Jose, CA, USA, September 16 - 20, 2012, 2012, pp. 181– 190.
[10] S. F. Rodriguez, R. Barco, A. Aguilar-Garc´ıa, and P. M. Luengo, “Contextualized indicators for online failure diagnosis in cellular networks,” Computer Networks, vol. 82, pp. 96–113, 2015.
[11] H. Mi, H. Wang, Y. Zhou, M. R. Lyu, and H. Cai, “Toward fine-grained, unsupervised, scalable performance diagnosis for production cloud computing systems,” IEEE Trans. Parallel Distrib. Syst., vol. 24, no. 6, pp. 1245–1255, 2013. [Online]. Available: https://doi.org/10.1109/TPDS.2013.21
[12] Y. Jin, N. G. Duffield, A. Gerber, P. Haffner, S. Sen, and Z. Zhang, “Nevermind, the problem is already fixed: proactively detecting and troubleshooting customer DSL problems,” in Proceedings of the 2010 ACM Conference on Emerging Networking Experiments and Technology, CoNEXT 2010, Philadelphia, PA, USA, November 30 -December 03, 2010, 2010, p. 7.
[13] A. Mahimkar, Z. Ge, J. Wang, J. Yates, Y. Zhang, J. Emmons, B. Huntley, and M. Stockert, “Rapid detection of maintenance induced changes in service performance,” in Proceedings of the 2011 Conference on Emerging Networking Experiments and Technologies, Co-NEXT ’11, Tokyo, Japan, December 6-9, 2011, 2011, p. 13.
[14] A. A. Mahimkar, Z. Ge, A. Shaikh, J. Wang, J. Yates, Y. Zhang, and Q. Zhao, “Towards automated performance diagnosis in a large IPTV network,” in Proceedings of the ACM SIGCOMM 2009 Conference on Applications, Technologies, Architectures, and Protocols for Computer Communications, Barcelona, Spain, August 16-21, 2009, 2009, pp. 231–242.
[15] P.-L. Ong, Y.-H. Choo, and A. Muda, “A manufacturing failure root cause analysis in imbalance data set using pca weighted association rule mining,” vol. 77, 11 2015. [16] G. Dimopoulos, I. Leontiadis, P. Barlet-Ros, K. Papagiannaki, and P. Steenkiste, “Identifying the root cause of video streaming issues on mobile devices,” in Proceedings of the 11th ACM Conference on Emerging Networking Experiments and Technologies, CoNEXT 2015, Heidelberg, Germany, December 1-4, 2015, 2015, pp. 24:1–24:13.
[17] K. Nagaraj, C. E. Killian, and J. Neville, “Structured comparative analysis of systems logs to diagnose performance problems,” in Proceedings of the 9th USENIX Symposium on Networked Systems Design and Implementation, NSDI 2012, San Jose, CA, USA, April 25-27, 2012, 2012, pp. 353–366.
[18] C. Kane, “System and method for identifying problems on a network,” Oct. 27 2015, US Patent 9,172,593.