HAL Id: hal-02146187
https://hal.archives-ouvertes.fr/hal-02146187
Submitted on 3 Jun 2019
HAL is a multi-disciplinary open access archive for the deposit and dissemination of sci-entific research documents, whether they are pub-lished or not. The documents may come from teaching and research institutions in France or abroad, or from public or private research centers.
L’archive ouverte pluridisciplinaire HAL, est destinée au dépôt et à la diffusion de documents scientifiques de niveau recherche, publiés ou non, émanant des établissements d’enseignement et de recherche français ou étrangers, des laboratoires publics ou privés.
process: the status of the last decade
Vassilios Krassanakis, Pawel Cybulski
To cite this version:
Vassilios Krassanakis, Pawel Cybulski. A review on eye movement analysis in map reading process: the status of the last decade. Geodesy and Cartography, Commitee on Geodesy of the Polish Academy of Sciences, 2019, 68 (1), pp.191-209. �10.24425/gac.2019.126088�. �hal-02146187�
Review paper
A review on eye movement analysis in map reading process:
the status of the last decade
Vassilios Krassanakis1,2∗, Paweł Cybulski3
1University of West Attica, Department of Surveying and Geoinformatics Engineering
28 Ag. Spyridonos St., 12243 Egaleo-Athens, Greece
2Polytech Nantes, Laboratoire des Sciences du Numérique de Nantes (LS2N)
44306 Nantes CEDEX 3, France
e-mail:krasvas@uniwa.gr, ORCID:http://orcid.org/0000-0002-3030-4203
3Adam Mickiewicz University in Pozna´n
Faculty of Geographic and Geological Sciences, Department of Cartography and Geomatics 10 Krygowskiego St., 61-680 Pozna´n, Poland
e-mail:p.cybulski@amu.edu.pl, ORCID:http://orcid.org/0000-0002-5514-5720
∗Corresponding author: Vassilios Krassanakis
Received: 10 December 2018 / Accepted: 12 April 2019
Abstract:Eye tracking constitutes a valuable tool for the examination of human visual be-havior since it provides objective measurements related to the performed visual strategies during the observation of any type of visual stimuli. Over the last decade, eye movement analysis contributed substantially to the better understanding of how visual attention pro-cesses work in different types of maps. Considering the clear need for the examination of map user reaction during the observation of realistic cartographic products (i.e. static maps, animated maps, interactive and multimedia maps), a critical amount of experimental studies were performed in order to study different aspects related to map reading process by the car-tographic community. The foundation of these studies is based on theories and models that have been developed in similar research domains (i.e. psychology, neuroscience etc.), while the research outcomes that produced over these years can be used directly for the design of more effective and efficient maps. The aim of the present article is to summarize and present the current panorama of the existing eye tracking studies in cartographic research appeared over the last decade. Additionally, methodological contributions (including analysis tools) of cartographic society in the field of eye movement analysis are reported, while existing challenges and future perspectives are also discussed.
Keywords:cartography, eye tracking, eye movement analysis, map reading, map per-ception
1. Introduction
Map reading process is a complex visual procedure which may be affected by several factors connected to either cognitive or perceptual aspects of human vision. The un-derstanding of how maps work requires the performance of experimental studies that
examine map users’ visual behavior and strategies (Vondrakova and Popelka, 2014). Such experimentation is based on theories and models that have been developed in sim-ilar research domains (i.e. psychology, neuroscience etc.). Since the transfer of simsim-ilar research in cartography can be made on the basis of a simple assumption that maps cor-respond to visual stimuli (Ciołkosz-Styk, 2012), the need to examine map user’ reaction during the observation of various cartographic products becomes clear.
Out of the existing experimental techniques, the one of capturing and analyzing eye movements (so called “eye tracking”) represents one of the most valuable meth-ods towards the evaluation of different aspects related to map reading process. Al-though that the first cartographic studies using eye movements analysis were con-ducted in 1971 (Steinke, 1987; MacEachren, 1995); Williams (1971) investigated the concept of symbols selectivity (using geometric symbols), while Jenks was the first cartographer who implemented eye movement analysis techniques in order to inves-tigate how visual attention of map users is drawn during the observation of a dot map (1973) (reported in Steinke, 1987), the last decade is characterized by an in-creasing interest of cartographic society to the implementation of eye tracking tech-niques (Wang et al., 2016). This interest can be proven considering the studies car-ried out and published over the last few years. At the same time, several work-shops and training sessions have been organized from the community during the last years, including the ICA workshop “Eye tracking: why, when, and how?” in 2013 (https://cogvis.icaci.org/icc13_et.html), the series of Eye Tracking for Spatial Research (ET4S) workshops (http://et4s.ethz.ch/et4s-series/), and the ICA workshop on ‘De-signing an conducting user studies” (https://use.icaci.org/interactive-training-sessions-in-albena/).
Eye tracking techniques have already been implemented in several domains related to the examination of map reading process, including the study of design principles and functions of cartographic symbolization, the comparison of map users’ perception dur-ing the observation of 2D and 3D representations, as well as the study of usability of interactive cartographic environments (e.g. Web GIS platforms etc.). Moreover, several studies investigated the spatial abilities of map users while using cartographic products for navigational purposes, and the influence of their expertise on map reading proce-dures. At the same time, cartographic society has been contributed substantially to eye tracking community by developing and distributing analysis methods and tools that may be also applied widely.
Steinke (1987) provided a first in-depth review about eye movement studies in car-tography and several related fields (e.g. psychology etc.). Nowadays, the influence of eye tracking method is noticeable in cartographic research. Recently, Kiefer et al. (2017) have presented a well-documented overview of the contribution of eye tracking tech-nology in spatial research, including spatial cognition, geographic information science and cartography. As indicated by Kiefer et al. (2017), modern eye tracking studies in cartography are based on theoretical concepts developed in research domains that are connected with the study humans’ visual behavior while they are tested in “map read-ing” conditions.
Although the overview provided by Kiefer et al. (2017) constitutes a quite solid groundwork for understanding current trends and challenges in the general field of spatial research, it is also far too important to scrutinize the influence of eye track-ing technology and eye movement analysis on different aspects related to map readtrack-ing process. The aim of this article is to summarize the existing eye tracking cartographic studies that were carried out over the last decade extending the overview presented by Kiefer et al. (2017) (this overview is based on a fundamental classification of maps and geo-visualizations and comprises static, animated and interactive maps). Addition-ally, methodological contributions (including analysis tools) of cartographic society in the field of eye movement analysis are also reported. The literature review provided in the current article is based on the manual search (through Google Scholar platform as well as through the scientific databases of Scopus and Web of Science) using relative to the topic keywords (such as cartography, map reading, eye tracking, and eye movement analysis) and the extensive study of research works published in the period of the last decade (since 2009). Finally, having demonstrated the updated overview of the field, the prospects for future and challenges are discussed.
The present article consists of two main sections including this of the literature re-view on research studies using eye movement analysis towards the examination of map reading process and this of concluding remarks and future perspectives where current and future trends in the field are summarized and discussed. Additionally, for the better organization of the status of the last decade, literature review is organized into five differ-ent subsections, including studies on cartographic symbolization and design principles, studies that compare 2D and 3D representations, studies which examines issues related to map users’ expertise, as well as a separate subsection where cartographic studies re-lated to different topics are investigated and another one where eye tracking analysis tools and methods delivered by the cartographic community over the examined period are presented.
2. Eye movement analysis in map reading process
2.1. Cartographic symbolization and design principles
Cartographic symbolization is a fundamental process in the map production procedure. In particular, cartographers use specific design principles in order to represent qualitative and quantitative differences in geographic data. These principles correspond to the visual variables (Bertin, 1983) in the case of static maps, while their function is accomplished through dynamic variables (DiBiase et al., 1992) for animated maps. Additionally, sound (acoustic) variables (Krygier, 1994) can also be implemented, along with visual and dynamic ones, to support the cartographic design process. Over the last decade, eye tracking studies conducted revealed some first critical evidence about the basic function of design principles. The results of these studies can be used directly for the effective selection of cartographic symbolization.
Garlandini and Fabrikant (2009) examined four basic visual variables of cartographic symbolization (size, color value, and hue, and orientation) in terms of the effectiveness and efficiency of map users in change detection conditions. Effectiveness and efficiency constitute typical measures that correspond to the speed and the accuracy of the detection accordingly. The results of this study indicated that size is the most effective and effi-cient variable among the tested ones while orientation seemed to be the least effective one. Both effectiveness and efficiency can be also described by the term “selectivity”, which refers to the ability of human vision to spot specific objects of a visual scene while avoiding others. In a series of studies (Krassanakis et al., 2011a; 2011b; Kras-sanakis, 2013a), the selectivity of a topological feature of having a hole is examined for abstract (geometric) and pictorial symbols. The results of these studies suggest that this feature can lead to more effective searches (faster for the case of abstract symbols). Additionally, these studies revealed some critical indications about the visual patterns during the search of point symbols in cartographic background. Specifically, they re-vealed that the produced scanpaths were more complicated when target symbols were located on the periphery than in the center (or if they are absent), while the location of a target symbol (which constitutes another fundamental visual variable) seemed to affect the visual search procedure in the next scene in which the same target was searched for. Moreover, their results showed that fixation points mainly corresponded to the parts of the background that consist of point symbols. Similar outcome was also produced in a recent study described by Burch (2017) which highlighted that research participants tend to concentrate on map key symbols when searching in metro maps.
Among typical maps, choropleth maps constitute one of the most popular types for cartographic visualizations. Based on the differentiation of color value, choropleths de-pict quantitative differences existing in geographic data that refer to areas with specific boundaries. The appropriate selection of the used color schemes may lead to the optimal quality of the cartographic product, as well as to the effective discrimination of differ-ent classes by the map user. In a series of eye tracking experimdiffer-ental studies (Brych-tová, 2015; Brychtová and Çöltekin, 2016; 2017), the influence of color distance in map legibility is examined. They revealed that the relation between color distance and map ability was positive (Brychtová, 2015) while larger color distances contributed to the better performance of map users (Brychtová and Çöltekin, 2016). Additionally, testing the effect of spatial distance of map symbols in the differentiation of color value and hue, Brychtová and Çöltekin (2017) concluded that larger color distances were required for sequential schemes than for qualitative ones. At the same time, the study presented by Brychtová (2014) showed that map legend position did not seem to have the influence on map reading process for such stimuli, while Brychtová and Çöltekin (2016) concluded that efficient visual search is enforced when medium font labeling sizes (equal to “11 pt”) are used on the map.
The influence of color dimensions (hue, saturation, and value) was also tested, in terms of effectiveness and efficiency, for map users with normal vision and red/green color impairments (Dong et al., 2016). The results of the study presented by Dong et al. (2016) indicated that color hue is the most distinguishable variable for both groups
of map users while the color saturation and value seemed to have equal influence. Map users’ performance has been also examined during the process of reading different types of polygons on map background (Kiik et al., 2017). Specifically, Kiik et al. (2017) in-vestigated four types of thematic polygons, including simple and transparent boundaries, hatches and icons. Out of the examined types, hatches appeared to be the most efficient although they also had the most negative effect on map reading process, as well as on preferences of map readers.
The level of abstraction (e.g. in map point symbols), or the level of iconicity of map symbols may have also a direct influence on map reading process, considering it may af-fect the message delivered through a cartographic product. In a recent research presented by Franke and Schweikart (2017), the concepts of visual encoding and mental represen-tation of maps were tested through the eye tracking study. The examination was based on the use of three different levels of abstraction for landmarks representation, including vignettes, icons, and text symbols and resulted in a better performance (in terms of mem-ory) for text symbols. Moreover, in another empirical study, presented by Brügger et al. (2016), the influence of different types of line symbols was examined. More specifically, considering three different types of symbolization for elevation change visualization on bicycle routes (including color hue, color-coded arrows and elevation profiles), the visual behavior of map users was tested during two different tasks (relative height detection, and slope identification). The results showed that color-coded arrows lead to more ac-curate performance in terms of height detection while no effects based on the selected visualization were observed for sloe identification (Brügger et al., 2016). Additionally, eye tracking methods have been also used in order to examine how visual variables are perceived during the observation of special cartographic visualizations. Recently, Dong et al. (2018) presented an experimental study in order to examine the influence of flow maps properties in map reading process. Their results indicate that the use of curved flows and color gradients seem to be more effective than straight lines and different line thickness correspondingly.
Apart from the typical visual variables, originally proposed by Bertin (1967/1983) for traditional static maps, animated maps and dynamic variables have also been exam-ined through the implementation of eye tracking experiments. In an empirical study in which the perception of multi-component animated maps was examined, it was high-lighted that the used dynamic variables served as salient features which affected map users’ visual attention (Opach et al., 2014). A similar result was also achieved in the studies presented by Krassanakis (2013a), and Krassanakis et al. (2013a). In more de-tails, testing dynamic variables of duration and rate of change, these studies showed that there was an optimal range within which map users may detect differences that occur on animated maps (Krassanakis, 2013a; Krassanakis et al. 2013a). Furthermore, Kras-sanakis (2014) and KrasKras-sanakis et al. (2016) calculated the minimum duration threshold required for the detection of simple moving point symbols by human central vision. More specifically, they examined the process of point symbol detection on map back-grounds with different level of abstraction and they concluded that detection threshold corresponded to a duration value around 400 ms (Krassanakis, 2014; Krassanakis et al.,
2016). Additionally, in another study demonstrated by Krassanakis et al. (2013b) the post-reaction of map users (after moving point detection) was examined. The results of this study showed that after detected a moving symbol several other cartographic sym-bols might attract map users’ perception (Krassanakis et al., 2013b). Another interesting outcome of this study was that it highlighted that existing saliency models (i.e. models that aim to predict human fixations during the observation of natural scenes) did not al-low to predict the allocation of human visual behavior on a complex topographic map quite accurately.
2.2. Comparing 2D and 3D representations
Nowadays, the distribution of map products using digital monitors, either in personal computers or mobile devices, gives the opportunity to represent 3D geographic data in virtual software environment (e.g. geo-browsers etc.). Although the use of digital rep-resentations may constitute an impressive way to deliver geospatial information to map users, a critical question of this process refers to the effectiveness and the efficiency of their performance during the execution of map tasks. At the same time, the use of vir-tual environment in cartographic visualizations boosts the number of available solutions for map symbolization (e.g. 3D point symbols). In the last decade, several eye track-ing studies in cartographic research compared the performance of map users durtrack-ing the manipulation of cartographic data and the execution of map tasks in both 2D and 3D environment.
The perception of terrain representation constitutes one of the most challenging is-sues that emerged regarding the use of 3D virtual environment. In the experimental eye tracking study related to this issue, Popelka et al. (2013) reported that the use of 3D perspective views, compared to typical orthogonal maps, seemed to be more appropriate for the retrieval of corresponding information during typical visibility analysis tasks. In another study, Popelka and Brychtová (2013), using the technique of eye tracking com-bined with a questionnaire, compared the performance and the preferences of map users during the observation of typical 2D contour map and 3D perspective views for the vi-sualization of terrain elevation. Although no significant difference was found in terms of map users’ preferences, the analysis of eye movements showed that there were differ-ences in map users’ visual strategies which were revealed based on the implementation of a scanpath comparison process (Popelka and Brychtová, 2013).
The process of visual search for point map symbols was also tested on 3D map visualizations. Specifically, Popelka and Doležalová (2015) examined the influence of non-photorealistic 3D city maps on the detection of point symbols. The 3D effect was produced by the existence of 3D buildings. Their analysis, based on both eye tracking data and questionnaires, indicated that the 3D effect did not produce any differences in map reading process (Popelka and Doležalová, 2015). Furthermore, the 3D effect was also tested by Popelka and Doležalová (2016) as a property of cartographic symboliza-tion. In particular, they examined the influence of 3D point symbols during a map task that required the identification of points’ size on both 2D and 3D (using a virtual globe)
maps. Their outcomes highlighted that the use of the virtual globe led to less accurate performance (Popelka and Doležalová, 2016). The influence of 3D map symbols was also tested in an eye tracking experimental study presented by Liu et al. (2017). They examined the effect of the basic visual variables in terms of their “visual guidance” (Liu et al., 2017). They found out that the variables of color hue and shape seemed to serve as dominant variables that guided the visual attention during map reading processes demonstrated on 3D visualizations (Liu et al., 2017).
Eye tracking was also used as a tool for the comparison typical 2D representations with 3D ones during the performance of navigational tasks. More specifically, Dong and Liao (2016) examined map users’ lab-based navigation behavior with the use of typ-ical 2D maps and photorealistic 3D representations. The results of their experimental study indicated that 3D representations seemed to be less effective and efficient in terms of map users’ cognitive load (Dong and Liao, 2016). Their outcomes showed that self-localization and orientation processes were better performed through 3D representations (Dong and Liao, 2016). In a similar study, presented by Liao et al. (2017), map users’ navigational skills were compared by means of 2D maps and 3D geo-browsers. Three discriminated map skills were investigated, including self-localization, spatial knowl-edge acquisition, and decision-making, on the map backgrounds (both 2D and 3D) pro-vided by Google. The outcomes of this study highlighted that map users’ response time was much faster for 3D geo-browsers (Liao et al., 2017). At the same time, this study confirmed that 3D representation was more helpful when the more complex decision had to be taken. A significant difference, based on the examination of the typical eye track-ing metrics of fixation duration and saccades amplitude, between 2D and 3D electronic maps was also discovered by another study presented by Lei et al. (2016). The analysis showed that 2D maps allowed faster browsing procedures than 3D ones in which, “more focused browsing occurs” (Lei et al., 2016). Additionally, it demonstrated that a mixed view consisted of the combination of 2D and 3D representations could be more effective and needed to be considered in the electronic map design (Lei et al., 2016).
2.3. Map users’ expertise
Any model that aims to describe how cartographic communication is achieved needs to consist of three main components: the cartographer (map producer), the map prod-uct, and the map user. Of course, there are also some other factors which may have the influence on such communication (e.g. reading conditions, map product nature etc.). Undoubtedly, the huge variety of the existing map production tools, including those on-line, contributed to the extensive distribution of several maps and related services (e.g. geo-location services etc.) for generic use. However, the aim of the map product or ser-vice could be quite specific if particular users and skills were a target (e.g. route maps for pilots, geological maps for geologists and engineers etc.). Hence, a quite interesting aspect that might contribute to the better understanding of map reading behavior is the component of cartographic communication models connected with end map users. Both the classification of map users into well-defined categories (e.g. based on demographic
information etc.) as well as the influence of their characteristics on their map reading performance can be investigated.
Map users’ expertise constitutes one of the basic characteristics that can be used to classify map users. The influence of this factor was examined through several eye tracking experimental studies during the observation of different types of cartographic products, while at the same time eye tracking technology was combined with other meth-ods, such as thinking aloud method, questionnaire analysis etc., in order to examine optimal map design practices (Ooms, 2012). Ooms et al. (2012a) presented an exper-imental study where both expert and novice map users were examined during visual search tasks on dynamic and interactive maps. The study combined eye tracking with time response recording measures and aimed to reveal critical information about users’ performed strategies and the cognitive load processes. The results showed that experts turned out to be more efficient in the performed map tasks related to the identification of specific names while novices needed more time for map image interpretation (Ooms et al., 2012a). However, Ooms et al. (2014) concluded that both experts and novices map users had difficulties with the execution of map tasks that required the interpretation and memorization of mirrored maps objects.
The influence of map users’ expertise was also tested in specific types of visual-izations. More specifically, Stofer and Che (2014) examined the visual reaction of both experts and novices during the observation of scaffolded (ocean) data visualizations. This study revealed that the “meaning-making” strategies adopted by experts were dif-ferent from those adopted by novices. According to Zittoun and Brinkmann (2012) the term of “meaning-making” is referred to “the process by which people interpret situa-tions, events, objects, or discourses, in the light of their previous knowledge and expe-rience”. Stofer and Che supported the results, comparing them with those of a previous “interview-based” study (Stofer and Che, 2014). In another study, presented by Çöltekin et al. (2016), map users with different levels of prior knowledge about soils were tested in order to examine how their effectiveness and efficiency were influenced by different legend presentation types during the execution of typical soil-landscape tasks. The re-sults revealed difficulties of all participants with successful completion of the majority of tasks, proving the complexity of such map products (Çöltekin et al., 2016).
The factor of map users’ expertise was also tested through a mixed-method experi-ment (using digital sketch maps and eye moveexperi-ment analysis) in a recent study presented by Keskin et al. (2018). In particular, this study examined the performance of both ex-pert and novice users during a memory task where participants asked to remember and recall (through delivering sketch maps) the main map elements that were presented on the used stimuli. Their analysis showed that no significant differences existed between experts and novices, as well as between females and males.
2.4. Other applications related to map reading
In the paragraphs above, eye tracking applications are classified into basic subcategories related to cartographic research. Nevertheless, the methods of capturing and analyzing
eye movements also have a great influence on several other aspects of map reading pro-cess. At the same time, eye tracking has also been used as an objective evaluation tool for the quality of specific cartographic products (see e.g. the recent study presented by Burian et al. (2018) on the evaluation of urban plans) and the usability of specific tools (see e.g. the study presented by Goł˛ebiowska et al. (2017) where the configuration of a visualization tools consisting of multiple components is examined).
One of the factors that might affect the total effectiveness of the cartographic product is related to map annotation. On the basis of the collection of eye tracking data, Ooms et al. (2012b) showed that both effectiveness and efficiency of label placement methods can be improved without affecting the information delivered to map users through in-teractive and dynamic maps. Another eye tracking experimental study revealed that the performance of map tasks may be influenced by different types of annotations (Netzel et al., 2017). Additionally, the influence of labels density on maps’ complexity and legibil-ity has also been recently studied by Liao et al. (2018) in a two-step experimental process in which questionnaire-based and eye tracking methods were used. The interesting point of their study was that, although they observed the existence of a correlation between la-bel density and perceived complexity through the collection of response times, the used eye tracking analysis did not end with the same result.
Since map complexity is directly affected by the nature (e.g. geometry) of map sym-bols displayed, the examination of how visual perception works during the observation of symbols in different shapes seems very challenging. The observation of both theoreti-cal (testing) and real cartographic lines (with different shapes and geometries) was tested through an experimental study presented by Bargiota et al. (2013) conducted to examine whether critical points (which are necessary for the implementation of line generaliza-tion algorithms) were observed or not. Their results indicated that locageneraliza-tions of fixageneraliza-tions were connected with regions of the lines that involved critical points. Additionally, ex-cept for the basic components (i.e. cartographic symbols and annotation) that shape the main image of the map, secondary elements might also influence the process of map reading. In the memory task-based eye tracking experimental study presented by Edler et al. (2018), it was revealed that the position of the map legend influenced the perfor-mance of map users. In more detail, the results highlighted that right-sided legends were decoded faster that left-sided ones.
Presently, taking into consideration that the majority of maps are distributed as digi-tal products with animated and interactive material, the major challenge of cartographic research is connected with the evaluation of the usability of such products. In the ex-perimental study presented by Incoul et al. (2015), the comparison of map users’ visual behavior during the observation of both paper and digital cartographic maps revealed that although visual attention allocation was similar in both products, more fixations per second were performed when digital maps were observed. Furthermore, several studies examine the effectiveness and efficiency of interactive (Çöltekin et al. 2009; 2010) and animated maps (Opach and Nossum, 2011; Dong et al., 2014a; 2014b), including car-tographic products distributed in GIS environment (Brychtová et al., 2012b; 2013) or through the Internet (web maps) (Alaçam and Dalci, 2009; Manson et al. 2012; Keil at
al. 2018), as well as that of special visualization techniques, such as cartograms (Ulla et al., 2016). The results of these studies revealed that significant differences might exist among different products (e.g. among different web map services), especially consider-ing the map readconsider-ing process involved the use of different tools and buttons of their graph-ical user interface (GUI) while at the same time the function of typgraph-ical visual variables might differ on dynamic cartographic visualizations. For example, Dong et al. (2014b) found that the function of variables of color hue and size was directly related to the size of display. That result is quite critical considering today a map can be demonstrated on several devices with a digital monitor. What is also interesting is the fact that, consider-ing some of methodological attitudes that are followed by aforementioned studies as well as by other studies mentioned in the present work, the examination of usability issues can be also based on the combination of eye tracking methodology with other experi-mental techniques, such as thinking aloud processes, video recording and questionnaires analysis. Simultaneously, these studies highlight the crucial need to scrutinize how map readers interact with map interface during the “modern” process of map reading.
2.5. Eye tracking analysis tools and methods delivered by cartographic community
In the last decade several tools and analysis methods were also proposed and distributed towards the investigation of map reading procedure with the use of eye tracking tech-niques. This fact proves that the crucial need for optimizing such methods with carto-graphic products (Brychtová et al., 2012a) remains active. At the same time, many of the developed software tools can be used for general purposes in similar fields (e.g. in land-scape perception research etc.). Hence, the past and the current activity of cartographic community is not limited just to transferring and using existing methods and tools for the investigation of map reading patterns and behaviors but it substantially contributes to the further extension of eye tracking methodological approaches.
The adaptation of commonly used eye tracking techniques in cartographic research requires the selection of appropriate analysis parameters. Such parameters might be con-nected with selections made either in a “higher” or a “lower” level. The higher-level analysis may require the delineation of areas of interests (AOIs) according to specific map elements while the selection of the appropriate fixation detection parameters consti-tutes one of the components essential to the lower-level analysis. For example, Popelka (2014) investigated the optimal spatiotemporal parameters for the implementation of a dispersion-based algorithm (I-DT) for cartographic purposes. Moreover, considering performed visual search strategies may differ according to several factors, appropriate methodological approaches could be adapted in order to describe the corresponding vi-sual behavior of map users. For example, Kiefer and Giannopoulos (2012) presented the development of a “gaze map matching” approach which aims to deliver an auto-matic content-based gaze analysis based on the implementation of a probabilistic Hid-den Markov Model (HMM). Recently, Göbel et al. (2017) presented FeaturEyeTrack framework which is based on this approach that works with interactive online maps.
The problem of visual strategies’ comparison remains one of the most challenging issues in the eye movement analysis research. ScanGraph (http://eyetracking.upol.cz/ scangraph/) is one of the tools that can be implemented in order to identify existing sim-ilarities among map users’ strategies (Dolezalova, and Popelka, 2016a; 2016b). In this tool, scanpath comparison process is based on the use of a modified version of Leven-shtein distance and Needleman-Wunsch algorithms (Dolezalova, and Popelka, 2016a; 2016b). Undoubtedly, the categorization of visual strategies might reveal critical indica-tions about the related factors that have the influence on map reading process. Although such approach can be used for quantification of existing differences, it is also far too im-portant to employ sophisticated methods to represent those differences. Additionally, it is also quite vital to establish effective ways to visualize the behavior of the examined sam-ple of participants during the observation of specific stimuli. Heatmap visualizations are probably the most famous method of representing the “overall” visual behavior. Kara-giorgou et al. (2014) presented an alternative approach that aims to deliver a visualization tool of the “average” scanning behavior. They produced an inferred polyline based on the implementation of DBSCAN clustering algorithm that represented the average strategy of map users.
Eye tracking data were also used as the basic input for enhancing the interaction be-tween the map user and the map interface. GazeGIS platform (Tateosian et al., 2017) is an identical example of how this approach can be implemented. In particular, GazeGIS serves as the gaze-based geographic information system (GIS) which allows the augmen-tation of text with geographic information. Hence, this platform, although a prototype, may constitute a different way of navigation and distribution of available geographic information.
Besides the aforementioned analysis tools and applications, some more generic tools suitable for eye movement analysis have been delivered by cartographic society. For ex-ample, EyeMMV toolbox (https://github.com/krasvas/EyeMMV) (Krassanakis 2013b; Krassanakis et al. 2014) is MATLAB analysis toolbox which fully supports the analysis of eye tracking data in typical eye tracking metrics (fixations, saccades, and scanpath based) as well as the development of popular eye tracking visualization methods. Ad-ditionally, the function of this toolbox has been recently extended (LandRate toolbox (https://github.com/krasvas/LandRate)) in order to deliver the automatic eye tracking analysis report in simple steps (Krassanakis et al., 2018). At the same time, LandRate toolbox gives the opportunity to calculate the integrated index (LRI) that combines typ-ical eye tracking metrics with weights that can be produced on a basis of expert judg-ment procedures. Moreover, the 3DgazeR (http://www.eyetracking.upol.cz/3d/) is an-other tool that supports the visualization of eye tracking data on 3D geovisualizations (e.g. digital elevation models) (Herman et al., 2017). Such implementation extends the functionality of typical 2D eye tracking visualization methods in 3D space and may support gaze data visualization during the observation of corresponding types of visual stimuli.
Lately, the cartographic community has also shown an increasing interest in the use of low-cost eye tracking solutions for the implementation of experimental research
stud-ies. Bérces and Török (2013) presented a Do-It-Yourself (DIY) eye tracker that can be used for the performance of cartographic experiments while Ooms et al. (2015) evalu-ated the suitability of a specific low-cost device (EyeTribe) for scientific experimenta-tion. Moreover, Popelka et al. (2016) suggested how the same device can be integrated with the Hypothesis platform (an updated description of this platform is presented by Šašinka et al. (2017)). Additionally, recently Ooms and Krassanakis (2018) presented a methodological framework that can be used for the measurement of spatial noise of low-cost (and other) eye tracking devices as well as the use of the produced values as an input in the process of fixation detection. Finally, Demšar and Çöltekin (2017) presented re-cently an integrated methodological approach towards the quantification of interactions between trajectories generated by implementing both eye and mouse tracking proce-dures. Their analysis showed that, for task performed under unconscious control, mouse tracking data might be correlated with the corresponding eye tracking data. Hence, this study indicated that mouse tracking data, which can be easily collected without the need of any specific hardware, could be used as an indicator of attention processes that take place during the observation of a visual scene.
3. Concluding remarks and future perspectives
Totally, 76 research articles (including those mentioned in the present paragraph) pub-lished in the last decade are examined and presented within the present study. In Table 1, the number of the examined studies (both in absolute and percentage values) as well as the corresponded covered periods are reported. Additionally, the percentage of the examined published works per each category is also depicted in Figure 1. As it is ob-served from both Table 1 and Figure 1, the majority of the examined research studies are related to the study of cartographic symbolization and the relative design principles.
Moreover, cartography society contributed substantially to the development of new tools and methods towards the performance of eye movement analysis.
Table 1. The number of the examined studies (both in absolute and percentage values) as well as the corresponded covered periods
Category Number
of studies Percentage (%) Period
Cartographic symbolization and design principles 20 26.3 2009–2018
Comparing 2D and 3D representations 8 10.5 2013–2017
Map users’ expertise 6 7.9 2012–2018
Other applications related to map reading 20 26.3 2009–2018
Eye tracking analysis tools and methods
delivered by cartographic community 18 23.7 2012–2018
Future perspectives 4 5.3 2016–2018
Total 76 100
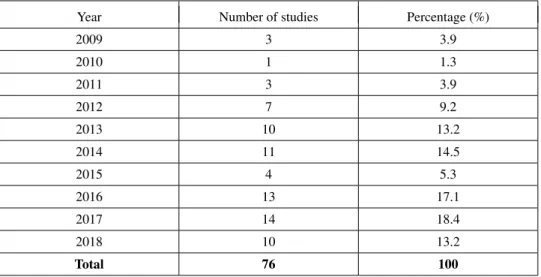
In Table 2, the number of the examined studies (both in absolute and percentage val-ues) is also presented per each examined year of the last decade. Furthermore, Figure 2 depicts the corresponded percentage of the examined studies per each year. As it is ob-vious from both Table 2 and Figure 2, cartographic society was really quite active in the field.
Table 2. The number of the examined studies (both in absolute and percentage values) is also presented per each examined year of the last decade
Year Number of studies Percentage (%)
2009 3 3.9 2010 1 1.3 2011 3 3.9 2012 7 9.2 2013 10 13.2 2014 11 14.5 2015 4 5.3 2016 13 17.1 2017 14 18.4 2018 10 13.2 Total 76 100
The amount of research studies reported in the present article proves that eye track-ing technology represents a valuable tool for the examination of different aspects of the map reading process. The eye movement analysis constitutes the enhanced method that
Fig. 2. The examined research works per year of the last decade
serves as subjective approach towards the analysis of visual attention for different types of cartographic products (i.e. printed, static, dynamic, and interactive maps distributed either as standalone media or through the internet). However, as it is also highlighted by the reported studies, eye tracking can be combined either with traditional methods (e.g. questionnaires, response time capturing, thinking aloud protocols etc.) or more sophisti-cated ones, such as Electroencephalography (EEG). Keskin and Ooms (2018) discusses some of the most challenging issues that emerge during integration of eye tracking with EEG technique towards to support cartographic usability research. At the same time, recent research studies highlight how other eye tracking metrics (see e.g. the study pre-sented by Kiefer et al. (2016) where pupil diameter measurements were used and cog-nitive load indicators during the performance of map tasks) or specific indicators (see e.g. the ambient/focal coefficient K presented by Krejtz et al., 2017) can be used for the study of map reading strategies.
The knowledge obtained over the last decade is another step toward the deeper un-derstanding of how visual attention works during the observation of maps. The reported findings can be used directly for designing more efficient and more effective cartographic products. Eye tracking data can also be used for modeling the behavior of the user dur-ing the execution of specific map tasks (see e.g. the modeldur-ing approach followed by Dong et al. (2018)). Additionally, the development and the distribution of commonly available ground truth map-based eye tracking datasets can substantially contribute the implementation of artificial intelligence (e.g. machine and deep learning). Consequently, future maps and map services may be more “smart” and customized to meet users’ needs in different viewing conditions.
Acknowledgement
Authors would like to thank both anonymous reviewers for their fruitful recommenda-tions. There is not any external funding for this research.
References
Alaçam, Ö. and Dalcı, M. (2009). A Usability Study of WebMaps with Eye Tracking Tool: The Effects of Iconic Representation of Information. In: Human-Computer Interaction. J.A. Jacko (ed.), Berlin, Heidelberg: Springer, vol. 5610, 12–12. DOI:10.1007/978-3-642-02574-7_2.
Bargiota, T., Mitropoulos, V., Krassanakis, V. and Nakos, B. (2013). Measuring locations of critical points along cartographic lines with eye movements. Proceedings of the 26th International Cartographic Association Conference, Dresden, Germany.
Bérces, A. and Török, Z.G. (2013). A home-made, 10 bucks eye tracking system. Workshop of Interna-tional Cartographic Conference (ICC, ICA) 2013: Eye Tracking: Why, When, and How? Dresden, Germany.
Bertin, J. (1983). Semiology of Graphics: Diagrams, Networks, Maps. Madison, Wisconsin.
Brügger, A., Fabrikant, S.I. and Çöltekin, A. (2016). An empirical evaluation of three elevation change symbolization methods along routes in bicycle maps. Cartography and Geographic Information
Science, 44(5), 436–451. DOI:10.1080/15230406.2016.1193766.
Brychtová, A., (2015). Exploring the Influence of Colour Distance and legend position on choropleth maps readability. In: Modern Trends in Cartography. J. Brus, A. Vondrakova, V. Vozenilek (ed.), Springer, Cham, 303–314. DOI:10.1007/978-3-319-07926-4_23.
Brychtová, A. and Çöltekin, A. (2016). An Empirical User Study for Measuring the Influence of Colour Distance and Font Size in Map Reading Using Eye Tracking. The Cartographic Journal, 53(3),
202–212. DOI:10.1179/1743277414Y.0000000103.
Brychtová, A. and Çöltekin, A. (2017). The Effect of Spatial Distance on The Discriminability of Col-ors in Maps. Cartography and Geographic Information Science, 44(3), 229–245. DOI:10.1080/ 15230406.2016.1140074.
Brychtová, A., Paszto, V., Marek, L. and Panek, J. (2013). Web-Designing Evaluation of the Crisis Map of the Czech Republic Using Eye-Tracking. Proceedings of the 13th International Multidisciplinary Scientific Geoconference, Albena.
Brychtová, A., Popelka, S. and Dobesova, Z. (2012a). Eye-tracking methods for investigation of carto-graphic principles. SGEM 2012 Conference Proceedings, Vol. 2, 1041–1048.
Brychtová, A., Popelka, S. and Vozenilek, V. (2012b). The analysis of eye movement as a tool for evaluation of maps and graphical outputs from GIS. Proceedings of the 19th International Confer-ence on Geography and Geoinformatics: Challenge for Practise and Education. Brno, Czech Repub-lic, 154–162.
Burch, M. (2017). Which Symbols, Features, and Regions Are Visually Attended in Metro Maps? In:
In-telligent Decision Technologies 2017, KES-IDT 2017, PT II. Book series: Smart Innovation Systems
and Technologies 73. I. Czarnowski, R.J. Howlett, and L.C. Jain (ed.), Springer, Cham, 237–246. DOI:10.1007/978-3-319-59424-8_22.
Burian, J., Popelka, S. and Beitlova, M. (2018). Evaluation of the Cartographical Quality of Urban Plans by Eye-Tracking. ISPRS Int. J. Geo-Inf, 7(5), 192. DOI:10.3390/ijgi7050192.
Ciołkosz-Styk, A. (2012). The visual search method in map perception research. Geoinformation Issues, 4(1), 33–42.
Çöltekin, A., Brychtová, A., Griffin, A.L., Robinson, A.C., Imhof, M. and Pettit, C. (2016). Percep-tual complexity of soil-landscape maps: A user evaluation of color organization in legend de-signs using eye tracking. International Journal of Digital Earth, 10(6), 560–581. DOI:10.1080/ 17538947.2016.1234007.
Çöltekin, A., Fabrikant, S.I. and Lacayo, M. (2010). Exploring the efficiency of users’ visual analytics strategies based on sequence analysis of eye movement recordings. International Journal of
Çöltekin, A., Heil, B., Garlandini, S. and Fabrikant, S.I. (2009). Evaluating the effectiveness of interactive map interface designs: a case study integrating usability metrics with eye-movement analysis.
Car-tography and Geographic Information Science, 36(1), 5–17. DOI:10.1559/152304009787340197. Demšar, U. and Çöltekin, A. (2017). Quantifying gaze and mouse interactions on spatial visual interfaces
with a new movement analytics methodology. PloS one, 12(8). DOI:10.1371/journal.pone.0181818. DiBiase, D., MacEachren, A.M., Krygier, J.B. and Reeves, C. (1992). Animation and the role of map design in scientific visualization. Cartography and Geographic Information Systems, 19(4), 201–
214. DOI:10.1559/152304092783721295.
Dolezalova, J. and Popelka, S. (2016a). Evaluation of the user strategy on 2D and 3D city maps based on novel scanpath comparison method and graph visualization. The International Archives
of Photogrammetry, Remote Sensing and Spatial Information Sciences, 41, 637. DOI: 10.5194/ sprs-archives-XLI-B2-637-2016.
Dolezalova, J. and Popelka, S. (2016b). The Use of Simple Graphs and Cliques for Analysis of Carto-graphic Eye-Tracking Data. Proceedings of ITAT 2016, CEUR Workshop, Vol. 1649, 206–211. Dong, W., Jiang, Y., Zheng, L., Liu, B. and Meng, L. (2018). Assessing Map-Reading Skills
Us-ing Eye TrackUs-ing and Bayesian Structural Equation ModellUs-ing. Sustainability, 10(9), 3050. DOI:10.3390/su10093050.
Dong, W. and Liao, H. (2016). Eye tracking to explore the impacts of photorealistic 3D representations in pedestrian navigation performance. International Archives of the Photogrammetry, Remote Sensing
and Spatial Information Sciences, 41. DOI:10.5194/isprsarchives-XLI-B2-641-2016.
Dong, W., Liao, H., Roth, R.E. and Wang, S. (2014a). Eye tracking to explore the potential of enhanced imagery basemaps in web mapping. The Cartographic Journal, 51(4), 313–329. DOI: 10.1179/ 1743277413Y.0000000071.
Dong, W., Liao, H., Xu, F., Liu, Z. and Zhang, S. (2014b). Using eye tracking to evaluate the usability of animated maps. Science China Earth Sciences, 57(3), 512–522. DOI:10.1007/s11430-013-4685-3. Dong, W., Zhang, S., Liao, H., Liu, Z., Li, Z. and Yang, X. (2016). Assessing the effectiveness and ef-ficiency of map colour for colour impairments using an eye-tracking approach. The Cartographic
Journal, 53(2), 166–176. DOI:10.1179/1743277413Y.0000000053.
Dong, W., Wang, S., Chen, Y. and Meng, L. (2018). Using Eye Tracking to Evaluate the Usability of Flow Maps. ISPRS Int. J. Geo-Inf, 7(7), 281. DOI:10.3390/ijgi7070281.
Edler, D., Keil, J., Tuller, M.C., Bestgen, A.K. and Dickmann, F. (2018). Searching for the ‘Right’ Leg-end: The Impact of Legend Position on Legend Decoding in a Cartographic Memory Task. The
Cartographic Journal, 1–12. DOI:10.1080/00087041.2018.1533293.
Franke, C. and Schweikart, J. (2017). Mental representation of landmarks on maps: Investigating carto-graphic visualization methods with eye tracking technology. Spatial Cognition and Computation, 17(1–2), 20–38. DOI:10.1080/13875868.2016.1219912.
Garlandini, S. and Fabrikant, S.I. (2009). Evaluating the effectiveness and efficiency of visual variables
for geographic information visualization. Proceedings of the International Conference on Spatial
Information Theory. Springer, Berlin, Heidelberg. 195-211
Göbel, F., Kiefer, P. and Raubal, M. (2017). FeaturEyeTrack: A Vector Tile-Based Eye Tracking Frame-work for Interactive Maps. Societal Geo-Innovation: Short Papers, Posters and Poster Abstracts of the 20th AGILE Conference on Geographic Information Science. Wageningen University and Re-search 9–12 May 2017, Wageningen, the Netherlands, 103.
Goł˛ebiowska, I., Opach, T. and Rød, J.K. (2017). For your eyes only? Evaluating a coordinated and multiple views tool with a map, a parallel coordinated plot and a table using an eye-tracking approach. International Journal of Geographical Information Science, 31(2), 237–252.
DOI:10.1080/13658816.2016.1191636.
Herman, L., Popelka, S. and Hejlova, V. (2017). Eye-tracking Analysis of Interactive 3D Geovisualization.
Incoul, A., Ooms, K. and De Maeyer, P. (2015). Comparing paper and digital topographic maps using eye tracking. In: Modern Trends in Cartography. J. Brus, A. Vondrakova, V. Vozenilek (ed.), Springer, Cham, 339–356. DOI:10.1007/978-3-319-07926-4_26.
Jenks G.F. (1973). Visual Integration in Thematic Mapping: Fact or Fiction? International Yearbook of
Cartography, 13, 27–35.
Karagiorgou, S., Krassanakis, V., Vescoukis, V.C. and Nakos, B.P. (2014). Experimenting With Polylines on the Visualization of Eye Tracking Data From Observations of Cartographic Lines. Proceedings of the 2nd Eye Tracking For Spatial Research (ET4S), GIScience, 22–26.
Keil, J., Mocnik, F-B., Edler, D., Dickmann, F. and Kuchinke, L. (2018). Reduction of Map Information Regulates Visual Attention without Affecting Route Recognition Performance. ISPRS Int. J.
Geo-Inf, 7(12), 469. DOI:10.3390/ijgi7120469.
Keskin, M. and Ooms, K. (2018). Possibilities of eye tracking and EEG integration for visual search on 2D maps. Proceedings of the 3rd International Workshop on Eye Tracking for Spatial Research, Switzerland, Zurich, 16–21.
Keskin, M., Ooms, K., Dogru, A.O. and De Maeyer, P. (2018). Digital sketch maps and eye track-ing statistics as instruments to obtain insights into spatial cognition. J. Eye Mov. Res., 11(3). DOI:10.16910/jemr.11.3.4.
Kiefer, P. and Giannopoulos, I. (2012). Gaze map matching: mapping eye tracking data to geographic vector features. Proceedings of the 20th International Conference on Advances in Geographic In-formation Systems. ACM, 359–368.
Kiefer, P., Giannopoulos, I., Duchowski, A. and Raubal, M. (2016). Measuring cognitive load for map tasks through pupil diameter. Proceedings of the International Conference on Geographic Informa-tion Science. Springer, Cham, 323–337
Kiefer, P., Giannopoulos, I., Raubal, M. and Duchowski, A. (2017). Eye tracking for spatial re-search: Cognition, computation, challenges. Spatial Cognition and Computation, 17(1–2), 1–19. DOI:10.1080/13875868.2016.1254634.
Kiik, A., Nyström, M. and Harrie, L. (2017). Cartographic Design Matters–A Comparison of Thematic Polygon Design. The Cartographic Journal, 54(1), 24–35. DOI:10.1080/00087041.2016.1147191. Krassanakis V. (2013a). Exploring the map reading process with eye movement analysis. Proceedings of the 1st International Workshop (in conjunction with COSIT 2013), Scarborough, United Kingdom, 2–7.
Krassanakis, V. (2013b). Using EyeMMV Toolbox for eye movement analysis in cartographic experi-ments. Workshop of International Cartographic Conference (ICC, ICA) 2013: Eye Tracking: Why, When, and How? Dresden, Germany.
Krassanakis, V. (2014). Development of a methodology of eye movement analysis for the study of visual perception in animated maps (In Greek), PhD Thesis, National Technical University of Athens, Athens, 246.
Krassanakis, V., Lelli, A., Lokka, I.E., Filippakopoulou, V. and Nakos, B. (2013a). Investigating dynamic variables with eye movement analysis. Proceedings of the 26th International Cartographic Confer-ence, Dresden, Germany.
Krassanakis, V., Lelli, A., Lokka, I.E., Filippakopoulou, V. and Nakos, B. (2013b). Searching for salient locations in topographic maps. Proceedings of the First International Workshop on Solutions for Automatic Gaze Data Analysis, Bielefeld, Germany, 41–44.
Krassanakis V., Filippakopoulou V. and Nakos B. (2011a). The influence of attributes of shape in map reading process. Proceedings of the 25th International Cartographic Conference, Paris, France. Krassanakis V., Filippakopoulou V. and Nakos B. (2011b). An Application of Eye Tracking Methodology
Krassanakis, V., Filippakopoulou, V. and Nakos, B. (2014). EyeMMV toolbox: An eye movement post-analysis tool based on a two-step spatial dispersion threshold for fixation identification. J. Eye Mov.
Res., 7(1). DOI:10.16910/jemr.7.1.1.
Krassanakis, V., Filippakopoulou, V. and Nakos, B. (2016). Detection of moving point symbols on carto-graphic backgrounds. J. Eye Mov. Res., 9(2). DOI:10.16910/jemr.9.2.2.
Krassanakis V., Misthos M.L. and Menegaki M. (2018). LandRate toolbox: an adaptable tool for eye movement analysis and landscape rating. Proceedings of the 3rd International Workshop on Eye Tracking for Spatial Research, Switzerland, Zurich, 40–45.
Krejtz, K., Coltekin, A., Duchowski, A.T. and Niedzielska, A. (2017). Using Coefficient K to Distin-guish Ambient/Focal Visual Attention During Cartographic Tasks. J. Eye Mov. Res., 10 (2), 3. DOI:10.16910/jemr.10.2.3.
Krygier, J.B. (1994). Sound and geographic visualization. In: Modern cartography series. A.M. MacEachren, D.R.F. Taylor (ed.), Vol. 2,. Academic Press, 149–166. DOI: 10.1016/B978-0-08-042415-6.50015-6.
Lei, T. C., Wu, S.C., Chao, C.W. and Lee, S.H. (2016). Evaluating differences in spatial visual atten-tion in wayfinding strategy when using 2D and 3D electronic maps. GeoJournal, 81(2), 153–167. DOI:10.1007/s10708-014-9605-3.
Liao, H., Dong, W., Peng, C. and Liu, H. (2017). Exploring differences of visual attention in pedestrian navigation when using 2D maps and 3D geo-browsers. Cartography and Geographic Information
Science, 44(6), 474–490. DOI:10.1080/15230406.2016.1174886.
Liao, H., Wang, X., Dong, W. and Meng, L. (2018). Measuring the influence of map label density on perceived complexity: a user study using eye tracking. Cartography and Geographic Information
Science, 1–18.
Liu, B., Dong, W. and Meng, L. (2017). Using eye tracking to explore the guidance and constancy of visual variables in 3D visualization. ISPRS Int. J. Geo-Inf, 6(9), 274. DOI:10.3390/ijgi6090274. MacEachren, A.M. (1995). How Maps Work: Representation, Visualization and Design. Guilford Press. Manson, S.M., Kne, L., Dyke, K.R., Shannon, J. and Eria, S. (2012). Using eye-tracking and mouse
met-rics to test usability of web mapping navigation. Cartography and Geographic Information Science, 39(1), 48–60. DOI:10.1559/1523040639148.
Netzel, R., Hlawatsch, M., Burch, M., Balakrishnan, S., Schmauder, H. and Weiskopf, D. (2017). An Evaluation of Visual Search Support in Maps. IEEE Transactions on Visualization and Computer
Graphics, 23 (1), 421–430. DOI:10.1109/TVCG.2016.2598898.
Ooms, K. (2012). Maps, how do users see them?: an in depth investigation of the map users’ cognitive processes, PhD Thesis, Ghent University, Gent.
Ooms, K., De Maeyer, P., Fack, V., Van Assche, E. and Witlox, F. (2012a). Interpreting maps through the eyes of expert and novice users. International Journal of Geographical Information Science, 26(10), 1773–1788. DOI:10.1080/13658816.2011.642801.
Ooms, K., Maeyer, P.D., Fack, V., Assche, E.V. and Witlox, F. (2012b). Investigating the effectiveness of an efficient label placement method using eye movement data. The Cartographic Journal, 49(3),
234–246. DOI:10.1179/1743277412Y.0000000010.
Ooms, K., De Maeyer, P. and Fack, V. (2014). Study of the attentive behavior of novice and expert map users using eye tracking. Cartography and Geographic Information Science, 41(1), 37–54. DOI:10.1080/15230406.2013.860255.
Ooms, K., Dupont, L., Lapon, L. and Popelka, S. (2015). Accuracy and precision of fixation locations recorded with the low-cost Eye Tribe tracker in different experimental setups. J. Eye Mov. Res., 8(1). DOI:10.16910/jemr.8.1.5.
Ooms, K. and Krassanakis, V. (2018). Measuring the Spatial Noise of a Low-Cost Eye Tracker to Enhance Fixation Detection. Journal of Imaging, 4(8), 96. DOI:10.3390/jimaging4080096.
Opach, T., Goł˛ebiowska, I. and Fabrikant, S.I. (2014). How Do People View Multi-Component Animated Maps? The Cartographic Journal, 51 (4), 330–342. DOI:10.1179/1743277413Y.0000000049. Opach, T. and Nossum, A. (2011). Evaluating the usability of cartographic animations with eye-movement
analysis. Proceedings of the 25th International Cartographic Conference, Paris, France.
Popelka, S. (2014). Optimal eye fixation detection settings for cartographic purposes. Proceedings of the 14th SGEM GeoConference on Informatics, Geoinformatics and Remote Sensing, SGEM2014, 2014, Vol. 1, 705–712.
Popelka, S. and Brychtová, A. (2013). Eye-tracking study on different perception of 2D and 3D terrain visualisation. The Cartographic Journal, 50(3), 240–246. DOI:10.1179/1743277413y.0000000058. Popelka, S., Brychtová, A., Svobodova, J., Brus, J. and Dolezal, J. (2013). Advanced Visibility Analyses and Visibility Evaluation Using Eye-Tracking. Proceedings of the 21st International Conference on Geoinformatics, Kai Feng, China, June 20–22.
Popelka, S. and Doležalová, J. (2015). Non-photorealistic 3D visualization in city maps: an eye-tracking study. In: Modern Trends in Cartography, J. Brus, A. Vondrakova, V. Vozenilek (ed.), Springer, Cham, 357–367. DOI:10.1007/978-3-319-07926-4_27.
Popelka, S. and Doležalová, J. (2016). Differences between 2D maps and virtual globe containing point symbols an eye-tracking study. Proceedings of the 16th International Multidisciplinary Scientific Geoconference (SGEM 2016), June 30–July 06, Albena, Bulgaria.
Popelka, S., Stachoˇn, Z., Šašinka, ˇC. and Doležalová, J. (2016). Eyetribe tracker data accuracy evaluation and its interconnection with hypothesis software for cartographic purposes. Computational intelli-gence and neuroscience, ID 9172506. DOI:10.1155/2016/9172506.
Šašinka, C., Morong, K. and Stachoˇn, Z. (2017). The Hypothesis Platform: An Online Tool for Experimen-tal Research into Work with Maps and Behavior in Electronic Environments. ISPRS Int. J. Geo-Inf, 6 (12), 407. DOI:10.3390/ijgi6120407.
Steinke, T.R. (1987). Eye movement studies in cartography and related fields. Cartographica: The
Inter-national Journal for Geographic Information and Geovisualization, 24(2), 40–73. DOI:10.3138/ J166-635U-7R56-X2L1.
Stofer, K. and Che, X. (2014). Comparing experts and novices on scaffolded data visualizations using eye-tracking. J. Eye Mov. Res., 7(5). DOI:10.16910/jemr.7.5.2.
Tateosian, L.G., Glatz, M., Shukunobe, M. and Chopra, P. (2017). GazeGIS: A Gaze-Based Reading and Dynamic Geographic Information System. In: Eye Tracking and Visualization: Foundations,
Techniques, and Applications. M. Burch, L. Chuang, B. Fisher, A. Schmidt, D. Weiskopf (ed.),
ETVIS 2015, 129–147. DOI:10.1007/978-3-319-47024-5_8.
Ullah, R., Mengistu, E.Z., van Elzakker, C.P.J.M. and Kraak, M.J. (2016). Usability evaluation of centered time cartograms. Open Geosciences, 8 (1), 337–359. DOI:10.1515/geo-2016-0035.
Vondrakova, A. and Popelka, S. (2014). The use of eye-tracking for the evaluation of various cartographic tasks. Proceedings of the 14th International Multidisciplinary Scientific Geoconference, Albena, Bulgaria, June 17–26, 981–988.
Wang, S., Chen, Y., Yuan, Y., Ye, H. and Zheng, S. (2016). Visualizing the intellectual structure of eye movement research in cartography. ISPRS Int. J. Geo-Inf, 5(10), 168. DOI:10.3390/ijgi5100168. Williams, L. G. (1971). The Role Of The User In The Map Communication Process: Obtaining
Infor-mation From Displays With Discrete Elements. Cartographica: The International Journal for
Geo-graphic Information and Geovisualization, 8(2), 29–34.
Zittoun T., and Brinkmann S. (2012). Learning as Meaning Making. In: Seel N.M. (eds.) Encyclopedia of