HAL Id: hal-02092538
https://hal.archives-ouvertes.fr/hal-02092538
Submitted on 8 Apr 2019
HAL is a multi-disciplinary open access
archive for the deposit and dissemination of sci-entific research documents, whether they are pub-lished or not. The documents may come from teaching and research institutions in France or abroad, or from public or private research centers.
L’archive ouverte pluridisciplinaire HAL, est destinée au dépôt et à la diffusion de documents scientifiques de niveau recherche, publiés ou non, émanant des établissements d’enseignement et de recherche français ou étrangers, des laboratoires publics ou privés.
Entire Life Time Monitoring of Filament Wound
Composite Cylinders Using Bragg Grating Sensors: II.
Process Monitoring
Hilario Hernández-Moreno, Francis Collombet, Bernard Douchin, Dominique
Choqueuse, Peter Davies, J. González Velázquez
To cite this version:
Hilario Hernández-Moreno, Francis Collombet, Bernard Douchin, Dominique Choqueuse, Peter Davies, et al.. Entire Life Time Monitoring of Filament Wound Composite Cylinders Using Bragg Grating Sensors: II. Process Monitoring. Applied Composite Materials, Springer Verlag (Germany), 2009, 16 (4), pp.197-209. �10.1007/s10443-009-9088-4�. �hal-02092538�
e note th at this is an aut hor-pr oduc ed PDF of an article a cce pted for publ icatio n foll owin g pe er revi ew. T he defin iti v e pu b lish e r-a uthentic ated ve rsion is av ail a b le on the pub lis her W eb site
Applied Composite Materials
August 2009, Volume 16, Number 4 : Pages 197-209
http://dx.doi.org/10.1007/s10443-009-9088-4 © 2009 Springer. Part of Springer Science+Business Media
The original publication is available at http://www.springerlink.com
Archimer, archive institutionnelle de l’Ifremer
http://www.ifremer.fr/docelec/
Entire Life Time Monitoring of Filament Wound Composite Cylinders
Using Bragg Grating Sensors: II. Process Monitoring
H. Hernández-Moreno1, 2, F. Collombet1, *, B. Douchin1, D. Choqueuse3, P. Davies3 and J. L. González
Velázquez4
1
INSA, UPS, Mines Albi, ISAE; ICA (Institut Clément Ader), Université de Toulouse, 133c, avenue de Rangueil, 31077 Toulouse, France
2
Instituto Politécnico Nacional, ESIME Unidad Ticomán, Av. Ticomán No. 600, Col. San José Ticomán, 07340 México D. F., México
3
IFREMER Materials & Structures group, Brest Centre, BP70, 29280 Plouzané, France
4
Instituto Politécnico Nacional, ESIQIE, Unidad Profesional Adolfo López Mateos, Edificio 8, Zacatenco, C.P. 07738 México D. F., México
*: Corresponding author : F. Collombet, email address : francis.collombet@iut-tlse3.fr
Abstract:
This article is the second of a series of three papers concerning monitoring of filament wound cylinders using Bragg gratings. In this second part, the tooling presented in Part I is used to embed gratings and thermocouples in filament wound glass reinforced epoxy composite cylinders during fabrication. Bragg grating strain was obtained from wavelength and temperature response, by a calibration technique described here. Results from tests on five cylinders show the Bragg grating’s capability to monitor strain evolution during fabrication, and the capacity to detect several phenomena occurring during cure is established, in addition to quantifying the initial material condition of the cylinder before it enters service.
1. Introduction
Composite cylinders are very attractive for replacing metallic cylinders where corrosion resistance and light weight are at a premium, notably for underwater applications. The initial material condition is important and its characterization must be made during the curing stage because at this time residual stresses or strains are generated. These stresses and strains contribute to defect formation, which can be present in the material even before service. These defects are present in the form of internal delaminations [1] and fiber distortion [2]. One way which has been explored for monitoring the fabrication process of composites is the use of strain and temperature sensors embedded in the material. In filament wound composites, the fabrication process implies maintaining the composite in continuous rotation, so data acquisition is difficult. In recent years optical fiber based sensors, such as Bragg gratings, have been increasingly used for in situ strain and temperature monitoring. They produce a minimum host material perturbation [3][4], are compatible with the host material [5], and have been reported to be easy to embed in composite plates [6]. To adapt this kind of instrumentation to the filament winding process, it is first necessary to develop a technique for fiber optic placement during winding, and next to have an interface between sensors (rotating with the piece) and the sensor interrogating instruments, which are stationary; this has been achieved, as explained in the companion paper (see Part I).
The initial material condition is evaluated in this second part, by measuring strain and temperature evolution during fabrication. In order to do this, embedded instrumentation is used, including Bragg gratings and thermocouples according to a methodology presented in Part I. Monitoring tests have been performed, on five nominally identical cylinders, in order to measure both strain and temperature (axial and circumferential strain) throughout the fabrication process. These experiments enable characteristic points in the process to be identified and residual strain in the composite cylinder to be measured, making it possible to obtain experimental mean strain values for the initial material condition.
As noted in Part I, there are very few published papers on the monitoring of the fabrication process in filament wound cylinders. Stringer et al [2] used embedded Bragg gratings for measuring residual strains, by collecting data - only before and after fabrication -using strain gages and piezo-electric sensors, both embedded. References [7-9] describe in-service monitoring. Fabrication monitoring has received less attention, Lee et al [10] monitored cure of thick cylinders using thermocouples, but no papers have been found which report studies of the strain and temperature monitoring during fabrication of rotating filament wound cylinders using fiber optic Bragg gratings.
2. Specimen characteristics and fabrication process
The cylinders used in this research are thin-walled, having a thickness of 4.42 mm, the reinforcement fiber is continuous E-glass roving (1200 tex), with a 3.5mm width. The winding has a pattern of 1 or 5 rhomboids (2 and 3 specimens respectively) in the circumferential direction. The final length of 350mm was obtained by a machining operation, in order to test the cylinder in a hyperbaric chamber (see Part III). The number of layers s 7. At both ends of the cylinder there are zones of reinforcing fibers, with an angle of 90° to the cylinder axis. Composite cylinders were fabricated by the filament winding process; a detailed explanation of this can be found in Part I and in [11]. The fiber orientation has an angle of ±55° to the cylinder long axis, which is a classical winding angle used for pressure vessels where circumferential stress is twice the axial stress. The matrix system is a mixture of Araldite LY 5052 epoxy and hardener HY 5052. The theoretical curing cycle begins with a ramp of 3°C per minute for 10 minutes. At 50°C the temperature is maintained constant for 900 minutes, next a cooling ramp of 1°C per minute is applied until 40°C where the oven cycle finishes.
For instrumenting composite cylinders with thermocouples and optical fiber sensors such as Bragg gratings, a special mandrel and a winding machine rotary – static cable interface were designed, as explained in the companion paper (see Part I) and detailed information can be found in [12] and [13].
3. Instrumentation characteristics
Bragg grating sensors for strain measurement in this research have a nominal Bragg wave length between 1530 and 1550 nm. The Bragg grating length is 10 mm and is it is uniformly inscribed by UV with a phase mask and apodization in a 125 m diameter optical fiber having a polyacrylate coating (SMF-28e®). It is used to measure a mean strain value over the sensor length. Thermocouples are of K type with 250 m diameter and glass fiber coating. Optical fibers containing Bragg gratings are aligned in the axial and circumferential cylinder directions, and a thermocouple is placed next to each Bragg grating.
The Bragg grating is a periodical refraction index variation in the optical fiber core, over a finite length, working as a series of optical mirrors. The refraction index period is called the grating period and when the grating is reached by a luminescent signal, the reflected portion is in a very narrow band having a central wavelength called Bragg wavelength B. Temperature variation T, and longitudinal strain all produce a wavelength shift B; the simplified grating behavior can be written as equation 1: with aB, and bB being the sensitivities to temperature, strain respectively.
B a BTb B (1)
The grating response to hydrostatic pressure is neglected in many applications, because the temperature and strain responses are much more important (Kang [9]), and also Bragg gratings are embedded in the material exposed to shell strains and not to hydrostatic pressure (see Part III). To decouple strain and temperature responses, the technique used here is to characterize the thermo-optical sensor response in an initial step, before it is embedded in the material. Once the thermal response is known, the strain can be obtained. The sensor response (total wave length shift ) is the sum of the thermal wavelength shift
T (first term of the right side in eq. 1) and the strain wavelength shift (second term of the right side in eq. 1), these wavelength shift contributions can be expressed in terms of absolute wavelength components, as expressed in equation 2.
Lreading
(
T
)
b
B(2)
where (T) can be expressed by equation 3 as:
)
(
)
(
T
a
BT
0a
BT
0
(3)where: 0 is the absolute wavelength when the sensor is free of strain, and is exposed to temperature T0; reading is the absolute wavelength, indicated by the interrogation instrument at any sensor condition; is the absolute wavelength indicated when only a T-T0 temperature variation is imposed.
Equation 3 represents the theoretical sensor response in the presence of only a temperature change, and can be substituted by an equation obtained experimentally. The fiber axial strain can be extracted from the absolute wavelength read from the interrogator instrument (Micron Optics SI 425), using equation 4:
reading erimental
BT
b
(
)
exp1
(4)The temperature calibration technique consisted of placing each grating in a recipient containing water. Gratings were installed free of constraint so they only react to temperature change. The recipient was heated slowly in order to conserve quasi static conditions. Absolute grating wavelength response was registered at regular intervals from 20°C (room temperature) to 100°C (approximately, 1 reading per °C). This calibration in temperature showed a linear response (as previously stated theoretically in equation 7) so a linear regression was obtained for each grating, having the form of equation 5:
(
T
)
experimental
m
T
b
(5)Table 1 shows the values of “m”, “b” and “a” for each grating. It can be seen that the thermo-optic coefficient a has a mean value about 6.66.10-6/°C, and the thermal sensitivity has a value of about 10.287 pm/°C. This agrees with published values [14] of between 10.18 and 10.29 pm/°C. Caucheteur et al [15] obtained thermal sensitivities between 10.12 to 10.52 pm/°C, for 1534 nm Bragg wavelength gratings.
Fiber axial strain can be readily obtained using the constants shown in Table 1 and the absolute wavelength reading, using equation 6:
m
T
b
b
B reading
1
(6)4. Results and analysis
Tests were performed to measure in situ strain and temperature during the winding and cure of six cylinders. All but one had one axial and one circumferential Bragg grating were placed over the first filament winding ply. The first test (cylinder number 11, had only one Bragg grating in the circumferential direction [13]. Cylinder number 32 had two Bragg gratings, but only one optical channel functioned during testing. During testing of cylinder 34 data acquisition was performed manually, for all the others continuous recording was used. Results are presented and analyzed according to four aspects: temperature vs. time; strain vs. time; axial and circumferential strain vs. temperature (thermo-elastic response), axial and circumferential strain vs. time during winding. As an illustration, experimental curves from cylinder 36 are used as an example of a typical test. From these results several events in the manufacturing process have been identified, which can be grouped in two classes: first, points limiting the different phases and second, points where material transformations occurred (limit of a material behavior). The corresponding explanation is presented in Table 2, and the experimental values are shown in Table 3. From these data, curves (with average values) are obtained, in order to illustrate a generic behavior, and they are presented and explained in parallel with the typical test curves.
4.1. Thermocouple temperature response
In figure 1a, the experimental temperature response from cylinder 36 is presented. Two curves are plotted: one from the thermocouple placed beside the axial Bragg grating, and the second from the thermocouple next to the circumferential Bragg grating. Measured temperature curves show, in the first segment (winding phase), a temperature change, which is due to a raise in ambient temperature. In the next segment (curing cycle) the temperature follows the ideal curing cycle. The only difference is in the plateau segment. Due to the precision in oven control, the measured response lies between 55°C and 60°C instead of 50°C (the theoretical cure temperature). In figure 1b, the mean temperature is plotted, constructed from the characteristic points. Making the comparison, one can observe a similar form between individual and mean curves. It may also be noted that mean values obtained
from both sensors are almost the same, indicating no significant variation of temperature related to sensor position.
4.2. Bragg grating strain response
Individual and mean strain curves are also similar. In figure 2a, axial and circumferential strains from optical sensors in one cylinder are plotted, a difference between the strains is observed. In the winding phase (segment 1-2), strains show a wavy behavior due to optical fiber manipulation during winding (explained later in this article), but during curing this wavy behavior disappears. Strain values at the end of the winding phase are almost zero, as the resin is still liquid and there is no bond between the resin and the optical fiber, so the Bragg grating is only exposed to thermal loads. At the beginning of the curing cycle, both strains climb as the temperature rises during curing cycle heating, this behavior corroborates the fact that during the test, the start of polymerization was noted at the end of the winding phase. A characteristic point is observed before the end of the warm up phase (point “a”), where axial strain changes from a positive slope to negative, even though the heating phase is not yet finished, this indicates the beginning of a material transformation. This point coincides with the gel of the resin system used (58 °C) (Ioualalen [16]). The circumferential strain does not indicate this characteristic point and circumferential strain follows the temperature. It may be noted here, that the composite cylinder over the mandrel is free of constraint in the axial direction. Nevertheless in the circumferential direction, the composite must follow the mandrel expansion during heating, this may be the reason why the characteristic point “a” is not detected by circumferential strain. Another characteristic behavior is that during the constant temperature phase in the curing cycle (segment 5-6), axial strain decreases to zero, while circumferential strain remains almost constant, this behavior indicates a transformation within the material (axial strain release), which is related to the polymerization process. During the cooling phase (segment 6-7) both strains follows the temperature, and one can suppose that polymerization has finished and strain evolution is due to thermo-elastic behavior. After the curing cycle, strain values are not zero, which indicates the presence of residual strains within the material. In the axial direction, specimens undergo a contraction (negative strain values) while in the circumferential direction positive values indicate an expansion. The latter may be related to mandrel expansion, because composite circumferential elongation is imposed by mandrel expansion. In figure 2b, the mean values of axial and circumferential strains from characteristic points are plotted, and the resulting curves have the same shape as the experimental curves shown in figure 2a. This suggests that this behavior is “generic”, common to all specimens.
4.3. Bragg grating strain response vs. thermocouple temperature
From the previous analysis (temperature and strain evolution), some segments with a correspondence between strain and temperature were observed, but it cannot be established whether this “proportionality” is related to composite thermo-elastic response or material transformations. To clarify this, in figure 3a, experimental axial strain response are presented versus thermocouple temperature.
During the winding phase (segment 1-2) and at the beginning of the curing cycle (immediately after point 4), there is no relationship between strain and temperature, but after point “a”, an almost linear relationship between axial strain and temperature is clearly observed until point “b” where proportionality is lost. In this part (segment a-b) it a thermo-elastic behavior can be assumed. Then during heating (segment b-c), a material transformation takes place because the proportionality between axial strain and temperature no longer exists, axial strain decreases even though temperature continues to climb, and also because this point is located at a temperature of 58 °C which is close to the gel temperature of the resin system (Ioualalen [16]). After point “c”, proportionality between axial strain and temperature is re-established, and again a thermo-elastic response is observed.
Beyond point “c”, one can assume that polymerization has finished and the composite cylinder reacts as a completely solid material. In figure 3b, the mean axial strain values from characteristic points are plotted versus mean temperature values. Here again the same behavior is noted, indicating that this is a generic response.
In both figures (3a and 3b), two trajectories can be clearly seen, the heating path (segment a-b) and the cooling down path (segment c-7), both are joined by a phase where material transformation occurs (segment b-c). In both trajectories, there is a thermo elastic response. If there was no material transformation (no change in thermo mechanical properties), both trajectories would be part of the same straight line. However between both trajectories, a part of the curve reveals no proportionality between strain and temperature. This is clear evidence of a transformation, and shows the capability of the embedded optical sensors to detect material transformation events. In figure 3a, during cooling down, there is a step in the curve at about 47 °C. This step marks the limit of two slopes. The first slope (to the right of the step) is the thermo elastic contraction in cooling down of the coupled system composed by the composite cylinder and the mandrel. Beyond the step, the thermo elastic response is solely due to the composite cylinder. This step corresponds to the instant where mechanical fretting between mandrel and composite cylinder disappears, and they react in separate ways.
Figure 4a presents the experimental circumferential strain versus temperature. The curve shape is similar to the axial strain versus temperature curve. It has the two paths (heating and cooling down), but the separation between them is about 100 , which is less than in the axial strain case (500 . In figure 4b, the mean circumferential strain values are plotted versus mean temperature values. In this figure, both paths are superposed and no separation in strain is noted. This is because circumferential strain scatter is of the same order of magnitude as the difference between heating and cooling down paths.
4.4. Event detection during winding
The scale of figure 2a is not convenient for the strain response analysis during the winding stage. Figure 5 is an appropriate zoom to present the circumferential strain evolution during winding of specimen number 36. This zoom transforms the rather noisy behavior shown in figure 2a into a record of the winding process history, where the most important events occurring during winding are recorded. The number and period of the waves correspond to the individual layers and indicate the time spent for the fiber placement.
Analyzing axial and circumferential strains of specimen 36 is performed using figure 5. The strain signal on the first segment, where no waviness is observed (here for 65 minutes), coincides with the first layer winding because obviously the sensors are not placed yet and they are free of constraint. At the beginning of the second layer winding, the sensors are placed on the first layer surface and are subsequently covered by the second layer (see sensor responses in figure 5 during 2nd layer winding). The total number of layers is seven and because during the first layer winding there is no signal variation, the number of weaves left corresponds to the layers after sensor placement. Once all layers are wound, a sequence of two over-windings on the cylinder extremities, having a 90° angle is commanded, this corresponds to the last part of the strain response. All these events are indicated in figure 5. The signal amplitude reduces as the number of layers grows because the distance between the sensor and the cylinder surface grows each time a layer is placed. The events explained in this subsection clearly demonstrate the sensibitivity of Bragg gratings to detect process
parameters such as the number of layers placed and time taken by those events, enabling them to be checked and recorded.
4.5. Residual strains
Strains at point 7 (see Table 3) can be considered to be residual. Each one was measured at a slightly different temperature, because ambient temperature was different at the end of each test. To make a comparison between the cylinders, a reference temperature must be adopted. For this, an extrapolation was carried out to estimate all strains at 21°C. This temperature was chosen because it is the temperature at which the laboratory clean room is maintained for cylinder storage. For specimens for which no experimental value of thermal expansion coefficient (cooling down slope) was identified, this mean value was applied. The extrapolated values for each specimen are shown in Table 3.
The mean value of axial residual strain is - 995 , and for the circumferential direction it is 134 , without taking into account the first test (specimen -11), because it was made using a PVC mandrel with a slight ovality. It can be stated that the absolute residual strain value in the axial direction is higher than the circumferential value, with an opposite sign. Axial residual strain indicates a contraction while circumferential indicates an expansion. These residual strain values are obtained for cylinders which have a diameter to thickness ratio of 28.4 (thin walled section), so it may be supposed that they have similar residual strains in the outer layers (small residual bending moment).
Thick walled cylinders, tested by Casari et al. [17] and having a diameter vs. thickness ratio of 8.5, were measured using strain gauges to have inner surface residual strains in the axial direction of about -79 , and -600 in circumferential direction. At the outer surface 60 and 500 values were measured. Here, there is a difference of about 1100 in the circumferential direction, which indicates an important bending moment. However, comparison between results obtained in this work and results obtained by [17] must be made with caution because the difference in diameter to thickness ratios is important, over 300 %.
4.6. Spectral observations
At different times during the fabrication process, spectral recordings were made, using an optical spectrum analyzer Micron Optics SI 425, in order to see if changes within the material had an influence on the Bragg grating spectral response. In figure 6, spectra before winding and after curing of the specimen 36 are presented, where it can be observed that the shape is not altered.
5. Conclusion and perspectives
The results presented here show that the integration of Bragg grating sensors during winding and curing for process monitoring of cylinder fabrication is a useful technique, enabling mean strain and temperature evolution within the material to be measured. Information acquired by in situ sensors can allow detection of different phenomena during winding and curing, providing a unique method for quality control. It allows the initial material state (residual strains) to be characterized, in a manner that can not be performed by classical instrumentation techniques. Significant axial residual strain values have been measured, which must be taken into account in cylinder design and stress analysis. The technique used here for in-situ strain and temperature monitoring can be readily applied to other composite systems more sensitive to residual strains. This makes in-situ fiber optic instrumentation a valuable tool to record the historical evolution of cylinder response, in terms of strain and
temperature during fabrication. In addition, embedded sensors remain inside the material over the lifetime of the cylinder, so they can be interrogated at any time during service, until final failure as will be presented in Part III.
Acknowledgments
H. Hernández Moreno wishes to thank the National Council of Science and Technology of Mexico (CONACYT) and the National Polytechnic Institute of Mexico (IPN) for their scholarship sponsoring. The authors thank Messrs. I. Fernandez Hernandez, J. Bauw, F. Afonso, and E. Vargas Rojas for their collaboration during their internship at LGMT.
References
1. Messager T, Pyrz M, Gineste B, Chauchot P. Optimal laminations of thin underwater composite cylindrical vessels. Composite Structures. 2002/12, Vol. 58, Issue 4, p. 529-537. 2. Stringer LG, Hayman RJ, Hinton MJ, Badcock RA, Wisnom MR. Curing stresses in thick polymer composite components Part II: Management of residual stresses. Proceedings of the 12th ICCM, Paris (France), July 5th-9th, 1999. Ref. CD-ROM paper 861, p. 1-10.
3. Mulle M, Zitoune R, Collombet F, Olivier P, Grunevald Y-H. Thermal expansion of carbon– epoxy laminates measured with embedded FBGS – Comparison with other experimental techniques and numerical simulation. Composites Part A: Applied Science and Manufacturing, 2007/05, Vol. 38, Issue 5, p. 1414-1424.
4. Sorensen L, Botsis J, Gmür T, Cugnoni J,, Delamination detection and characterisation of bridging tractions using long FBG optical sensors, Composites Part A: Applied Science and Manufacturing, 2007/10, Vol. 38, issue 10, p. 2087-2096.
5. Herzberg I, Li H.C.H, Dharmawan F, Mouritz A.P, Nguyen M, Bayandor J. Damage assessment and monitoring of composite ship joins, Composite Structures, 2005/2, Vol. 67, Issue 2, p. 205-216.
6. Ramos C.A., de Oliveira R., Marques A.T. Design of an optical fibre sensor patch for longitudinal strain measurement in structures, Materials and Design, 2008, doi: 10.1016/j.matdes.2008.11.008.
7. Degrieck J, De Waele W, Verleysen P. Monitoring of fibre reinforced composites with embedded optical fibre Bragg sensors, with application to filament wound pressure vessels. NDTE Int. 2001, Vol. 34, Issue 4, p. 289-296.
8. Kang HK, Park JS, Kang DH, Kim CU, Hong CS, Kim CG. Strain monitoring of a filament wound composite tank using fiber Bragg grating sensors. Smart Mater Struct. 2002, Vol. 11, Issue 6, p. 848–853.
9. Brower DV. Structural properties measurements in deepwater oil and gas fields using an advanced fiber optic sensor monitoring system. SAMPE Journal, 2005, Vol. 41, 5, p. 6-9. 10. Lee DH, Kim SK, Lee WI, Ha SK, Tsai SW. Smart cure of thick composite filament wound structures to minimize the development of residual stresses. Comp. Part A. 2006, Vol. 37, Issue 4, p. 530-537.
11. Hernández-Moreno H, Douchin B, Collombet F, Choqueuse D, Davies P. Influence of winding pattern on the mechanical behavior of filament wound composite cylinders under external pressure. Composites Science and Technology. 2008/03, Vol. 68, Issues 3-4, p. 1015-1024.
12. Hernández-Moreno H, Douchin B, Collombet F, Davies P. Precise positioning of unit cells and embedded instrumentation for fabrication and pressure testing of filament wound tubes. 11th ECCM, Rhodes (Greece), May 31 – June 3, 2004, CD ROM.
13. Hernandez-Moreno H. Monitoring de la fabrication de tubes composites réalisés par enroulement filamentaire et comportement mécanique sous pression externe. PhD Thesis (in French). Paul Sabatier University. 2006, p. 1-238.
14. Frazão O, Ferreira LA, Araujo FM, Santos JL. Simultaneous measurement of strain and temperature using fibre Bragg gratings in a twisted configuration. J. Opt. A: Pure Appl. Opt, 2005, Vol. 7, Issue 8, p. 427-430.
15. Caucheteur C, Lhomme F, Chah K, Blondel M, Mégret P. Simultaneous strain and temperature sensor based on the numerical reconstruction of polarization maintaining fiber Bragg gratings. Opt Lasers Eng 2006, Vol. 44, Issue 5, p. 411-422.
16. Ioualalen K. Contribution à l’étude et au développement d’un nouveau matériau de remplissage structural constitué de sphères creuses à paroi polymère. PhD Thesis (in French). Paul Sabatier University. 1996.
17. Casari P, Jacquemin F, Davies P. Characterisation of residual stresses in wound composite tubes. Comp. Part A, 2006, Vol. 37, Issue 2, p. 337-343.
Figures
(a) (b)
Figure 1. Temperature response with a), typical experimental curve from cylinder 36 and b), mean temperature response from all specimens and characteristic points.
(a) (b) Figure 2. Strain response with a), typical experimental strain curves from cylinder 36 and b),
mean strains for all cylinders with characteristic points.
(a) (b)
Figure 3. Axial strain as a function of temperature with a), experimental axial strain and b), mean axial strain with characteristic points.
(a) (b)
Figure 4. Circumferential strain as a function of temperature with a), experimental circumferential strain and b) mean circumferential strain with characteristic points.
(a) (b) Figure 6. Bragg grating spectral response before winding and after curing, a) axial grating, b) circumferential Bragg grating.
Tables
Table 1. Bragg grating temperature response characteristics. Nominal wavelength (nm) m (nm/°C) b (nm) a (10 -6 /°C) Sensitivity (nm/°C) Specimen in which sensor is embedded 1530.331 0.0103 1530.067 6.8 0.0104 32 1560.013 0.0103 1559.757 6.5 0.0103 32 1530.081 0.0104 1529.860 6.8 0.0104 34 1559.868 0.0100 1559.658 6.4 0.0100 34 1535.133 0.0100 1534.960 6.5 0.0100 36 1550.071 0.0103 1549.894 6.6 0.0103 36 1535.155 0.0103 1534.974 6.7 0.0103 37 1550.055 0.0105 1549.900 6.7 0.0105 37
Table 2. Process characteristic phase identification. Points limiting different phases
Process phase
identification Phase description
1-2 Winding
3-4 Waiting phase between winding and curing cycle 4-5 Heating
5-6 Curing at constant temperature 6-7 Cooling
Points limiting material behavior or material transformation Characteristic point
identification Point description and transformation
a Point from which elastic response and thermo-elastic behavior begin to appear during heating
b Point where axial strain shows a fast decrease, and may indicate a transformation. From this point there is no elastic response nor thermo-elastic behavior
c Point at which a transformation occurs from semi liquid or liquid state to a solid state. Material again shows an elastic and thermo-elastic behavior
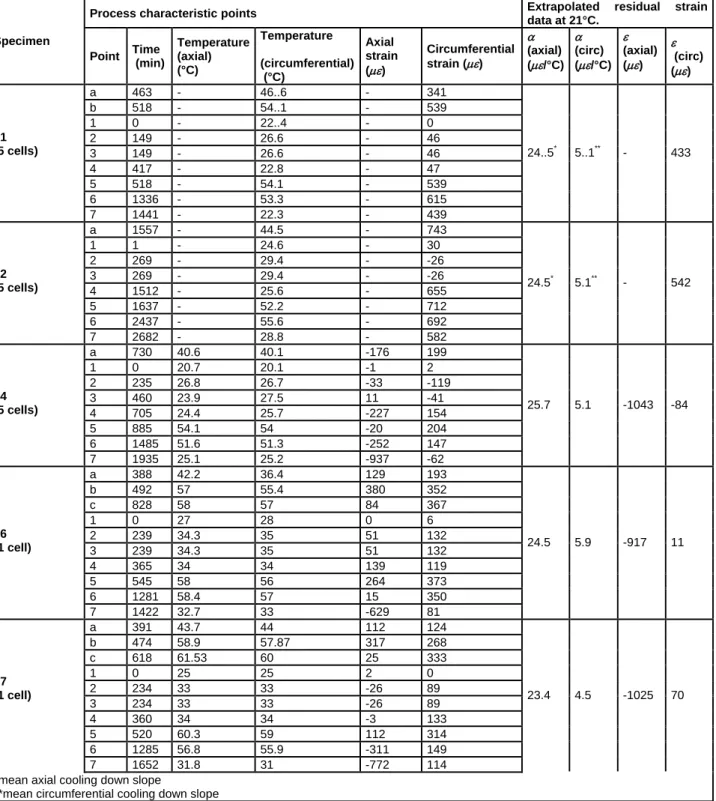
Table 3. Monitored experimental data.
Process characteristic points Extrapolated residual strain
data at 21°C. Specimen Point Time (min) Temperature (axial) (°C) Temperature (circumferential) (°C) Axial strain () Circumferential strain () (axial) (/°C) (circ) (/°C) (axial) () (circ) () a 463 - 46..6 - 341 b 518 - 54..1 - 539 1 0 - 22..4 - 0 2 149 - 26.6 - 46 3 149 - 26.6 - 46 4 417 - 22.8 - 47 5 518 - 54.1 - 539 6 1336 - 53.3 - 615 11 (5 cells) 7 1441 - 22.3 - 439 24..5* 5..1** - 433 a 1557 - 44.5 - 743 1 1 - 24.6 - 30 2 269 - 29.4 - -26 3 269 - 29.4 - -26 4 1512 - 25.6 - 655 5 1637 - 52.2 - 712 6 2437 - 55.6 - 692 32 (5 cells) 7 2682 - 28.8 - 582 24.5* 5.1** - 542 a 730 40.6 40.1 -176 199 1 0 20.7 20.1 -1 2 2 235 26.8 26.7 -33 -119 3 460 23.9 27.5 11 -41 4 705 24.4 25.7 -227 154 5 885 54.1 54 -20 204 6 1485 51.6 51.3 -252 147 34 (5 cells) 7 1935 25.1 25.2 -937 -62 25.7 5.1 -1043 -84 a 388 42.2 36.4 129 193 b 492 57 55.4 380 352 c 828 58 57 84 367 1 0 27 28 0 6 2 239 34.3 35 51 132 3 239 34.3 35 51 132 4 365 34 34 139 119 5 545 58 56 264 373 6 1281 58.4 57 15 350 36 (1 cell) 7 1422 32.7 33 -629 81 24.5 5.9 -917 11 a 391 43.7 44 112 124 b 474 58.9 57.87 317 268 c 618 61.53 60 25 333 1 0 25 25 2 0 2 234 33 33 -26 89 3 234 33 33 -26 89 4 360 34 34 -3 133 5 520 60.3 59 112 314 6 1285 56.8 55.9 -311 149 37 (1 cell) 7 1652 31.8 31 -772 114 23.4 4.5 -1025 70
*mean axial cooling down slope