This is an author-deposited version published in: http://oatao.univ-toulouse.fr/ Eprints ID: 9021
To link to this article:
http://www.ajol.info/index.php/jcas/article/view/87038
To cite this version : Kengni, Lucas and Tekoudjou, Hernes and Pamo
Tedonkeng, Etienne and Tankou, Christopher Mubeteneh and Lucas, Yves
and Probst, Jean-Luc Rainfall Variability along the Southern Flank of the
Bambouto Mountain(West-Cameroon). (2009) Journal of the Cameroon
academy of sciences, vol. 8 (n° 1). pp. 45-52. ISSN 9956-26-000-2
O
pen
A
rchive
T
oulouse
A
rchive
O
uverte (
OATAO
)
OATAO is an open access repository that collects the work of Toulouse researchers and makes it freely available over the web where possible.
Any correspondence concerning this service should be sent to the repository administrator: [email protected]
Rainfall Variability along the Southern Flank of the Bambouto Mountain
(West-Cameroon)
KENGNI L.
1*,TEKOUDJOU H.
2, TEMATIO P.
1, PAMO TEDONKENG E.
3, TANKOU C.M.
4,
LUCAS Y.
5and PROBST J.L.
61 - Univ. Dschang, Faculty of Science, Department of Earth Science, P.O. Box 67 Dschang 2 - Univ. Yaoundé I, Faculty of Science, Department of Earth Science, P.O. Box 812 Yaoundé
3 - Univ. Dschang, Faculty of Agronomy and Agricultural Science, Department of Animal Science, P.O. Box 222 Dschang 4 - Univ. Dschang, Faculty of Agronomy and Agricultural Science, Department of Crop Science, P.O. Box 222 Dschang 5 - Univ. Sud Toulon Var, Laboratoire PROTEE, P.O. Box 20132 - 83957 LA GARDE Cedex - France
6 - LMTG, UMR 5563 CNRS/IRD/UPS, 14 Avenue Edouard Belin, 31400 Toulouse, France
ABSTRACT
This paper presents the rainfall variability along the southern flank of the Bambouto mountain. Data were collected from rain gauges, while spatial variability was estimated through daily recorded data. Monthly and annual data were used to draw isohyetes via the triangular method, with linear interpolations between observation points. Results show that rainfall is highly variable along the slope. Daily rainfall amounts range from 0.1 mm to 120 mm. Mean yearly rainfall is 1918.1 mm. Rainfall amount does not have a linear relationship with altitude. Dschang is characterised by abnormally high rainfall. Following a North-South direction, rainfall decreases from Dschang to a Melang-Loung-Djuttitsa axis. From this axis, the gradient reverses as rainfall increases rapidly towards the Mélétan mountain. The existence of the relatively dry zone within the hillside seems to be due to the influence of two air masses. The first is cold and very wet which moves from the Mamfe basin to the summit zone where it starts to warm up as it flows towards Melang and Loung where temperature increases. The second comes from the south to south-east monsoon which is also impoverished during the ascension to higher altitudes. It is also likely that a third air mass from the dry harmattan is involved depending on the position of the ITCZ.
Key words: rainfall, spatial variability, gradient, slope, mountain. RESUME
Une étude a été entreprise dans le but de mettre en évidence la variabilité pluviométrique à petite échelle sur le flanc sud des Monts Bambouto où les altitudes varient de 800 m dans la plaine des Mbo à 2740 m au Mont Mélétan. Quinze postes pluviométriques ont été relevés sur la période s'étendant de novembre 2002 à octobre 2003. L'étude de la variabilité met en œuvre le tracé des isohyètes mensuelles et annuelles basé sur la méthode des triangles, avec interpolation linéaire pour tous les segments. Il en découle une définition et caractérisation du gradient pluviométrique tant avec l'altitude qu'avec la distance. La pluviométrie est très variable sur le versant. La pluie journalière varie de 0,1 à 120 mm. La pluie annuelle moyenne a été de 1918,1mm. Suivant un axe S-N, à partir de Dschang, le gradient pluviométrique est négatif jusqu'à un axe de faible pluviométrie (Loung-Melang-Djuttitsa) et redevient positif vers la zone sommitale. De nombreux courants d'air tels que l'harmattan venant du nord-est et les vents humides venant du sud-est ou du sud-ouest, associés à des interférences de phénomènes multiformes (latitude, continentalité ou orientation des pentes) occasionnent cette grande complexité spatiale autour du massif dont la conséquence est la grande variabilité des précipitations.
Mots clés : pluviométrie, variabilité, gradient, massif.
*
Corresponding author : Dr Lucas KENGNIUniv. Dschang, Faculty of Science, Department of Earth Science, P.O. Box 67 Dschang. E-mail : [email protected], phone (237)99819122, fax (237)33451202
INTRODUCTION
As any natural phenomenon, rainfall is subject to great spatial and temporal variation, due to the general circulation pattern and local factors (Chow et al., 1974). At a small scale, variations are due to the local relief or nature of the landscape, the effect of continentality and the exposure to wind (Richardson et al., 2004). These factors are present in the Bambouto mountain
where a great dissymmetry can be observed from the northern to the southern flank (Morin, 1988). The southern flank constitutes the "bread basket" of the country and most of her neighbours, based on crop and livestock production which sometimes results in the conflict over soil and water use. Water resources are essential in the efficient use of soil by vegetation. They constitute the major climatic risk of agrarian
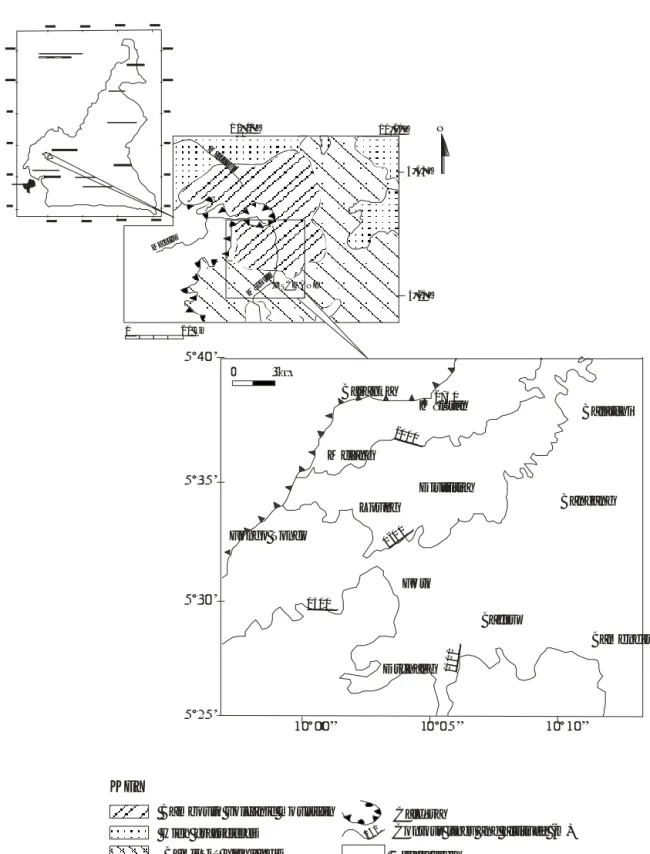
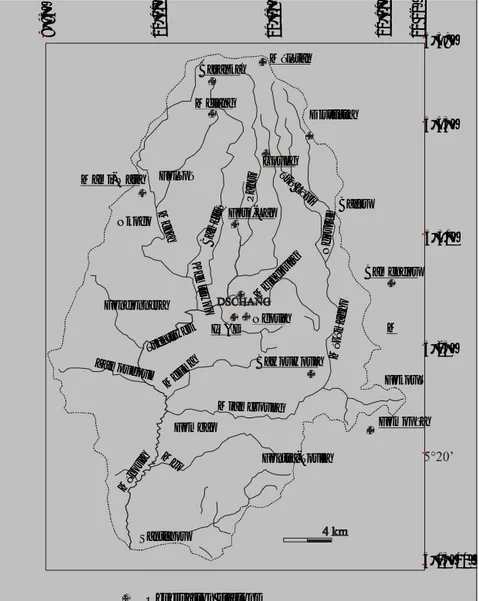
20 km 5°25’ 10°20’ 1 0° 00 ’ 5°45’ Mén o ua M entchu m DSCHANG Manyu N 0 Caldéra
Contour lines and altitude (m)
1450
Bamilé ké highland s High grassfiel ds
Study area KEY
Ba mbouto volcanic mo unta in
Bame ndou Bangang Ba fou Dschang Fo to Loung Djuttitsa Fongo Tongo Melang Bara nka Mélétan Balatchi 140 0 1400 1 60 0 2000 2740
systems. It is in the framework of characterizing the variability at a small scale that studies have been undertaken along this flank. In the past, stations were set up for the estimation of general climatological data at the meteorological station of Dschang town. The meteorological station of Djuttitsa was for local industrial needs of CTE - Cameroon Tea Estate, (for mer CDC - Cameroon Development Corporation). Data from these stations have provided some basic hydrologic information such as water balance, flow regime or rainfall regime (Olivry, 1986). Valet (1985) reported a particular climate in the region compared to those situated at the same altitude. Other local climatic conditions have been stated by Ngoufo (1988) and Tsalefac (1999) who suggested, despite the lack of numerical data, a decrease of rainfall with elevation. Lack of precise information can be attributed to the dearth of appropriate climatic data for all the different elevations.
The present theme is focused on the study of the spatial variability of rainfall, using numerical data recorded at different locations within the Menoua river watershed which validly represents the southern flank of the Bambouto mountain. Altitude ranges from 800 m to 2740 m a.s.l. This difference in altitude brings about many microclimates which account for the diversity of agricultural activities in the area. The study intends i) to appreciate rainfall variability along the slope, ii) to determine the altitudinal and distance rainfall gradients and to, iii) to find out the directions of air masses found along the slope.
The study was supported by IAEA project (CMR/5/ 009) which is aimed at improving local ruminant productivity and integration of agroforestry and livestock in West-Cameroon highlands.
MATERIALS AND METHODS Experimental site
The study area is located within the West Cameroon Highlands and occupies the southern slope of the Bambouto mountain (figure 1). The surrounding region is a part of a complex structure known as "The Cameroon Line". The region is dominated by a Precambrian granito-gneissic basement complex covered by various volcanic rocks (Tchoua, 1974). Intensive agriculture is predominant with scarce fallow lands dominated by Pteridium aquilinum, Rafia vinifera,
Eucalyptus grandis, Imperata cylindrica, Pennisetum purpureum
and the crops cultivated include maize, beans, potatoes
and tea (Kuété, 1999 ; Morin, 1988). The intensive cattle breeding constitutes an additional stress in the upper zone, where conflicting use of water and land resources is often observed.
The study area comprises the Menoua river watershed that extends to over 655 km2. This watershed is drained
by a fifth order stream (Ménoua), through the contribution of many streams that take their rise from the high elevation zone. The altitude ranges from 800 m to 2740 m a.s.l. Three successive morphological domains separated by more or less pronounced escarpment starting from the summit of the flank are: the upper zone (higher than 2000 m), the mid elevation zone (from 1600 m to 2000 m) and the lower zone (from 1400 m to 1600 m) (Morin, 1988). The landscape is characteristic of the West Cameroon Highlands.
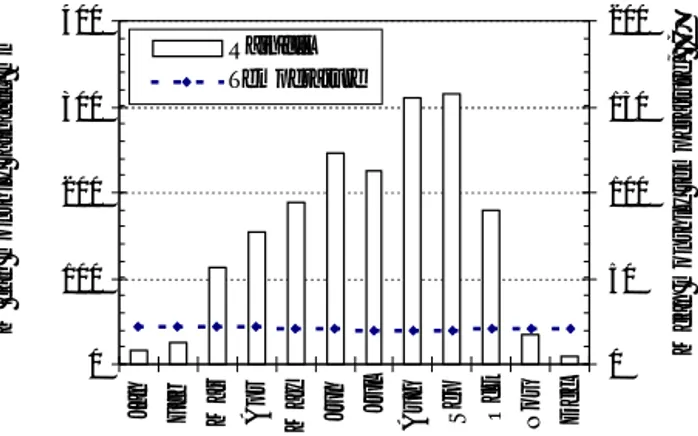
The climate is characterized by the alternation between a wet and a dry season of variable intensity (figure 2). The mean annual rainfall calculated from 1910 to 2000 records at Dschang meteorological station is 1873.2±208.9 mm. The temperature is fairly constant throughout the year, the mean air temperature is 18.9°C, with the highest monthly mean of 23.4°C between March and April and the lowest (14.3°C) in December.
Data measurements
The only viable approach for characterizing rainfall variability in this environment is the collection of data using appropriate instrumentation, because phenomena combine and interact to influence the local meteorology and especially rainfall and its spatial distribution (Vetter, 2004). Daily rainfall data were collected using 10 rain gauge network installed along the slope, according to the recommendations of the manufacturers. Rain gauges were of two types : three of them had a reception surface of 400 cm2 (Dschang Météo, IRAD, Djuttitsa)
and the others had 113 cm2 surface area. Both had a
0 100 200 300 400 Ja n F e b M a r A p r M a y Ju n Ju l A u g S e p O c t N o v D e c 0 50 100 150 200 Rainfall Temperature M e a n m o n th ly r a in fa ll , m m M e a n m o n th ly t e m p e ra tu re , °C
graduated measuring glass tube that allowed direct reading of the amount of daily rainfall. Their position and elevation are shown in table 1 and figure 3. It is noteworthy that the network was dense enough, at least 1 rain-gauge per 47 km2, compared to minimum
standards given by the WMO for mountainous area i.e. 1 rain-gauge per 250 km2 (Cosandey and Robinson,
2000).
Spatial variability
Spatial variability was estimated through monthly and annual data computed from rainy days and daily records. The mean values were calculated, with corresponding standard deviations and eventually the coefficient of variation. The monthly and annual data were then reported on a map. Although geostatistical methods exist like kriging to map rainfall by the use of elevation (Phillips et al., 1992 ; Goovaerts, 2000), we drew isohyetes using the triangular method, with linear interpolations between observation points. Isohyetes were drawn in the heart of the rainy season as times series were incomplete at Mami-Wata from November to May. Our approach considers that the rainfall amount at any position is influenced by the relief and this provides the necessary information for drawing the rainfall maps (Cosandey and Robinson, 2000). From the maps, we also derived rainfall gradient as a function of the distance or difference of elevation between stations.
Stations Symbol Geographic coordinates Elevation (m) latitude longitude Mélétan MLT 5038'08'' 10°04'43'' 2608 Melang MLG 5°35'26'' 10°02'24'' 2232 Loung LNG 5°33'26'' 10°04'59'' 1838 Djuttitsa DJU 5°35'00" 10°05'02" 1890 Mami-Wata MMW 5°32'44'' 09°59'44'' 1626 Dschang MDS 5°27'08'' 10°03'46'' 1400 Bamendou BMD 5°26'35'' 10°10'43'' 1568 Ngoua II NGO 5°26'20'' 10°04'13'' 1445 IRAD IRA 5°25'00" 10°04'00" 1390 Bawouwoua BWW 5°23'40'' 10°07'13'' 1536
Table I : Location of Rain Gauge stations
5°15’00’’ 5°25’ 5°30’ 5°35’ 5°39’ 9 °9 5 ’ 1 0 °0 0 ’ 1 0 °0 5 ’ 1 0 °1 0 ’ 1 0 1 2 ’ Santchou Observation stations Mélétan Djuttitsa Bafou Folépé Fokoué Fontsa-Toula Fombap Fondonnera Nkogo Zamougoum Mén oua M bo Miamezoung Mej ima M ena Mbi ndou ng Nd o uze m Tsé Lépi Ba met sé K em tsw op Pa nto Baranka Melang Loung Mami-Wata Foto-Lap Bamendou M Fomopéa Bawouwoua IRAD Ngoua Tsents wet Mé zém ag ho
Fig. 3: Location of rain gauge stations in Menoua watershed
RESULTS
Data were collected from November 2002 to October 2003.
Days of rainfall and daily rainfall variability
On the flank, the average annual number of rainy days was 154.6 ( 21.3) which represents 42% of the number of days in the year (table 2). The maximum was obser ved in Dschang town (190 days) and the minimum in the eastern part at Bamendou (119 days). There were 160 days of rainfall (DOR) at the summit
zone of Mélétan. Rainfall values lower than 15 mm are the most dominant (69.5 6% days of rainfall), while exceptional values (higher than 60mm) accounted for 1.3 1.1%. The maximum daily rainfall was highly variable having a standard deviation of 20.1mm. The highest value was recorded at Mélétan (120 mm) and the lowest at Djuttitsa (50.3mm). Rainfall lower than 5mm, although frequent (33.1 7.2% DOR) represented only 6.0 1.7% of annual rainfall. 80% of the rainfall ranged from 5mm to 45mm.
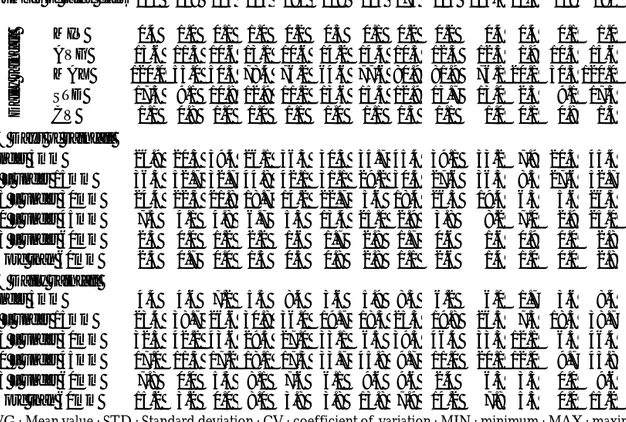
MLT MLG DJU LNG MDS BMD NGO IRA BWW AVG STD Min Max Number of rainy days 160 148 165 134 190 119 144 174 156 154.4 21.3 119 190
D ai ly r ai n fa ll MIN 0.4 1.0 0.1 1.0 0.2 0.3 0.1 0.2 0.2 0.4 0.4 0.1 1.0 AVG 15.6 11.5 10.6 13.1 10.6 14.2 14.4 10.3 12.3 12.5 1.9 10.3 15.6 MAX 120.0 55.0 50.3 78.4 76.2 64.6 77.6 80.9 81.9 76.1 20.1 50.3 120.0 STD 17.3 9.1 10.8 12.9 11.2 13.6 15.5 12.9 13.7 13.0 2.5 9.1 17.3 CV 1.1 0.8 1.0 1.0 1.1 1.0 1.1 1.3 1.1 1.0 0.1 0.8 1.3 % Days of rainfall under 5mm 26.9 20.3 39.4 26.1 36.3 30.3 34.7 45.4 39.1 33.2 7.9 20.3 45.4 5 – under 15mm 36.3 52.7 32.7 44.8 42.1 31.1 29.2 30.5 27.6 36.3 8.5 27.6 52.7 15 – under 30mm 24.4 22.3 21.8 18.7 14.2 22.7 5.6 18.4 26.3 19.4 6.3 5.6 26.3 30 – under 45mm 7.5 4.1 4.8 6.7 5.3 13.4 25.0 2.9 3.8 8.2 7.0 2.9 25.0 45 – under 60mm 2.5 0.0 1.2 2.2 1.6 1.7 2.8 1.7 0.6 1.6 0.9 0.0 2.8 More than 60mm 2.5 0.7 0.0 1.5 0.5 0.8 2.8 1.1 2.6 1.4 1.0 0.0 2.8 % Daily rainfall under 5mm 4.4 4.6 7.2 5.5 8.4 3.6 5.9 8.3 6.2 6.0 1.7 3.6 8.4 5 – under 15mm 23.4 38.7 26.6 30.8 36.0 19.7 18.3 25.3 19.8 26.5 7.3 18.3 38.7 15 – under 30mm 32.3 42.2 43.6 29.5 27.0 33.1 6.5 39.3 46.4 33.3 12.1 6.5 46.4 30 – under 45mm 17.0 11.3 17.2 18.1 17.3 33.7 45.8 9.7 11.0 20.1 12.0 9.7 45.8 45 – under 60mm 7.8 0.0 5.5 8.1 7.6 6.1 9.6 9.6 2.4 6.3 3.3 0.0 9.6 More than 60mm 15.2 3.2 0.0 8.0 3.8 3.8 13.8 7.9 14.2 7.8 5.5 0.0 15.2
Table 2: Statistics on daily rainfall on the southern flank of the Bambouto Mountain
Mois MLT MLG DJU LNG MMW MDS BMD NGO IRA BWW AVG STD CV Nov 56.6 112.0 34.2 44.1 33.3 31.5 52.6 33.3 38.2 48.4 25.5 0.5 Dec 0.0 0.0 5.9 0.0 6.6 23.9 91.7 0.9 1.8 14.5 29.9 2.1 Jan 0.0 0.0 0.0 0.0 8.8 0.0 9.2 6.9 16.0 4.5 5.9 1.3 Feb 37.3 0.0 39.1 62.5 63.3 99.5 6.9 37.4 80.0 47.3 32.4 0.7 Mar 16.6 6.5 20.7 13.2 81.8 76.0 38.1 76.0 85.6 46.1 33.3 0.7 Apr 142.8 87.0 202.7 141.2 133.0 101.3 160.9 119.3 168.0 139.6 35.3 0.3 May 177.8 131.2 141.7 164.5 240.2 167.0 188.6 156.6 148.4 168.4 32.2 0.2 Jun 306.1 230.0 258.9 235.6 324.7 281.9 122.6 262.6 242.8 190.8 236.8 53.9 0.2 Jul 718.4 292.0 282.9 291.0 561.4 328.1 279.9 209.0 260.0 247.6 323.2 151.9 0.5 Aug 485.0 377.0 345.1 346.8 536.2 332.8 226.0 440.3 309.8 301.4 351.6 76.5 0.2 Sep 297.3 272.6 270.4 282.2 488.6 259.8 238.5 313.8 285.4 303.4 280.4 23.2 0.1 Oct 269.4 200.0 163.0 178.5 246.4 259.9 352.6 296.4 262.5 342.2 257.2 67.3 0.3 Total 2507.3 1708.3 1764.6 1759.6 2029.5 1718.8 2070.1 1790.9 1923.4 1918.1 254.9 0.1
AVG : Mean value ; STD : Standard deviation ; CV : coefficient of variation ; MIN : minimum ; MAX : maximum
Table 3: Monthly and annual rainfall (mm) on the southern flank of the Bambouto Mountain
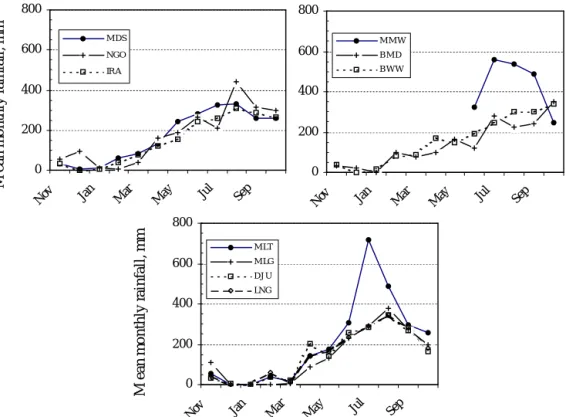
Monthly rainfall and monthly isohyetes
Monthly rainfall is presented in table 3 and shows that rainfall is insignificant in December and January (less than 19mm) as recorded in all the stations. February and March are also dry months at higher altitudes (Djuttitsa, Loung, Melang and Mélétan). The variability is low in the dry season but this rises in the heart of the rainy season (standard deviation 151.9mm). Taken individually (figure 4), Mami-Wata and Mélétan attained the maximum in July, Bamendou and Bawouwoua in October, while the others had their maximum in August.
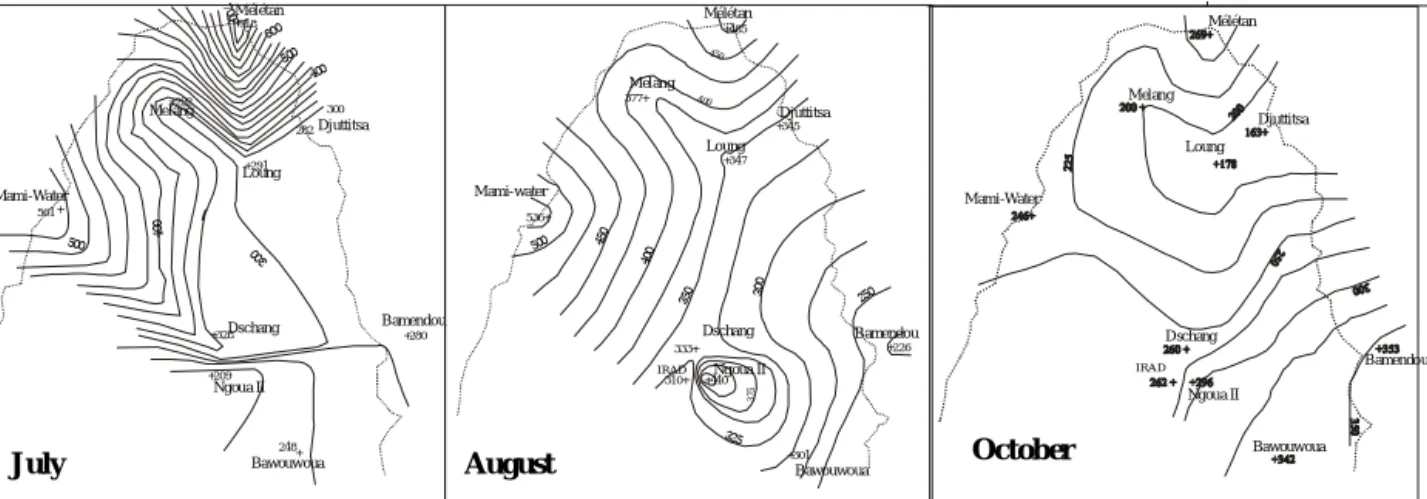
The spatial distribution showed that rainfall is always high at Mélétan, Mami-Wata and Dschang town (figure 5). The lowest values are encountered at Melang, Loung, Djuttitsa (and sometimes Bamendou) which correspond with the mid elevation zone.
Annual rainfall and annual isohyetes
Times series were incomplete at Mami-Wata from November 2002 to May 2003. An attempt to complete these data from correlation techniques failed, as coefficients of determination were lower than 0.8 and could not provide good results. Annual rainfall at that station was used as an indication which is however an underestimation of rainfall gradients since a significant part of the data was missing. At a yearly scale, mean rainfall was 1918.1 mm with a high standard deviation
of 254.9 mm. Higher values were recorded at Mélétan summit zone (2507.3mm). Mami-Wata, Dschang and Ngoua II showed values higher than 2000 mm. Dschang and Ngoua II are situated at the lower elevation zone (table 3). On the other side, Melang was the dryer station (1708.3 mm), as well as Djuttitsa, Loung and Bamendou. On the map (figure 6), these stations show a zone of least rainfall from the north west to south east. From this zone, rainfall increases both to the north and to the south.
DISCUSSION
Although the records covered a short time duration (November 2002 to October 2003), the results show the dynamics of rainfall in this mountainous watershed. On the average, we found 154.4 21.3 days of rainfall, with a maximum of 190 days in Dschang town. The maximum daily rainfall was 120 mm at Mélétan at the summit zone and 80% of the rainfall ranged from 5 to 45 mm.
Monthly rainfall was highly variable along the slope. Whatever the station, two seasons are distinct. Monthly rainfall is negligible from December to February when the continental powerful harmattan flux predominates while the maritime monsoon flux is inexistent. However, March is still dryer in the mid and higher elevation stations (MLT, MLG, DJU, LNG) which makes them
0 200 400 600 800 Nov Jan Mar May Ju l Sep M DS NGO IRA 0 200 400 600 800 Nov Jan Mar May Ju l Sep M LT M LG DJ U LNG 0 200 400 600 800 Nov Jan Mar May Ju l Sep M M W BM D BWW M e a n m o n th ly r a in fa ll , m m M e a n m o n th ly r a in fa ll , m m
Fig. 4: Monthly rainfall at different stations
MLT : Mélétan ; MLG : Melang ; LNG : Loung ; DJU : Djuttitsa ; MDS : Dschang meteorological station ; MMW : Mami-Wata ; BMD : Bamendou ; NGO : Ngoua II ; IRA : IRAD ; BWW : Bawouwoua
to have a longer dry season compared to the rest of the stations on the flank.
On the southern flank, rainfall is high in Dschang town, compared with the neighbouring stations at the same elevation. This situation has been described earlier (Ngoufo, 1988), as a consequence of the local landscape. The general landscape is made up of a hollow alveolar in the centre which is elevated at the borders. This situation entraps air inside that is warmed-up and creates rising movements leading to local rainfall. It would seem the increasing population of the town contributes to the phenomenon. This kind of rainfall generally does not extend laterally because the average wind speed is barely 2m/s based on local data (Olivry, 1986).
Mélétan at the summit is the wettest station. It is also the zone where frequent tornadoes are encountered, which can explain why despite its long dry season, annual rainfall is high. The atmosphere here is very cloudy towards the caldera. Rainfall from this station decreases sharply, as well as the elevation in the southern direction, up to the relatively dry zone along the Melang-Loung-Djuttitsa axis. The rainfall gradient varies from 90 mm/ km to 130 mm/km distance. From this axis, rainfall increases slowly to Dschang or probably sharply to Mami-Wata. The gradient here ranges from 20 mm/ km to 40 mm/km.
The relation between rainfall and elevation is not distinct. A simple linear regression of rainfall and elevation is not significant (figure 7). Rainfall variability is the conjunction of multiform interferences between factors, such as latitude, altitude, continentality, air masses conflicts and even slope orientation. The position of
Bamendou Bawouwoua Ngoua II Dschang Mami-Water Loung Djuttitsa Mélétan Melang 30 0 4 00 500 300 400 500 600 700 + 718 +280 + 248 +209 + +292 +291 282 561 +328 Loung Djuttitsa Mélétan Melang Mami-water Bamendou Bawouwoua Dschang IRAD Ngoua II +440 +301 536+ 333+ 310+ +347 +345 377+ +485 +226 350 400 450 500 3 00 250 325 3 7 5 400 450 August July October Bamendou Bawouwoua Ngoua II Dschang Mami-Water Loung Djuttitsa Mélétan Melang IRAD
Fig. 5: Monthly isohyetes
LNG DJU BWW MDS NGO MMW BMD IRA MLG MLT 1000 1500 2000 2500 3000 1000 1500 2000 2500 3000 Elevation, m A n n u a l ra in fa ll , m m
Fig. 7: Relation between rain gauge elevation and
annual rainfall
the relatively dry zone within the hillside seems to come from the existence of two air masses. The first is wet and moves in from Mamfé basin to the borders of the caldera. The cold clouds originate from the Atlantic monsoon from July, when the intertropical convergence zone (ITCZ) is high in latitude. Since rainfall is abundant, forest cover is permanent in the valley. This air reaches the border at the northern part of the flank where 2507.3 mm are recorded at Mélétan. From records, it is likely that Mami-Wata is influenced by the same air flux with more than 2200 mm of rainfall. While blowing down on the hillside, air becomes hot and dry due to temperature increase which accounts to the rapid decrease of rainfall. That's why little rainfall is recorded at Melang, Loung and Djuttitsa. It would also seem that the dry harmattan from the north-east hits the northern hillside of the Bambouto Mountain and comes along side the southern flank as a dry wind which is responsible for the rainfall deficit, as suggested by Tsalefac (1999). The other air masses come probably from oceanic winds which are slowly and successively impoverished during the ascension of the highlands. This is responsible for the gentle rainfall gradient recorded.
CONCLUSION
Although the records cover a short time duration (November 2002 to October 2003), the available results show the dynamics of rainfall on the watershed. The southern flank of the Bambouto mountain exhibits substantial rainfall variations over small distances. Spatial variability is evidenced through annual and monthly isohyetal curves drawn using the triangle method. The approach considered that rainfall heights at any position depend on the relief that is implicitly taken into account while drawing the isohyete maps. A simple linear regression of rainfall and elevation was not significant. Our results confirm previous uncertainties (Tsalefac, 1999 ; Ngoufo, 1998) that rainfall varies along the slope, with additional information that a relatively dry zone exists at the middle of the slope in the zone. The map developed from the study can enable one to determine rainfall amount at any given point in the slope. In summary, the variability of rainfall in the slope is due to the effects of relief, the distance from the sea and the exposure to wind.
REFERENCES
Cosandey C. And Robinson M. 2000 : Hydrologie continentale. Collection U, Géographie, Armand Colin, Paris, 360 p.
Chow V. T., Maidment D. R. And Mays L. W. 1974 : Applied hydrology. Mc Graw-Hill Series in Water Resources and Environmental Engineering, New York,
557p.
Goovaerts, P., 2000. Geostatistical approaches for incorporating elevation into the spatial interpolation of rainfall. Journal of hydrology, 228: 113-129.
Kuete M., 1999. Exploitation des ressources naturelles dans les environs de Dschang: Impact environnemental. In : Géosciences au Cameroun, J.P. Vicat et P. Bilong, ed., Collection Géocam, 2/1999, pp 47-54, Presse Univ. de Yaoundé.
Morin S., 1988. Les dissymétries fondamentales des hautes terres de l'Ouest- Cameroun et leurs conséquences sur l'occupation humaine: Exemple des monts Bambouto. In : L'homme et la montagne tropicale. Sepanrit ed., Bordeaux, pp 49-51.
Ngoufo R. 1988 : Les monts Bambouto: Environnement et utilisation de l'espace. Thèse Doct. 3è cycle, Géog. Phys., Univ de Yaoundé, 374 p.
Olivry J.C., 1986. Fleuves et rivières du Cameroun. Coll. Monographies Hydrologiques. ORSTOM. N° 9. Ed. MESRES- ORSTOM. 733 p.
Phillips, D.L., Dolph, J. And Marks, D., 1992. A comparison of geostatistical procedures for spatial analysis of precipitation in mountainous terrain. Agricultural and
Forest Meteorology, 58(1-2): 119-141.
Richardson A. D., Lee X. And Friedland A. J. 2004 Microclimatolog y of tree line spruce-fir forests in mountains of the north-eastern United States. Agricultural
and Forest Meteorology 125:53-66.
Tchoua F.M., 1974. Contribution à l'étude géologique et pétrographique de quelques volcans de la ligne du Cameroun (Monts Manengouba et Bambouto). Th Doct. d'Etat Univ . Clermont Ferrand, 337p + 75fig + 32pl + biblio.
Tematio P., Kengni L., Bitom D., Hodson M., Fopoussi J.C., Leumbe O., Mpakam H.G., Tsozué D. 2004 : Soils and their distribution on Bambouto volcanic mountain, West Cameroon highland, Central Africa. JAES 39:447-457.
Tsalefac M. 1999 : Variabilité climatique, crise économique et dynamique des milieux agraires sur les Hautes Terres de l'Ouest. Thèse Doct. d'Etat de géographie, Spécialité climatologie. Univ. de Yaoundé I, 515 p.
Valet S. 1985 : Notice explicative des cartes du climat des paysages agrogéologiques et des propositions d'aptitude à la mise en valeur des paysages agrogéologiques de l'Ouest Cameroun au 1/200000. CIRAT. IRAT, Montpellier, 120 p.
Vetter J. 2004 : Contribution d'un code de calcul météorologique méso-échelle à la climatologie des pluies en zone de relief. Thèse Docteur de l'INPG, Grenoble, Spécialité : " Mécanique des Milieux Géophysiques et