CHAPTER 63
Belgium: The Use of MATSim within an Estimation
Framework for Assessing Economic Impacts of
River Floods
Isma¨ı Saadi, Jacques Teller and Mario Cools
63.1
Problem Statement
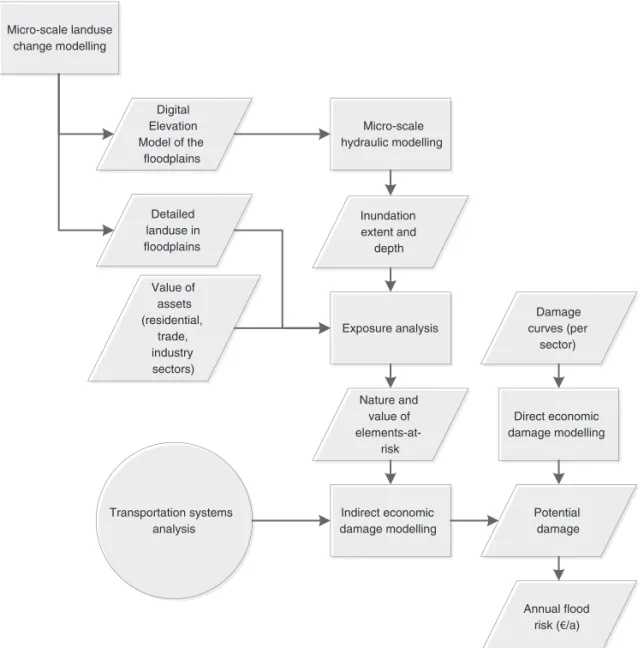
With the history of river floods in Belgium and the significant probability that such events will again take place in the near future, assessment of both direct and indirect economic impact was deemed essential to allow formulation of an adequate policy program and efficient flood risk man-agement. One proposal would assess flood risk at the micro-scale level: i.e., individual buildings for exposure analysis and direct economic damage estimation, individual companies for indi-rect economic damage estimation, 10 meter grid spacing for land-use modeling and individuals/ vehicles for transportation models. To enable this assessment, an integrated modeling framework combining different simulation theories from a multidisciplinary perspective is being developed. Figure 63.1 describes the procedure to measure the annual flood risk. A more detailed description of the whole modeling chain is available in Dewals et al. (2015).
A basic modeling framework premise is that different spatial pattern ’families’ might influence the damage intensity caused by river floods (e.g., land use change, transportation systems). In this chapter, we focus on how MATSim is being integrated into this overall framework, thus focusing on the TSA (Transport System Analysis) within the overall estimation procedure. For TSA, two configurations (freight and passenger model) are distinguished. For the passenger model, a MATSim scenario is developed on a national scale to simulate travel demand at base year 2010 and its evolution during the following years. The main objective is to study the effects of river floods on the transportation network and, consequently, on travel demand from an economic point of view. In addition, a freight travel demand model has been developed, to enable interactions between How to cite this book chapter:
Saadi, I, Teller, J and Cools, M. 2016. Belgium: The Use of MATSim within an Estimation Framework for Assessing Economic Impacts of River Floods. In: Horni, A, Nagel, K and Axhausen, K W. (eds.) The Multi-Agent Transport Simulation MATSim, Pp. 399–404. London: Ubiquity Press. DOI: http://dx.doi.org/ 10.5334/baw.63. License: CC-BY 4.0
Micro-scale landuse change modelling Digital Elevation Model of the floodplains Detailed landuse in floodplains Micro-scale hydraulic modelling Value of assets (residential, trade, industry sectors) Inundation extent and depth Exposure analysis Nature and value of elements-at-risk Damage curves (per sector) Direct economic damage modelling Indirect economic damage modelling Potential damage Annual flood risk ( /a) Transportation systems analysis
Figure 63.1:Economic impact estimation procedure.
passenger and goods flows. Note: at this time, this is still an aggregate four-step model, but development is ongoing to develop an agent-based model for the freight side.
63.2
Data Collection
As inputs, MATSim requires a synthetic population (or travel demand) file, as well as the related transportation network. Unfortunately, no recent census is available for the first input; the latest dates from 2001. To compensate, a synthetic population was derived from more recent travel sur-veys (e.g., Corn´elis et al., 2012) by employing a Gibbs sampler (Farooq et al., 2013). The Belgian National Household Travel Survey (e.g., Corn´elis et al., 2012) contains socio-demographics and activity travel diaries with a detailed description of activity start, end times and durations. Activity locations are also available, but at the municipality code level. They are generally accessed by us-ing the new municipalities referencus-ing system: LAU (Local Administrative Unit) level 2. For the transportation network, OSM network data has been used.
63.3
Input Preparation
63.3.1 Network
The network data of Belgium, downloaded in 2015, is available online from the OSM server. It consists of 100 467 nodes and 232 715 links. Network quality is generally acceptable, according to many MATSim users, even if manual adjustment is necessary for specific links.
63.3.2 Synthetic Population
Preparation of a synthetic population presents a significant challenge for this case study; only micro-data are available to enable population synthesis. From these partial views of the actual population, use of a Gibbs sampler enables the joint distribution (re-)construction. The outputs seem to be encouraging when comparing computed predictions to the reference dataset. Here, we propose testing the methodology by synthesizing some relevant variables for both transportation and urban systems simulations at the household level (see Figure 63.2).
63.3.3 Activity-Based Pattern Generation
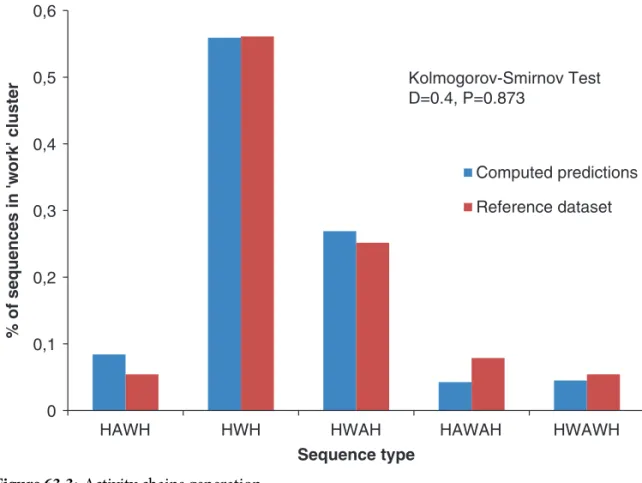
After the synthetic population has been generated, activity types, activity times and activity loca-tionsare generated and associated to the agents, using an activity-based pattern generator. Using a combined set of machine learning techniques, daily activity planners are generated for each agent. As shown in Figure 63.3, the model suggests some promising first results. The activity-pattern gen-erator is calibrated by using micro-data, such as activity travel diaries extracted from travel surveys.
0 500 1000 1500 2000 2500 3000 3500 1 2 3 4 5 6 Number of individuals Reference dataset Gibbs sampler 0 500 1000 1500 2000 2500 1 2 3 4 5 Dwelling type Reference dataset Gibbs sampler 0 200 400 600 800 1000 1200 1400 1600 1800 1 2 3 4 5 6 7 8 9 10 Income/month Reference dataset Gibbs sampler 0 500 1000 1500 2000 2500 3000 3500 4000 4500 0 1 2 3 4 >5 Number of cars Reference dataset Gibbs sampler
0 0,1 0,2 0,3 0,4 0,5 0,6
HAWH HWH HWAH HAWAH HWAWH
% of sequences in 'w ork' cluster Sequence type Computed predictions Reference dataset Kolmogorov-Smirnov Test D=0.4, P=0.873
Figure 63.3:Activity chains generation.
Calibration quality will be measured after analyzing MATSim scenario outputs when traffic counts are compared. If the comparison between observed and simulated traffic counts suggests a signif-icant deviation, a direct approach based on traffic counts (Cools et al., 2010) could work to adjust activity-based pattern generator parameters.
As outlined by Cools et al. (2011), uncertainties introduced by statistical distributions of ran-dom components in most activity-based models might be significant. Thus, some key indicators (e.g., sequences type proportions) will be investigated to measure micro-simulation error impact.
63.4
General Modeling Framework
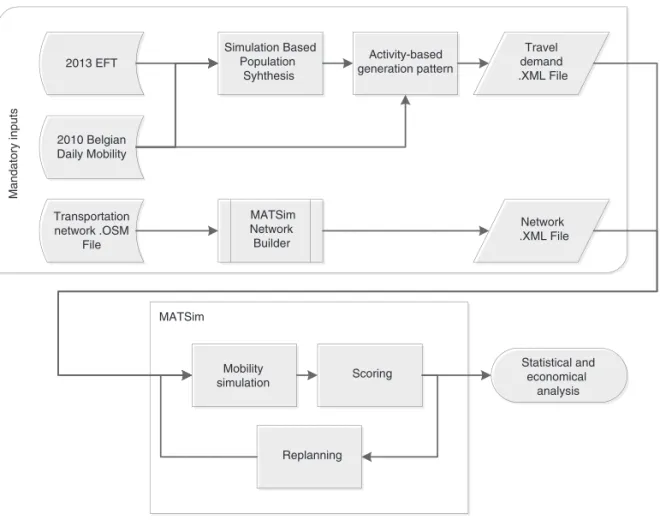
In Saadi et al. (2014), the overall modeling framework is presented, as well as the integration of scheme components. This paper covers all concepts expected to be used in building the future MATSimscenario. Figure 63.4 is a partial view of the overall modeling framework being researched at the moment.
63.5
Modeling Network Disruption
As mentioned, this study also suggests modeling network inaccessibility occurring after river floods. This approach assumes that link capacities subjected to river floods are reduced, depending on flood intensity. Given that damage is mainly a function of water depth, the idea is to intersect a steady-state inundation map with the transportation network or, at least, the area impacted by floods (Saadi et al., 2014). Then, an analysis extension will be achieved by including a time series of river floods for a better understanding of dynamic effects: e.g., response to river floods propa-gation, return way and time to the new equilibrium point between transport supply and demand.
Mandatory inputs MATSim 2010 Belgian Daily Mobility 2013 EFT Transportation network .OSM File Simulation Based Population Syhthesis Travel demand .XML File Network .XML File MATSim Network Builder Activity-based generation pattern Mobility simulation Scoring Replanning Statistical and economical analysis
Figure 63.4:Partial modeling framework.
A similar problem was studied in a tsunami evacuation scenario simulation in the city of Padang (L¨ammel et al., 2010) (Chapter 76) and was particularly interesting in terms of network dynamic evolution during the scenario simulation.
63.6
Next Development Steps
When the complete integrated agent-based transportation model is ready, combination with the land-use change CA (Cellular Automaton) based model proposed by Mustafa et al. (2014) will to allow more interactions between those two patterns. This connection will be the basis for an innovative micro-scale LUTI (Land-Use and Transport Interaction)model, allowing more accurate predictions about future river floods influenced by different micro-scale patterns.