HAL Id: hal-01008109
https://hal.archives-ouvertes.fr/hal-01008109
Submitted on 16 Oct 2017HAL is a multi-disciplinary open access
archive for the deposit and dissemination of sci-entific research documents, whether they are pub-lished or not. The documents may come from teaching and research institutions in France or abroad, or from public or private research centers.
L’archive ouverte pluridisciplinaire HAL, est destinée au dépôt et à la diffusion de documents scientifiques de niveau recherche, publiés ou non, émanant des établissements d’enseignement et de recherche français ou étrangers, des laboratoires publics ou privés.
Effects of loading history and size-scale in suffusion
process in granular matter
Didier Marot, Yacine Sail, Luc Sibille
To cite this version:
Didier Marot, Yacine Sail, Luc Sibille. Effects of loading history and size-scale in suffusion process in granular matter. 6th International Conference on Scour and Erosion (ISCE-6), Aug 2012, Paris, France. pp.855-862. �hal-01008109�
granular matter
Didier MAROT
1, Yacine SAIL
1, Luc SIBILLE
11Institut GeM, l'Université Nantes Angers Le Mans LUNAM, CNRS
IUT de Saint-Nazaire, BP 420, 44606 Saint-Nazaire Cedex, France
e-mail : [email protected], [email protected], [email protected]
Under internal water flow, hydraulic earth structures (such as dikes, levees, or dams and their foundations) can incur a migration of the finest particles of their constitutive soil. This migration may be the cause of modifications of hydraulic properties and degradation of mechanical strength of these structures. The study realized by [Marot, 2012] on clayey sand specimens underlines the influence of specimen length on critical hydraulic gradient and also on the rate of erosion. To investigate the effect of the height of cohesionless specimen and the effect of the hydraulic loading history on suffusion process, a series of suffusion tests was performed on assemblies of glass beads. These tests were conducted in a large oedo-permeameter device developed in our laboratory [Sail, 2011]. The specimens were subjected to an axial load and a downward seepage flow with a constant hydraulic gradient, increased in several steps. Two processes of erosion were observed during the tests. First, a suffusion process characterized by a diffuse departure of fine particles is occurring gradually over a long time period. This suffusion process can be accompanied by a local excess of pore pressure preceding a localized blowout developing quickly. Hydraulic shear stress concept and erosion power concept are used to characterize suffusion development. Results reveal that suffusion and localized blowout are two time– dependent processes. Thus an interpretation based on unique or average values of hydraulic loading and induced erosion rate cannot lead to an accurate characterization of the soil erodibility. By the mean of an energy analysis of tests, the suffusion characterization is independent of specimen length and not influenced by the loading history.
Key words
Geotechnical engineering, erosion sensitivity, laboratory experiments, suffusion, energy, cohesionless soils.
I INTRODUCTION
Soil grains constituting embankments, dams or dikes can be detached and transported under the action of water flow. This process, named internal erosion, may induce the failure of hydraulic earth structures. The two main phenomena of internal erosion in uncracked soils are backward erosion and suffusion [Fell, 2007]. This paper deals with suffusion, which concerns only the finer soil fraction. The fine particles are detached and transported through a skeleton constituted by coarser grains.
Soils susceptible to suffusion are usually described by their grain size distribution. They usually correspond to concave upward or gap-graded particle size distributions [Lafleur, 1989; Wan, 2008], with particles from clay or silt to gravel size. According to [Wan, 2008], the most widely used methods based on grain size distribution are methods of Sherard, Kenney & Lau and Burenkova. The comparison of test results with the predictive ability of these methods underlined that they are conservative [Wan, 2008]. Thanks to a comparison between Kenney’s criterion and Kézdi’s criterion, Li and Fannin concluded that both criteria are similar but Kézdi’s method proves to be more successful in the evaluation of gap graded soils [Li, 2008].
Moffat and Fannin [Moffat, 2011] tested four widely graded cohesionless soils and they concluded that material susceptibility to instability induced by seepage is governed by geometric conditions and the onset of instability is influenced by the hydromechanical constraint. With the objective to characterize the hydromechanical influences, [Skempton, 1994] postulated that effective stress applied to the finer particles is only a part of the effective stress applied to coarser fraction and they defined the suffusion initiation by an increase in the velocity of seepage flow. They expressed the difference between classical critical upward
ICSE6 Paris - August 27-31, 2012 Effects of loading history and size-scale in suffusion process in granular matter - Marot D., Sail Y., Sibille L.
hydraulic gradient ic = ’/w (obtained by Terzaghi‘s theory) and the critical hydraulic gradient required to
initiate suffusion, icr, by:
w cr i 1 ' (1)where is the stress reduction factor in the fine fraction (Skempton and Brogan suggested an order of magnitude less than 0.1 for sandy gravel and this value needed to be determined by internal erosion tests); ’ is the submerged unit weight of the soil specimen and w the unit weight of water.
[Reddi, 2000] proposed to represent the porous medium by a system of parallel capillary tubes each of a constant radius r. Assuming that hydraulic loading can be represented by a shear stress, the hydraulic shear stress for a horizontal flow between upstream section A and downstream section B of the system can be expressed by: 2 r L P (2)
where P = PA – PB; L is the distance between A and B; r is the constant radius of horizontal parallel
capillary tube system.
[Marot, 2012] used a specific centrifuge bench to study the suffusion process and to study the influence of the length of the seepage path on the hydraulic gradient concept. It was shown that the magnitude of critical hydraulic gradient decreases with the length of the seepage path. A new analysis was proposed which is based on a fluid energy dissipation model where this energy is assumed to be dissipated through the erosion process. Three assumptions were used: the fluid temperature is assumed constant, the system is considered as adiabatic and a steady state flow is considered. The Reynolds number can be defined by:
µ d U ρ
Re 0
where is the unit mass of water, U the mean velocity in the pore, d0 the average capillary tube diameter of
the coarser fraction defined by Kovacs [Kovacs, 1981], the dynamic viscosity. In the case of the suffusion process, the value of the Reynolds number is relatively low (Re <1.6). Thus it is assumed that energy is mainly dissipated in the erosion process and the dissipation intra fluid can be neglected. Finally, [Marot, 2012] expressed the power dissipated by suffusion process, Perosion by:
wΔz ΔP
Qerosion
P
(3)where z = zA - zB, zA and zB are vertical coordinates of section A and B respectively and Q is the fluid flow
rate.z > 0 if the flow is in downward direction, z < 0 if the flow is upward and the erosion power is equal
to Q P if the flow is horizontal. The energy dissipation Eerosion is the temporal integration of the
instantaneous erosion power for the test duration.
In the case of interface erosion, [Marot, 2011] proposed an erosion resistance index in order to quantify the soil erodibility as:
E
I
erosion mass dry Erodedlog
10 (4)The objective of this study is to test the hydromechanical behavior of a gap graded cohesionless material. Laboratory oedo-permeameter tests were performed on specimens with axial loading and with seepage flow in downward direction. The influences of specimen length and of history of the hydraulic loading are analyzed from the hydraulic shear stress concept and also from the energy approach.
II EROSION DEVICE
A large oedo-permeameter was designed to enable specimen saturation and consolidation in oedometric condition. Afterwards, specimen is subjected to downward seepage flow under hydraulic gradient which is increased by stages.
A brief description of the device is provided bellow and more details are given in [Sail, 2011].
The oedo-permeameter comprises a cylindrical cell made of a rigid transparent acrylic tube. Specimen diameter is 279 mm with an initial length in the range of 250 mm to 600 mm. The specimen support is a 15 mm thick mesh screen with 10 mm pore opening size and different wire meshes can be fixed by a rim on
the mesh screen. A constant vertical effective stress is applied to the top of specimen by a piston connected to a pneumatic cylinder. The piston comprises two perforated plates separated by a 61 mm thick layer of gravel in order to diffuse the injected fluid uniformly at the top of specimen. Displacement of piston is measured using a linear variable differential transformer. Cell wall is equipped with two arrays of six pressure ports. In addition, a pressure port is placed on piston and a fourteenth port on the draining system. All pressure ports are linked to a multiplex unit and connected to a single pressure sensor. Hydraulic system comprises a storage reservoir supplied by public water system and connected to a reservoir equipped with an air pressure controller. The injected flow generated by this reservoir is measured with two electromagnetic flow-meters with complementary capacities. The downstream outlet of cell has a vertical funnel-shaped design and it is connected to a collecting system. This collecting system has an overflow outlet with a 0.08mm mesh in order to catch the extracted fine particles and it is equipped with a rotating sampling system containing several beakers where eroded particles are collected.
III EXPERIMENTAL PROCEDURE
The tested cohesionless material is a mixture of glass beads [Moffat, 2006; Sail, 2011]. This mixture is composed of 40% of fine fraction and 60% of coarse fraction. The grain size distribution of fine fraction is within the range 0.1-0.2 mm and the grain size distribution of coarse fraction is within 1.18-3.55 mm. Gap graded mixture has a coefficient of uniformity Cu = 14, mean diameter D50 = 1.45 mm. The sieve size for
which 15% of the weight of the coarse fraction is finer is D’15 = 1.40 mm and for the fine fraction d’85 = 0.17 mm. Ratio D’15/d’85 = 8.2 exceeds the ratio of 4 advocated by [Kézdi, 1979] in distinction
between stable and unstable gradations. Thus this material can be defined as unstable according to Kézdi's criterion.
With the objective to allow only the migration of fine particles, a wire mesh with a 1.25 mm pore opening size was fixed on wire mesh screen. Test specimens were reconstituted using the method of slurry deposition [Moffat, 2006; Sail, 2011]. Specimens were consolidated with double drainage conditions (dissipation of excess interstitial pressure in upward and downward directions) and under a top effective stress of 25 kPa.
Six tests were performed with different values of initial specimen length and different histories of hydraulic loading. Two repeatability tests were performed (tests N2 and N3). Applied hydraulic gradient was increased by stages until strong localized blowout appeared or the capacity of the device was exceeded. Table 1 summarizes main characteristics of tests: initial specimen length, values of applied multi-stage global hydraulic gradient and test duration of seepage flow before the observation of blowout.
Test
Initial specimen length (mm)
Multi-stage global hydraulic gradient
Time of occurrence of blowout (min) N1 246 1 – 2 – 3 215 N2 449 1 – 2 – 3 – 4 - 5 308 N3 442 1 – 2 – 3 – 4 - 5 281 N4 595 1 – 2 – 3 – 4 - 5 333 N5 246 0.1 0.2 0.4 0.8 – 1 – 2 3 474 N6 237 0.1 - 0.2 - 0.4 - 0.8 – 1 789
Table 1: Main characteristics of tests. Figure 1: Position of interstitial
pore pressure ports.
For 450 mm specimen height, Figure 1 shows positions of pressure ports (numbered H6, L1 to L5 and R1 to R5).
IV TEST RESULTS
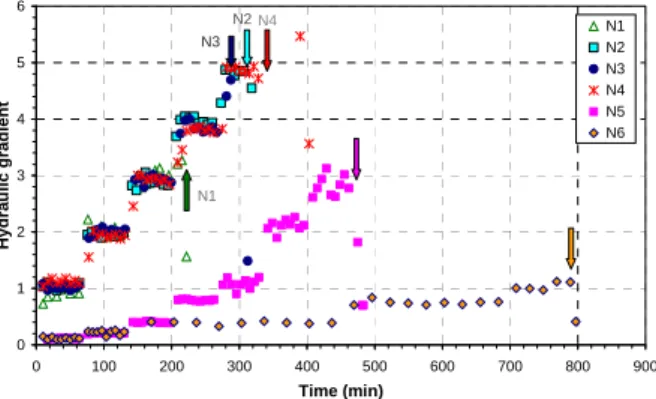
Figure 2 shows the amplitude and duration of each stage of hydraulic gradient for all tests which were performed until a strong localized blowout occurred. The observation of the blowout initiation is represented
ICSE6 Paris - August 27-31, 2012 Effects of loading history and size-scale in suffusion process in granular matter - Marot D., Sail Y., Sibille L. 0 1 2 3 4 5 6 0 100 200 300 400 500 600 700 800 900 Time (min) H ydr a u lic g radien t N1 N2 N3 N4 N5 N6 N4 N2 N3 N1 0 5 10 15 20 25 0 100 200 300 400 500 600 700 800 900 Time (min) Re la tive e roded m a ss (% ) N1 N2 N3 N4 N5 N6 N3 N1
by arrows in Figure 2. This blowout results in the forming of a zone without fine particles, initially observed at the specimen top interface and then progressing in downward direction (see Figure 3) [Sail, 2011]. By comparing tests, it can be noted that values of hydraulic gradient to initiate blowout are within the range of 1.1 to 5. Thus, a unique value of hydraulic gradient doesn’t allow to estimate the initiation of blowout.
Figure 2: Time series of Hydraulic gradient. Figure 3: Downward progression
Arrows show time of localized blowout initiation. of localized blowout
For all tests, initial value of hydraulic conductivity was between 10-4 m/s and 2.10-4 m/s and stayed constant
for the first stages, but when blowout started, hydraulic conductivity sharply increased to exceed 3.10-3 m/s.
Relative eroded mass is the ratio of cumulative mass of eroded fine particles to initial mass of fine particles in specimen. The instantaneous values of relative eroded mass for all tests are plotted in Figure 4. Before the initiation of blowout, relative eroded mass increased slowly to reach 2.5%, 3%, 3.8%, 4.7%, 4.4%, 3.4% for tests N1, N2, N3, N4, N5 and N6 respectively. The occurrence of strong blowout was accompanied by a great increase of relative eroded mass which could increase twofold in a few minutes.
Figure 4: Time series of relative eroded mass. Figure 5: Time series of hydraulic head
Arrows show time of localized blowout initiation. (Test N2, i5 = 4.9).
When the position of onset and development of localized blowout is close to the position of pressure ports, an increase of hydraulic head precedes the blowout initiation. Figure 5 shows the hydraulic head measured during the fifth stage of hydraulic gradient of test N2. At t = 5 min hydraulic head decreased because of the downstream gate opening. At t = 47 min, hydraulic head on pressure port R4 increased of about h = 7 cm
(corresponding to an overpressure of 0.7 kPa). Two minutes later, a similar increase was detected on pressure port R3. These increases of interstitial pressure preceded the onset of localized blowout (at t = 52 min) which developed in downward direction close to the position of pressure ports R5 to R1.
[Sail, 2011] indicated that such interstitial overpressure may be due to a localized filtration of some eroded particles. This filtration may create a clogging which induces a localized interstitial overpressure and finally leads to a localized blowout. Thus the blowout appears as a consequence of the suffusion process.
V DISCUSSION
The objective of this study is to characterize the influence of specimen length and history of hydraulic loading on the suffusion process.
50 70 90 110 130 150 170 190 210 230 250 270 290 310 0 10 20 30 40 50 60 Time (min) H y dr a ul ic he a d( c m ) H6 R5 L5 R4 L4 R3 L3 R2 L2 R1 L1 t = 47 min t = 49 min
V.1 Effect of initial specimen length
Instantaneous value of rate of erosion is expressed by:
t S t t mm
eroded
(5)where ∆meroded(t) is the dry mass of eroded particles collected during duration ∆t of eroded particle sampling
(about 6 min), S is the specimen cross section.
The Reddi’s concept of hydraulic shear stress (equation 2) can be reformulated in the case of a vertical flow by the equation:
2 r z h w
(6)where h is the hydraulic head, and r = d0/2 with d0 the average pore diameter in coarse fraction defined by
[Kovacs, 1981]. It is worth stressing that such approach leads to the same expression of hydraulic shear stress as expression proposed by [Wörman, 1992].
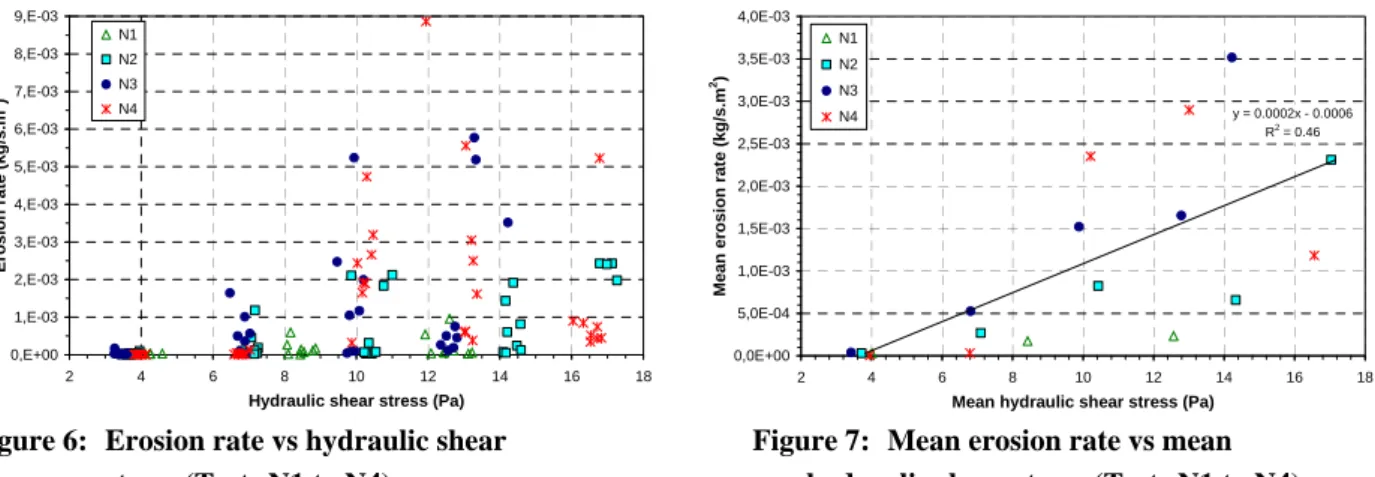
Figure 6 shows erosion rate as a function of hydraulic shear stress for tests N1 to N4 which were characterized by same hydraulic gradient stages but with specimen lengths comprised between 25 cm to 60 cm.
Figure 6: Erosion rate vs hydraulic shear Figure 7: Mean erosion rate vs mean
stress (Tests N1 to N4). hydraulic shear stress (Tests N1 to N4).
As shown in Figure 6, no clear relation appears between erosion rate and hydraulic shear stress, because for a given value of hydraulic shear stress, different values of erosion rate were measured. For hydraulic shear stress lower than 3 Pa, no erosion was measured, thus critical value of hydraulic shear stress for such granular material seems to be about 3 Pa.
For each hydraulic gradient stage of tests N1 to N4, mean value of erosion rate and mean hydraulic shear stress were computed and were plotted in Figure 7. A linear correlation is built but associated with a very low value of correlation coefficient (R2 = 0.46). It can be also noted that by distinguishing the three tested
specimen lengths, no linear correlation can be built clearly.
The dispersion of representation points can be due to an inadequate erosion surface considered in the expression of the erosion rate. In consequence, the erosion surface is now assumed to be the area of average pore in the coarser fraction and the erosion rate per unit pore area is expressed by:
t t tS
N
m
m
p p eroded p
(7) where Sp is the pore area with Sp= d0z; and Np is the number of average pore calculated by:d Np Sn2 0 4 (8)
As shown in Figure 8, the expression of erosion rate per unit pore area allows increasing only very slightly the value of correlation coefficient.
0,E+00 1,E-03 2,E-03 3,E-03 4,E-03 5,E-03 6,E-03 7,E-03 8,E-03 9,E-03 2 4 6 8 10 12 14 16 18 Hydraulic shear stress (Pa)
Er osion rate (kg /s.m 2) N1 N2 N3 N4 0,0E+00 5,0E-04 1,0E-03 1,5E-03 2,0E-03 2,5E-03 3,0E-03 3,5E-03 4,0E-03 2 4 6 8 10 12 14 16 18 Mean hydraulic shear stress (Pa)
Mean erosi o n rat e (kg /s.m 2) N1 N2 N3 N4 y = 0.0002x - 0.0006 R2 = 0.46
ICSE6 Paris - August 27-31, 2012 Effects of loading history and size-scale in suffusion process in granular matter - Marot D., Sail Y., Sibille L. 0,0E+00 2,0E-06 4,0E-06 6,0E-06 8,0E-06 1,0E-05 1,2E-05 2 4 6 8 10 12 14 16 18 Mean hydraulic shear stress (Pa)
Mean er o s io n ra te p e r u n it p o re ar ea (k g/ s. m 2) N1 N2 N3 N4 y = 5E-07x - 2E-06 R2 = 0,49 0,0E+00 5,0E-04 1,0E-03 1,5E-03 2,0E-03 2,5E-03 3,0E-03 3,5E-03 4,0E-03 0 0,2 0,4 0,6 0,8 1 1,2 Mean erosion power (Watt)
Me an er o s io n r a te ( k g/ s .m 2) N1 N2 N3 N4 y = 0,0027x + 0,0001 R2 = 0.52 2 2,5 3 3,5 4 4,5 5 5,5 0 50 100 150 200 250 300 350 400 450 Time (min) E ro s io n re si stan t i n d ex N1 N2 N3 N4 N1 N3 N2 N4
Figure 8: Mean erosion rate per unit pore area vs mean hydraulic shear stress (Tests N1 to N4).
In the case of interface erosion, the gradient of the linear correlation between erosion rate and hydraulic shear stress is named erosion coefficient, kd. It is worth noting that, in the case of suffusion the values of
erosion coefficient would depend on the definition of the considered area. According to the values of erosion rate (cf. Figure 7), kd = 2 10-4 s.m-1, whereas for the erosion rate per unit pore area (cf. Figure 8) kd = 5 10
-7 s.m-1. [Wan, 2004] proposed soil erodibility classification based on k
d coefficient. Thus such approach for
the suffusion process implies to define precisely the considered area.
By using the energy approach proposed by [Marot, 2011, 2012], the erosion power is calculated with equation (3). For each hydraulic gradient stage, the mean of erosion power was computed. Values of mean erosion rate versus mean erosion power are plotted in Figure 9. Although the value of coefficient correlation for the obtained linear correlation is slightly higher than for previous correlations, it is still very low (R2 = 0.52).
Figure 9: Mean erosion rate vs mean Figure 10: Erosion resistance index vs time
erosion power (Tests N1 to N4) Arrows show time of localized blowout initiation.
It is worth stressing that the use of a hydraulic loading model based on shear stress leads to a critical value of hydraulic loading which doesn’t appear by using erosion power approach.
By using hydraulic shear stress concept or erosion power concept, no clear estimation of erosion rate was obtained. This result exhibits the weak ability to estimate suffusion development by such approaches.
The energy dissipated by erosion was computed by integrating the erosion power over the whole test duration, and the erosion resistance index was determined by equation (4). With the objective to characterize the suffusion development, mean value of erosion resistance index was calculated for a 150 min test duration preceding blowout initiation. As shown in Figure 10, corresponding values are 3.9, 3.8, 3.7 and 3.6 for tests N1, N2, N3 and N4 respectively. Accordingly, the development of suffusion in such granular matter is characterized by an erosion resistance index I=3.8 with a relative error of 8% and without any significant
influence of specimen length. In the case of this granular material, the suffusion leads to localized blowout and the time of blowout initiation is represented by arrows in Figure 10. It can be noted that when blowout occurred, the corresponding values of erosion resistance index for tests N1, N2, N3 and N4 were 3.5, 3.8, 3.8 and 3.7 respectively. Thus the maximum relative error for characterization of the granular assembly with respect to blowout occurrence is limited to 8%.
2 2,5 3 3,5 4 4,5 0 100 200 300 400 500 600 700 800 900 Time (min) Er os io n r e s ist a nt in de x N1 N5 N6
V.2 Effect of history of hydraulic loading
The influence of history of hydraulic loading on the suffusion development was investigated by using two different amplitudes and two different durations of hydraulic stages. As shown in Figure 2, the duration of each stage was one hour for both tests N1 and N5. The first value of hydraulic gradient for test N1 was equal to one and thereafter it was increased by increment of one. Seven stages of hydraulic gradient were applied during test N5 (see Table 1) ranging from 0.1 to 3. For both tests N1 and N5, blowout occurred under hydraulic gradient of about 3. Concerning test N6, duration of stages were successively: 1 hour for i=0.1 and
i=0.2, 5 hours for i=0.4, 4 hours for i=0.8 and finally blowout occurred under i=1.1.
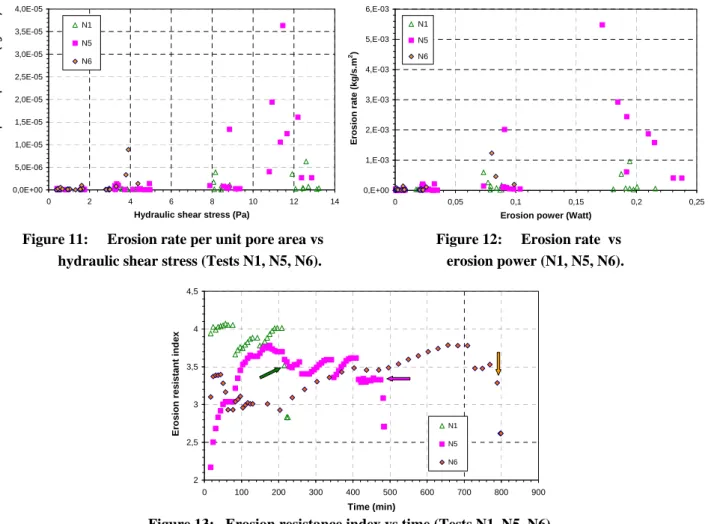
Figure 11 shows erosion rate per unit pore area versus hydraulic shear stress. In Figure 12, values of erosion rate are plotted versus erosion power. The dispersion of representation points in two figures exhibits the necessity to take into account the whole history of hydraulic loading to predict suffusion development.
Figure 11: Erosion rate per unit pore area vs Figure 12: Erosion rate vs
hydraulic shear stress (Tests N1, N5, N6). erosion power (N1, N5, N6).
Figure 13: Erosion resistance index vs time (Tests N1, N5, N6). Arrows show time of localized blowout initiation.
As shown in Figure 13, mean value of erosion resistance index for a 150 min test duration preceding blowout initiation is 3.5 for test N5, 3.7 for test N6 and 3.9 for test N1. Thus the same order of magnitude of erosion resistance index is obtained for the different hydraulic loading histories (relative error 11%). When blowout occurred, the corresponding values of erosion resistance index for tests N1, N5 and N6 were 3.5, 3.3 and 3.3 respectively (relative error 6%).
VI CONCLUSION
Six suffusion tests on gap graded glass bead specimens were performed by using a large oedo-permeameter. The tests reveal that suffusion process can lead to a localized blowout for a hydraulic gradient ranging from 1.1 to 5. Two interpretative methods were used: hydraulic shear stress concept and erosion power concept. The hydraulic shear stress concept needs to define precisely the considered area of erosion and a rate of erosion per unit pore area is proposed. A more efficient approach consists in determining the interstitial fluid power dissipated by erosion, however the rate of suffusion and the time to initiate the
0,0E+00 5,0E-06 1,0E-05 1,5E-05 2,0E-05 2,5E-05 3,0E-05 3,5E-05 4,0E-05 0 2 4 6 8 10 12 14
Hydraulic shear stress (Pa)
Erosion ra te p er u n it p o re a rea (k g /s .m 2) N1 N5 N6 0,E+00 1,E-03 2,E-03 3,E-03 4,E-03 5,E-03 6,E-03 0 0,05 0,1 0,15 0,2 0,25
Erosion power (Watt)
E ro s ion r a te ( k g/s.m 2) N1 N5 N6
ICSE6 Paris - August 27-31, 2012 Effects of loading history and size-scale in suffusion process in granular matter - Marot D., Sail Y., Sibille L.
localized blowout depend on the history of the hydraulic loading. Accordingly, methods to characterize the erosion sensibility which are based on rate of erosion cannot lead to a unique characterization of suffusion process. Moreover such methods didn’t permit to estimate the initiation of localized blowout. The resistance erosion index, based on energy approach leads to a similar soil sensibility characterization for different specimen lengths and different histories of hydraulic loading. These results show that history of gradient of pressure, and flow rate variations with time have to be taken into account to describe the hydraulic loading and to predict suffusion development.
VII ACKNOWLEGMENTS
The authors wish to acknowledge the support of the French National Research Agency (project ANR-ERINOH), the support of the French region Pays de la Loire (project EMERMOD) and the support of the French Institute for Applied Research and Experimentation in Civil Engineering (IREX). The authors wish to express their gratitude to R. Coué, D. Fournol and F. Gervot, Technicians at the University of Nantes, for their assistance in the assembly of the experimental bench.
VIII REFERENCES
Fell R., Fry J.J. (2007). – Internal erosion of dams and their foundations, Editors, Taylor & Francis Publisher.
Kézdi (1979). – Soil physics selected topics. Elsevier Scientific Publishing Co, Amsterdam Kovacs G., (1981). – Seepage hydraulic, Elsevier Scientific Publishing Co, Amsterdam.
Lafleur J., Mlynarek J., Rollin A.L. (1989). – Filtration of broadly graded cohesionless soils. J.
Geotechnical Eng., 115(12):1747-1768.
Li M., Fannin J. (2008). – Comparison of two criteria for internal stability of granular soil. Canadian
Geotechnical J., 45:1303-1309.
Marot D., Regazzoni P.L., Wahl T. (2011). – Energy based method for providing soil surface erodibility rankings. J. Geotechnical & Geoenvironmental Eng., 137(12):1290-1294.
Marot D., Le V.D., Garnier J., Thorel L., Audrain P. (2012). – Study of scale effect in an internal erosion mechanism. European Journal of Environmental and Civil Engineering, 16(1): 1–19.
Moffat R., Fannin R.J. (2006). – A large permeameter for study of internal stability in cohesionless soils.
Geotechnical Testing J., 29(4):1-7.
Moffat R., Fannin R.J. (2011). – A hydromechanical relation governing internal stability of cohesionless soil. Canadian Geotechnical J., 48:413-424.
Reddi L.N., Lee I., Bonala M.V.S. (2000). – Comparison of internal and surface erosion using flow pump test on a sand-kaolinite mixture. Geotechnical Testing J., 23(1):116-122.
Sail Y., Marot D., Sibille L., Alexis A. (2011). – Suffusion tests on cohesionless granular matter. European
J. of Environmental & Civil Eng., 15(5):799-817.
Skempton A.W., Brogan J.M. (1994) – Experiments on piping in sandy gravels, Géotechnique, 44(3):449-460.
Wan C.F, Fell R., (2004). – Investigation of rate of erosion of soils in embankment dams. J. Geotechnical
& Geoenvironmental Eng., 130(4):373-380.
Wan C.F., Fell R. (2008) – Assessing the potential of internal instability and suffusion in embankment dams and their foundations. J. Geotechnical & Geoenvironmental Eng., 134(3):401-407.
Wörman A., Olafsdottir R. (1992) – Erosion in a granular medium interface», J. of Hydraulic Research,