Design of a Re-configurable Test Stand for a Multi Degree of Freedom
Compliant Robot Prototype
by Daniel E. Klenk
Department of Mechanical Engineering in Partial Fulfillment of the Requirements for the Degree of
Bachelor of Science in Mechanical Engineering at the
Massachusetts Institute of Technology June 2009
@ 2009 Daniel E. Klenk. All rights reserved
ARCHIVES
MASSACHUSETTS INSTITUTEOF TECHNOLOGY
SEP 16 2009
LIBRARIES
The author hereby grants to MIT permission to reproduce and to distribute publicly paper and electronic copies of this thesis document in whole or in part in any medium no
known or hereafter created.
Signature of Author:
Department of Mechanical Engineering June 2009
7
A/7
/
Certified by:C-"
Accepted by: '/ Martin L. CulpepperAssociate Professor of Mechanical Engineering Thesis Supervisor
Professor John H. Lienhard V Collins Professor of Mechanical Engineering Chairman, Undergraduate Thesis Committee Submitted to the
Design of a Re-configurable Test Stand for a Multi Degree of Freedom Compliant Robot Prototype
by Daniel E. Klenk
Submitted to the Department of Mechanical Engineering on May 11 th, 2009 in partial fulfillment of the Requirements for the Degree of Bachelor of Science in Mechanical
Engineering
ABSTRACT
A test stand was designed and constructed to compress a compliant robot prototype, while measuring the force applied and the displacement of the prototype's end. The prototype is a five degree of freedom, compliant device, which required the design process to preserve these DOF while measuring the force and displacement. To reduce the restriction on the robot's DOF, the final design utilizes a stepper motor and a counterweighted pulley system to apply a compressive force through a single
monofilament line. The test stand can accommodate prototypes up to 25 cm in length, and can apply a compressive force up to 6.5N with a resolution of ±0.04N. The displacement can be measured accurately to ±0.064cm.
Thesis Supervisor: Martin Culpepper
ACKNOWLEDGEMENTS
I would like to thank Professor Culpepper for his time and energy in advising my
research throughout the year and Maria Telleria for her guidance and assistance in nearly every aspect of my work. With their feedback and knowledge, they have helped me learn a great deal and have helped me further develop my research and engineering abilities.
Table of Contents
Chapter 1: Background ... 6
Chapter 2: Introduction ... ... ... 8
Chapter 3: Component Selection ... 11
3.1 Introduction and test stand functional requirements ... 11
3.2 Actuator selection ... ... 13
3.3 Displacement sensor selection ... 14
3.4 Force sensor selection ... 15
Chapter 4: Final Test Stand Design ... 17
Chapter 5: Operation and Data Acquisition... 20
5.1 Motor operation and testing configurations ... ... 20
5.2 Data acquisition and test stand calibration... ... 22
5.3 Data analysis and measuring friction in the system... ... 22
Chapter 6: Conclusions and future use within Squishbot ... 26
Table of Figures
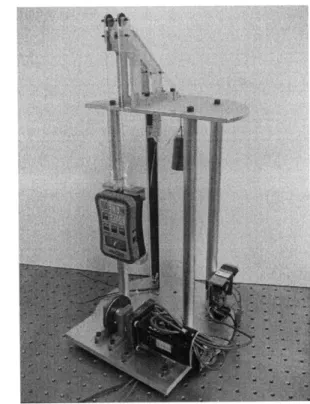
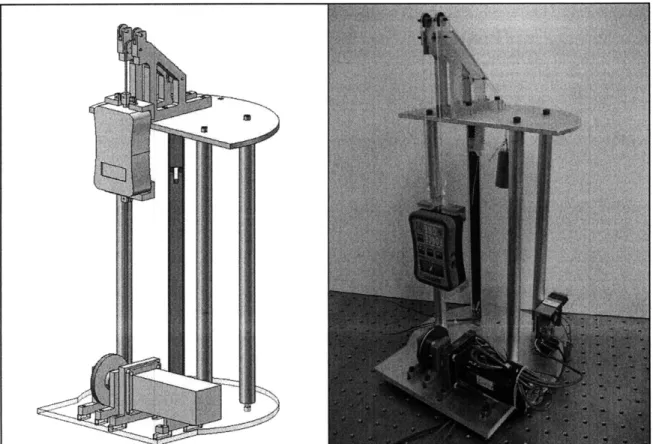
Figure 1. Completed test stand assembly... 6
Figure 2. Current prototype in extended and compressed states ... 9
Figure 3. Endplate diagram showing 5 DOF and applied force ... 12
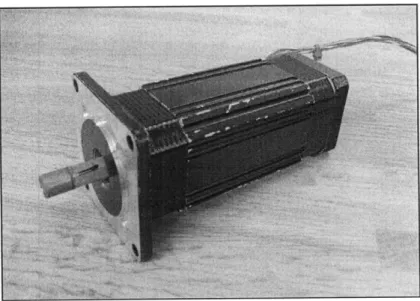
Figure 4. Haydon Switch and Instrument stepper motor used in test stand... 13
Figure 5. Pugh chart for force sensor comparison ... ... 14
Figure 6. Open frame, conductive plastic linear potentiometer... 15
Figure 7. Pugh chart for force sensor comparison ... 15
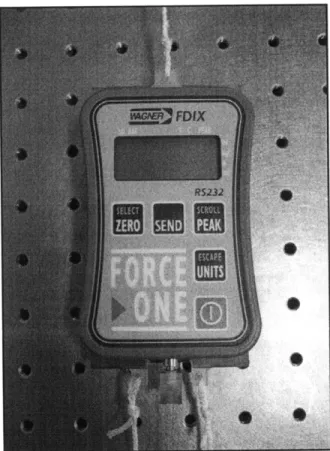
Figure 8. Wagner FDIX force gauge ... 16
Figure 9. Final CAD model and completed test stand ... ... 17
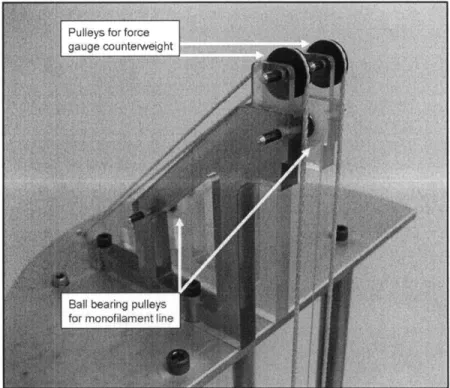
Figure 10. Photo with labels of counterweight system ... 18
Figure 11. Photo of Mounting Brackets... 19
Figure 12. Photo of IM483 stepper motor driver... ... 20
Figure 13. Diagram of representative prototype in position for testing... 21
Figure 14. Setup of friction test #4, with cantilever weights ... 24
Figure 15. Plot from a test to determine friction in potentiometer ... 25
Chapter 1: Background
The purpose of this research was to design a flexible, re-configurable test stand for use in developing the Squishbot robot, a DARPA initiated robotics project seeking to develop a new class of bodied and compliant vehicles. The goal for these
soft-bodied robots is "extreme" mobility, with the ability to climb walls and crawl across ceilings, as well as moving through grass and over dirt. In future use, the test stand shown below will be an important tool for characterizing the stiffness of the Squishbot prototypes. The test stand will be used to verify finite element models of compliant flexures before scaling down the size and manufacturing processes for smaller robot fabrication. The research is also important in that is shows the instrument design process for a high DOF system. This research will impact the Squishbot design throughout the
early phases of design by providing data and practical observations to designers that will influence future iterations of prototypes.
The mobility of the Squishbot will be accomplished through the use of adhesive locomotion, inspired by slugs, snails, and other mollusks. Similar to its biological counterparts, Squishbot will secrete a thin film of fluid between its body and terrain that will create an adhesive contact force, allowing it to cling to walls and ceilings. This locomotion approach requires part of the robot to be in continuous contact with the terrain, and will require cyclical extension and contraction of the skeleton to move the segment of the robot not in contact with the surface. In addition to its general mobility requirements, the Squishbot must also have the ability to move through holes with a smaller diameter than the robots nominal cross section, as shown in the following artist's rendition. This capability will help ensure there are no obstacles or limitations in
Chapter 2: Introduction
The research presented here pertains to the design of a test stand that will be used to validate the finite element models of robot prototypes constructed in the future.
Therefore, this research began by considering the robot's functional requirements in order that the test stand could best measure the properties that represent these requirements. In the chapter that follows, the robots mechanical functional requirements will be presented, which will lead to the motivation for designing the prototype as a compliant device. Additionally, the current prototype design will be reviewed.
The functional requirements for Squishbot were created to ensure that the robot is capable of moving up and over a variety of surfaces, while remaining extremely small to
avoid detection. The functional requirements relating to the robots mechanical design are listed below.
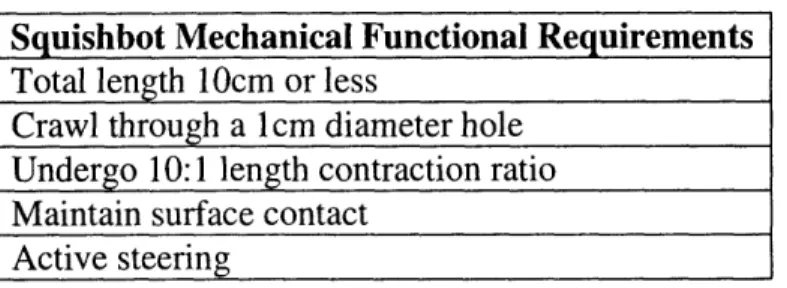
Table 1. Squishbot mechanical design functional requirements
Squishbot Mechanical Functional Requirements
Total length 10cm or less
Crawl through a 1 cm diameter hole Undergo 10:1 length contraction ratio Maintain surface contact
Active steering
To meet these requirements, the Squishbot mechanical design team lead by Professor Culpepper is approaching the design problem using compliant design
principles. Compliant devices have important advantages over rigid systems, and can be engineered to move throughout the range of deflection required in the Squishbot skeleton. A key advantage over rigid systems with multiple parts is manufacturability. As can be seen in the first entry of Table 1, Squishbot will be an extremely small machine.
Compliant devices can be feasibly manufactured on the scale of Squishbot with excellent repeatability, where manual assembly of multi-part mechanisms is not possible.
In addition to satisfying critical manufacturing requirements, a compliant skeleton design will also be capable of meeting the remaining four functional requirements in Table 1. By using "inchworm" locomotion, where separate body segments independently extend and contract, the robot will be capable of crawling through small holes and
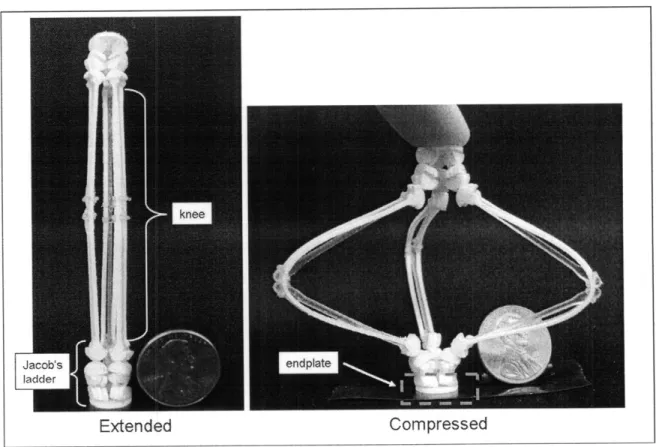
bridging gaps. The current design for a segment or skeleton "joint" utilizes multiple flexures to provide the range of motion necessary for a 10:1 length contraction. This design is shown in Figure 2. The design consists of three legs, with each leg constructed
from a long knee flexure with a Jacob's ladder flexure attached to each end. The knee flexure provides the large displacement travel, while the Jacob's ladder on the ends provides variable angle positioning at the attachment point.
Figure 2. Current prototype in extended and compressed states
Compressed Extended
The inchworm locomotion approach also satisfies the requirement that part of the body remain in contact with the surface to provide an adhesive force when vertical or
inverted. To provide steering, each individual knee flexure can be locked independently. Thus, when the joint actuator begins to compress the joint, any locked knees will cause the joint to deflect laterally to provide steering input. In future design iterations, this locking may also prove useful for vertical and inverted crawling, where locking the proper joints will allow the robot to maintain contact with the surface.
As the design for the joint is developed, it will be important to test the prototypes to verify the static and dynamic models of the assembled flexures. This is an important
step before scaling the prototype down to smaller sizes, where the concept must be proven to avoid wasted costs in precision manufacturing. Additionally, a test stand will
allow designers to develop control and steering schemes by locking various joints and observing the joints behavior.
Chapter 3: Component Selection
3.1 Introduction and test stand functional requirements
The design for the prototype test stand began by reviewing the Squishbot mechanical functional requirements and current prototype design. Next, a set of functional requirements for the test stand was developed that would produce a test stand design that is effective in measuring key properties of the prototypes, while accommodating various geometries of future prototypes. In the following chapter, the functional requirements listed in Table 2 will be explained, followed by the component selection process used.
Table 2. Test stand functional requirements Test Stand Functional Requirements
Minimize restriction on endplate's DOF / Allow individual knees to be locked
Accommodate a prototype up to 254mm in length. Measure displacement ± <1.27mm Measure angular deflection of endplate under a static moment at various displacements Apply up to 10N of compressive force, ±0. 1N
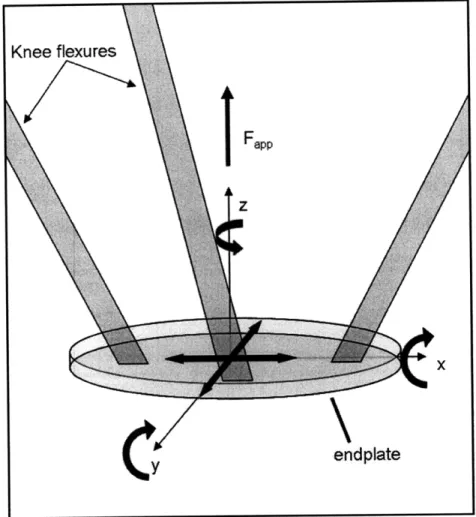
The primary challenge in developing a test stand was the large number of degrees of freedom (DOF) inherent in the joints design. This challenge is represented by the first entry above. The test was required to apply a compressive force to the unfixed end while still allowing that end to rotate on the x and y axes, and move as freely as possible in the x-y plane, as illustrated in Figure 3 below.
(Y. endplate
Figure 3. Endplate diagram showing 5 DOF and applied force
To satisfy this requirement, a single cable or monofilament line attached to the endplate's center was chosen to apply the compressive force. With this design, the angular deflection under an applied moment can still be measured over the full range of
displacements caused by the applied force. In comparison, a fixed attachment used to apply a force would remove all five DOF that are retained using cable actuation. Additionally,
another approach considered was to simply push against the endplate without rigid
attachment. However, this would introduce friction and also unwanted restoring moments during tests using locked joints. These drawbacks would significantly complicate measuring lateral and angular movement. Lastly, for the current prototype, the cable design is the most realistic method for actuating the joint.
Next the configuration of the prototype was considered. A horizontal configuration, where the prototype would lie cantilevered on its side, was eliminated as this would introduce an unwanted variable due to the static moment. Thus, the two possible configurations were to have the prototype stand up or hang down. The hanging configuration was chosen because
it would allow the weight of the prototype, and any weight added for endplate deflection via static moments, to be subtracted from the measured force data, which would otherwise act to preload the prototype in an unwanted manner. Thus the resulting data would be purely due to the stiffness of the prototype.
3.2 Actuator selection
For force application using a cable, the most logical actuator for the test stand was a motor and an associated pulley system. Also, available in lab were three dual-motion actuators made by Haydon Switch Inc. Shown in Figure 4 below, these stepper motors contain two sets of coils, one set for the traditional stepper use, and a second for creating linear motion along the axis of the output shaft. However, this linear motion was not used in the test stand. The motor offered sufficient rotary torque output, 12.7 N-cm at low speeds, and was an obvious cost savings.
3.3 Displacement sensor selection
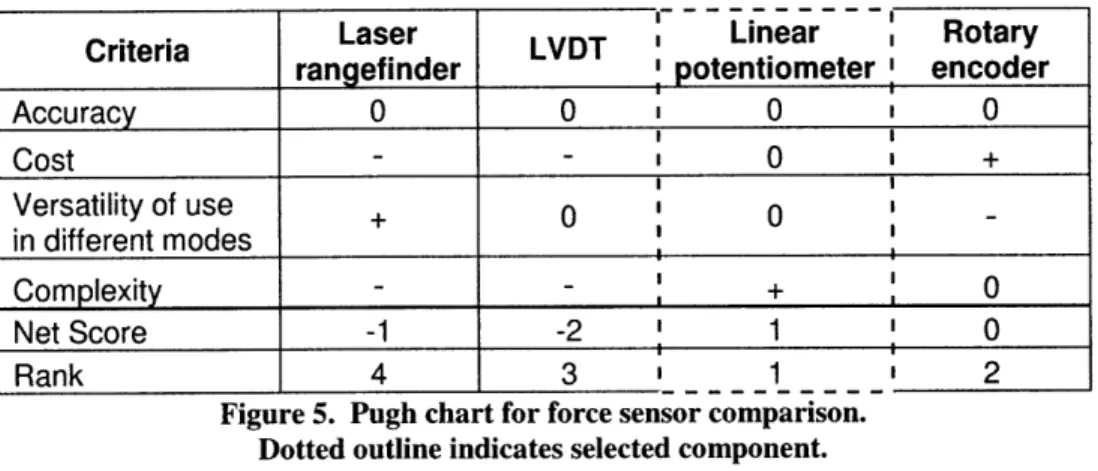
Having chosen the motor and pulley system, the next two components to be selected were the displacement sensor and the force sensor. The displacement sensors considered are listed in the Pugh Chart below.
I---Criteria Laser LVDT ' Linear , Rotary
rangefinder potentiometer' encoder
Accuracy 0 0 0 0 I I Cost - - 0 + I I Versatility of use + 0 0 in different modes + ' Complexity - - + 0 Net Score -1 -2 1 0 Rank 4 3 1 2
Figure 5. Pugh chart for force sensor comparison. Dotted outline indicates selected component.
All the displacement sensors considered provided sufficient accuracy for the
measurement of displacement. Notably, for the LVDT, the accuracy was far beyond what was needed and therefore prohibitively expensive. The cost of a laser rangefinder was
similarly cost-prohibitive, however, this option would have offered the benefit of a
non-contact measurement, thus simplifying the mechanical design as compared to other potential sensors by eliminating any additional mechanical interference to the stiffness measurement. The two primary options were therefore a large travel linear potentiometer and a rotary encoder. While the rotary encoder is less expensive, it has decreased versatility compared to the linear potentiometer when testing joints with one or more of the knee flexures in a locked state; as the joint is compressed, the encoder would not measure the vertical displacement of the endplate, but rather the length of cable spooled. It should be noted that if the angle of the cable relative to the horizontal plane was measured at each point, then the vertical
displacement could still be calculated. However, measuring this angle by hand would introduce additional error and complexity, as it would have to be measured constantly as the angle changes. The linear potentiometer offers very straightforward setup in applications and
is simple to read via an analog to digital converter. The model chosen is shown below in Figure 6, and has a resistance of 10K92 and offers 30 cm of travel.
Figure 6. Open frame, conductive plastic linear potentiometer
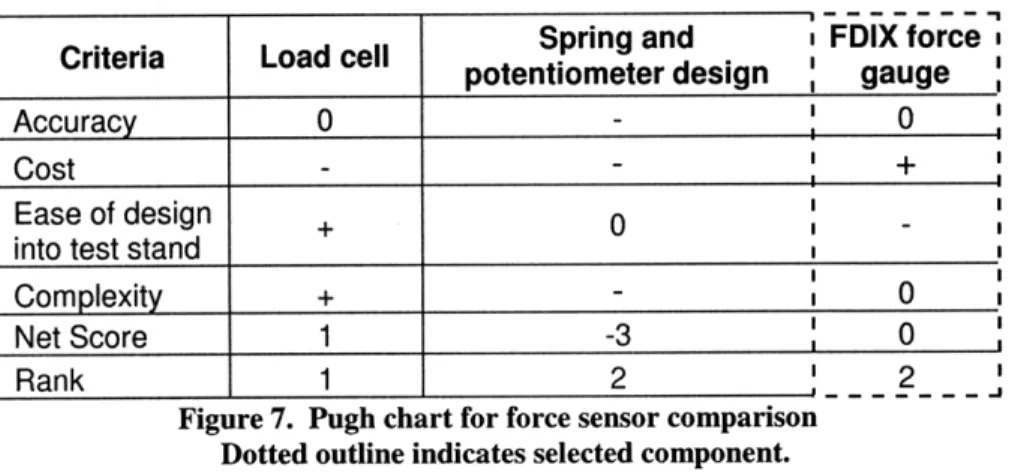
3.4 Force sensor selection
F
Rank I 1 1 2
Criteria Load cell potentiometer designSpring and FDIX forcegauge
Accuracy 0 0
Cost - - +
Ease of design + 0
-into test stand
Complexity + - 0
Net Score 1 -3 0
2
I- - - -. .
Figure 7. Pugh chart for force sensor comparison Dotted outline indicates selected component.
The three possibilities for the force sensor are compared in the Pugh chart above. For the cable and pulley system, any the force sensor selected would be placed in series with the spring-like prototype, in order that the sensor measures the force applied by the motor. A compact load cell was ranked the highest as it was easy to integrate in the design, and it also offered a simple data collection interface. The spring and potentiometer sensor option was a
custom designed sensor consisting of a small linear potentiometer and a spring with a precise, known stiffness. By placing the spring over the shaft of the closed frame linear
potentiometer, a force could be measured between the housing of the potentiometer and the end of the potentiometer shaft. While feasible and appropriately compact, this option was complex and presented an additional cost beyond that of the third option. The FDIX Force gauge, shown below in Figure 8, is a hand held force gauge with an LCD for quick readout
and a serial port for data collection. Although moderately more complex to use because of its size and serial data output, this force gauge was the most attractive option because it
presented zero additional cost. Additionally, as discussed below, a design solution was able to resolve the design integration difficulties.
Chapter 4: Final Test Stand Design
After completing the component selection process, the design process started. The goal of the design process was to integrate the selected parts in a simple design that was both compact, user-friendly, and low cost. The photo of the completed test stand and CAD model below in Figure 9 shows that the stand has ample room for manipulating the
prototype within the four supports, and has sufficient clearance for all string and
monofilament lines. The four supports were positioned to provide clearance for a 254mm prototype as it compresses, such that the legs have space to extend out in the x-y plane without contacting the supports.
All screw holes are slightly oversized to provide allow final alignment before bolting parts in place. Additionally, slots in the base were cut in the water jet to allow the motor and bearing blocks to be aligned with one another, as well as the pulleys on the top deck, during the assembly stage. This ensures that the force gauge remains vertical and balanced, which ensures the data is representative of the compressive force on the prototype.
The upper pulley system consists of two plastic supports that were printed using the lab's 3D printer. The two center pulley's are used to guide the monofilament line that is used to compress the prototype type. The two upper pulleys are used to guide the strings for the force gauge counterweight, which significantly reduces the load of the counterweight on the motor. With this counterweight, the motor only has to overcome the friction in the system and the slight force imbalance, as well as the inertia of the gauge.
The mounting brackets for the force gauge were also 3D printed, and were designed with multiple tie points for the counterweight string, again with the intent of selecting the best mount for balancing during assembly.
Chapter 5: Operation and Data Acquisition 5.1 Motor operation and testing configurations
The stepper motor is driven by an Intelligent Motion Systems IM483 Microstepper motor driver, shown below in Figure 12. The stepper driver drives the motor at 12V with varying step velocity and microstep resolution, as defined by the user. The settings used for the test stand are set to run the motor at low speeds, and the rotor is advanced at 15 Hz for low speed operation. A 5V square wave is used to drive the timing of the phases so that each leading edge of the wave advances the rotor. Appendix A shows a connection diagram for
the IM483's pins.
Figure 12. Photo of IM483 stepper motor driver
The test stand can be used in several different configurations, with the differences arising from the locked or unlocked state of the joints or the need to measure endplate
deflection under a static moment. For testing a prototype with no locked joints, the prototype is placed in the test stand and the motor is switched to apply a compressive force. A sample test setup is shown below in Figure 13.
Linear
potentiometer counterweight
for force gauge
Figure 13. Diagram of representative prototype in position for testing
If one or more of the joints are to be locked, then the prototype's endplate will likely deflect such that it is no longer above the slider arm that is attached to the linear
potentiometer. Therefore, while compressing the prototype using the motor, the user must manually raise a modified slider arm attachment so that it contacts the bottom of the endplate and provides accurate displacement data.
A third configuration also tests the prototype when a static moment attached to the endplate. While the magnitude of the torque will determine if the endplate is deflected away form the slider, it is likely that endplate will not remain in line with the slider arm. Therefore a similar operation as described above will be required, where the user will manually move the modified slider arm attachment while compressing the prototype.
5.2 Data acquisition and test stand calibration
To collect the force data, a serial port widget created by Plexis Software systems is used to save the data from the FDIX force gauge sent via RS232, an output feature on the
force gauge. The sampling rate of the force gauge is set to 50Hz, the lowest possible sample rate that is still at least twice the 15Hz square wave that is used to drive the stepper motor. The maximum force the currently stand can currently apply is 6.55N, however this will be increased by installing a smaller pulley on the motor to increase the torque applied.
A LabView analog to digital converter is used to sample the potentiometer voltage, which has 5V applied to the input terminal. The ADC samples the potentiometer at 50Hz to match the sampling rate of the force gauge. When collecting data, the force gauge's
data-send button and the LabView model are initiated at the same time to synchronize the data from the two sensors. Although sampling at twice the motor frequency is necessary for
anti-aliasing, lower sampling rates were shown to produce identical data, likely due to the damping in the system.
5.3 Data analysis and measuring friction in the system
The potentiometer voltage measurements taken by the LabView data acquisition board are used to calculate the displacement during tests. To calculate the displacement of the slider arm, Equation 1 is used, as shown below.
Equation 1. displacement = -Ko, * (Vo -Vn)
where Vo is the voltage of the potentiometer at the starting point, V, is the voltage at the current potentiometer position, and Kpot is the potentiometer constant. Kpo, is defined as the electrical travel of the potentiometer with units of cm, divided by the terminal voltage applied at the potentiometer's input. For the potentiometer used, Kpo, = 30cm/5V = 6cm/V. The negative sign in the equation above is used for convention: as the prototype is compressed,
the displacement is positively increasing. The uncertainty in the displacement is ±0.025in, and is dominated by the power supply supplying 5V to the potentiometer, which has a resolution of .00 V.
After finalizing the data acquisition system, the friction in the potentiometer was determined through extensive testing. This is important as the friction in the potentiometer must be subtracted from the total force applied in order to calculate the force of compression on the prototype. Additionally, the uncertainty in this friction was required to determine the overall uncertainty in the force measurements. The testing consisted of four experiments to
study the characteristics of the friction. These tests are summarized in Table 3. A photo of Test #4 is also shown in Figure 14.
Table 3. Summary of friction tests
Test Description Test purpose
1. Lift the preload test weight from standstill Measure the combined magnitude of: 1. force required to accelerate preload mass 2. static friction
2. Capture force data while slider arm is Measure kinetic friction of ball bearing already in motion pulleys for monofilament line
3. Lift slider arm throughout full Measure static and kinetic friction of slider displacement without cantilever weights arm
4. Lift slider arm throughout full Measure static and kinetic friction of slider displacement with cantilever weights (7g on arm to determine if cantilever weights cantilever) decrease friction due to favorable force
Figure 14. Setup of friction test #4, with cantilever weights
Before each test, the force gauge was zeroed to remove the preload weight from the force measurement. This preload weight is required to properly tension the monofilament line to yield consistent friction measurements, and also helps keep the filament aligned in the
pulley grooves. Tests 1 and 2 showed that there is no measureable force when accelerating the preload weight from standstill and that there is no measureable kinetic friction in the ball bearing pulleys.
Tests 3 and 4 were used to determine the average value of the friction in the
potentiometer. Multiple runs yielded an average value of 0.24N for the friction in the slider arm, with an uncertainty of ±0.04N. Data from an example test is shown in Figure 15 below. Thus, the uncertainty in the force measurement is dominated by the friction as uncertainty of the force gauge itself is much smaller. Additionally, in comparing Tests 3 and 4, there was no significant difference when using cantilever weights, and in future tests they will not be used.
Friction test: Force applied vs. slider arm displacement
Figure 15. Plot from a test to determine friction in potentiometer
Once the friction in the potentiometer was determined, this value can be subtracted from the force data collected during prototype tests to provide the final force data required to compress the prototype. An example plot of a prototype test is shown below in Figure 16. This particular prototype did not have a flat endplate, and consisted of a rubber-like bellow
shape. The drop after the force peak is due to the bellow rolling off to the side of the slider arm.
Prototype test: force vs. displacement 4.5 4 3.5 3 2 0 1.5 0.5 0 0.00 1.00 2.00 3.00 4.00 5.00 6.00 displacement (cm)
Figure 16. Force vs. displacement data for a prototype
0.3 0.25 0.2 Z 0.15 0o 0.05 0 0 -0.05 .)0 2.00 4.00 6.00 8.00 10.00 12.00 14.00 16.00 18.00 20i( .....................---_ .................................. ......... ... ........ ..... ........ .. Displacement (cm) 00 1
Chapter 6: Conclusions and future use within Squishbot
The design research presented details the development of a re-configurable test, and shows how the design process fulfilled its purpose to create an instrument that characterizes prototype stiffness. The different configurations for the slider arm
attachment allow the test stand to measure the force and displacement for all possible test setups of a prototype. The normal slider arm is used for unlocked joint tests, and the plate attachment is used for joint locking or moment-deflection tests. The restriction on the robot's endplate is reduced using the single monofilament line to apply the
compressive force. This requirement was critical because of the compliant nature of the Squishbot prototypes, which creates the need to collect data and observe the behavior with one or more locked joints.
The importance of this work will be realized once the next prototypes are ready to be tested. Additionally, the research may serve as a guide in developing future test stands for compliant devices as some of the challenges and methods studied here are likely to
apply to other systems. Within Squishbot, the test stand may also be used to study compliant, wax-impregnated foams that are being considered for use on the Squishbot project.
The research and test stand will have important impacts on the design of the Squishbot prototypes. From the data and observations gathered, the Squishbot designers will be able to study the validity of CAD FEA models and make necessary modifications in the analyses setup parameters or the prototype design itself. The test stand will help the designers to refine to the models to produce appropriate accuracy, and after which plans for scaling down the prototype's size can be prepared. These models need to be
validated before investing in small scale manufacturing processes, where process design and implementation will require significant time, energy, and money.
Cost was reduced by utilizing an existing stepper motor, stepper motor driver, and force gauge already available in lab. The only additional sensor required was the linear potentiometer, which is easy to use and setup, while offering highly accurate and precise data. Other costs included metal stock and small parts orders, which were also reduced by using parts available in lab. None of the functional requirements were ignored while minimizing the cost, and the final design meets all of the functional requirements.
Appendix A
Appendix A contains a diagram of the electrical connections required for operating the test stand's stepper motor driver.
1/C-Step ( - :2" r n9up1-Pt: 5' Reset-P:5 Fa,. ,k -P :.7 OnFd&wDnA i-~ P 1 - Mfr U
-Currem ue&6 Adw