HAL Id: dumas-00758839
https://dumas.ccsd.cnrs.fr/dumas-00758839
Submitted on 29 Nov 2012HAL is a multi-disciplinary open access archive for the deposit and dissemination of sci-entific research documents, whether they are pub-lished or not. The documents may come from teaching and research institutions in France or abroad, or from public or private research centers.
L’archive ouverte pluridisciplinaire HAL, est destinée au dépôt et à la diffusion de documents scientifiques de niveau recherche, publiés ou non, émanant des établissements d’enseignement et de recherche français ou étrangers, des laboratoires publics ou privés.
Cost-benefit analysis of the greenhouse gases mitigation
options in livestock Case study: anaerobic digesters in
pig and dairy farms in the USA and Vietnam
Cindy Schoumacher
To cite this version:
Cindy Schoumacher. Cost-benefit analysis of the greenhouse gases mitigation options in livestock Case study: anaerobic digesters in pig and dairy farms in the USA and Vietnam. Sciences agricoles. 2012. �dumas-00758839�
Master’s thesis
College year : 2011-2012
Major : Politiques et Marchés de l’Agriculture et des Ressources (POMAR)
By Cindy SCHOUMACHER
Before the board of examiners: Philippe Le Goffe Defended at Rennes (FRANCE) Pierre Aurousseau
Defended on September 11th, 2012
Under the presidency of: Philippe Le Goffe Supervisor: Benjamin HENDERSON Supervising teacher: Philippe LE GOFFE
Agrocampus Ouest
65 rue de Saint Brieuc 35042 Rennes Cedex Tel.: +33 (0)2 23 48 50 00 CS 84215
Food and Agriculture Organization of the United Nations
Viale delle Terme di Caracalla 00153 Rome, Italy
Tel.: +39 0657051
Engineer degree from the High Education College of Agricultural, Agri-food, Horticultural and Landscape Sciences
Cost-benefit analysis of the greenhouse gases mitigation options in livestock Case study: anaerobic digesters in pig and dairy farms in the USA and Vietnam
“The analysis and the conclusions of this student work involve only the responsibility of its author and not the one of Agrocampus Ouest”
To fill by the teacher responsible for the major Last version Or by his representative
Table of contents
List of figures ... i List of tables ... ii Acknowledgments ...iii Acronym ... iv Introduction ... 1 I. Literature review ... 2A. The greenhouse gases (GHGs) in livestock ... 2
a. Background ... 2
b. Livestock GHGs emission trends ... 6
c. Legislation for GHGs emissions ... 7
B. Mitigation options ... 8
a. Interaction between mitigation options and GHGs emissions ... 8
b. Choice of the studied technologies to reduce manure GHGs ... 14
c. Anaerobic digestion ... 15
C. Costs of anaerobic digesters and technical and economic feasibility assessment ... 18
a. Costs and cost-effectiveness ... 18
b. Technical and economic feasibility assessment ... 21
D. MAC curves’ usefulness: information given by these curves ... 21
II. Methodology and results ... 22
A. Model constructed for this study ... 22
a. The baselines ... 23
b. Evaluation of the mitigation options ... 23
c. Building the MAC curves ... 27
d. Assumptions ... 27
B. Geographical scope and technologies considered in the study ... 29
b. Example among the developed countries ... 31
C. Data research and results ... 33
a. Data used in this study ... 33
b. Data sources and application of the model ... 33
D. Sensitivity analysis and more details about the model done in this study ... 42
a. Distribution of the digester: the 1/n assumption ... 43
b. The discount rate... 52
c. Sensitivity analyze of the break-even price P ... 54
d. Distinction between small and large farms in the USA ... 55
e. Progressive adoption rate ... 56
III. Discussion... 57
A. Focusing on manure ... 57
B. Suitability of the data found ... 57
C. Next steps ... 59
Conclusion ... 60
Bibliography ... 61 Appendix I: GHGs origins ...I Appendix II: GHGs emissions calculation... II Appendix III: Annex B of the Kyoto Protocol ... III Appendix IV: Comparison of the GHGs mitigation potential between 3 options in Thailand over time ... IV Appendix V: Anaerobic digestion mechanism ... V Appendix VI: Components of an anaerobic digestion system ... VI Appendix VII: AgSTAR ... VII Appendix VIII: Results of the cost study ... VIII Appendix IX: MAC curves examples ... IX Appendix X: Annuity factor and break-even price ... X
Appendix XI: Description of the Vietnamese digesters ... XI Appendix XII: Details about the digesters in the USA ... XV Appendix XIII: Consequences of the change of the capital cost (with the inflation rate) in the USA (above) and Vietnam (below) ... XVIII Appendix XIV: USEPA (2006) results for the USA and Vietnam before tax ... XIX Appendix XV: Cost-benefit analysis for a covered lagoon in a 940 pig farm (Payback method) .... XXI Appendix XVI: Inventory and digesters distribution in the USA ... XXII Appendix XVII: Climate zones in the USA and the digesters distribution ... XXV Appendix XVIII: Methodology used for the geographic distribution study ... XXVI Appendix XIX: Vietnamese regions and comparison of 3 regions... XXVIII Appendix XX: Picture of a failed lagoon ... XXIX Appendix XXI: Comparison of the MAC curves under 2 implied adoption rate assumptions in
Vietnam ... XXX Appendix XXII: Financial analysis for Vietnamese digesters ... XXXI Appendix XXIII: Effect of the change in the discount rate in Vietnam (10% above, 13% below) ... XXXII Appendix XXIV: Methodology for the MAC curves building while taking into account a progressive adoption rate (5 or 10%) and extract of the break-even price calculation (10% rate) ... XXXIII Appendix XXV: AgSTAR assumption test (500 cows, 2000 pigs) ... XXXV
i
List of figures
Figure 1: Nitrification/denitrification process ... 3
Figure 2: Benefits of the anaerobic digestion. ... 17
Figure 3: Methods to assess the economic feasibility of a project ... 21
Figure 4: Abatement potential calculation ... 23
Figure 5: Regional emission reduction potential ... 24
Figure 6: Profit equation ... 24
Figure 7: Electricity revenue-savings calculation ... 25
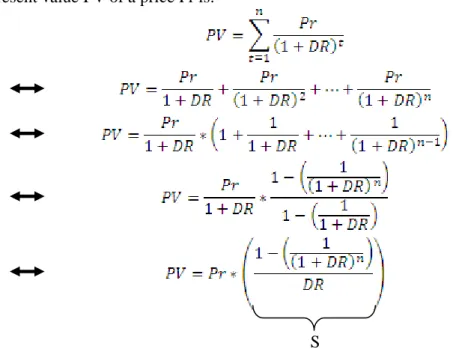
Figure 8: Break-even price with annual parameters and before tax... 26
Figure 9: Explanation of the annuity factor calculation ... 26
Figure 10: Break-even price after tax ... 26
Figure 11: Cost share for the Vietnamese technologies ... 31
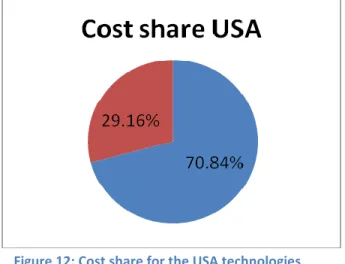
Figure 12: Cost share for the USA technologies... 32
Figure 13: Results of this study for the USA ... 36
Figure 14: Comparison MAC curves before tax with the abatement potential relative to the total baseline (blue) and relative to the manure CH4 baseline (orange) in the USA ... 37
Figure 15: Results of this study for Vietnam ... 38
Figure 16: Comparison MAC curves from this study before tax with the abatement potential relative to the total baseline (blue) and relative to the manure CH4 baseline (orange) in Vietnam ... 38
Figure 17: Results of this study after tax USA (left) – Vietnam (right) ... 39
Figure 18: Individual and total abatement potential ... 41
Figure 19: Individual and total abatement potential ... 42
Figure 20: Share of each kind of digester in the US farms ... 43
Figure 21: Share of each kind of digester in the Vietnamese farms ... 44
Figure 22: Comparison observed share- 1/n distribution for each technology in the USA ... 45
Figure 23: Comparison observed share- 1/n distribution for each technology in Vietnam ... 46
ii
Figure 25: Present value ... 52
Figure 26: Effect of the discount rate change in the USA (model left, change discount rate right) .... 53
Figure 27: Cost-effectiveness of the digesters in the little (left) and large (right) dairy farms ... 55
Figure 28: Effect of the application rate in the USA (left) and Vietnam (right) ... 56
List of tables
Table 1: Enteric emissions mitigation options ... 9Table 2: Manure emissions mitigation options ... 10
Table 3: The biogas recovery systems (or anaerobic digesters) ... 16
Table 4: List of the USEPA (2006) assumptions tested in this study ... 29
Table 5: List of the data requested in the model ... 33
Table 6: Dairy digester spread among states ... 48
Table 7: Swine digesters spread in the USA ... 48
Table 8: Geographic share of the digesters in the USA ... 49
iii
Acknowledgments
I would like to thank my supervisor, Benjamin Henderson, for his time, patience and help for this project. Thank you for having giving me the possibility to work on a great subject that combines economics and environment, and the opportunity to discover the “FAO world”. I also wanted to thank Pierre Gerber for having accepted my internship request, Daniel Pambudi for his help about some economic problems, Carolyn Opio and Michael Macleod for their help and data communication.
Thank you also to Robert Beach, Senior Research Economist at RTI international, for his answers to the many questions I had about the model he contributed to build. A huge thank you to Angela McEliece, environmental consultant at RCM international who had the patience and took the time to give me many cost estimates for some digesters in the USA. Thank you also to Felipe R. Montes, from Penn State University, William Lazarus, Professor and Extension Economist at the University of Minnesota, Curt Gooch, Dairy Environmental Systems and Sustainability Engineer at Cornell University, Jennifer Lynn Pronto, Research support specialist at Cornell University, Allan Stocks, Director of the Environmental Programs at the National Pork Board, Doug Young, Spruce Haven Farm and Research Center, and Jerry Bingold, Director Renewable Energy at the Dairy Management Inc. Innovation Center for U.S. Dairy, for their help during my data research in the USA.
I wanted also to thank Louis Bockel from FAO, Tina Amusa from the Asian Development Bank, Pham Van Thanh, director of the Center for Community Health Research and Development in Vietnam, Nguyen Vo Chau Ngan, lecturer at the Department of Environmental Engineering at the College of Environment and Natural Resources in Cantho University in Vietnam, and Matthew Carr, advisor Renewable Energy at SNV Vietnam, for their huge help during my data research in Vietnam. Without them, the Vietnam part of this study would not have been possible.
And finally, thank you to Philippe Le Goffe, my supervising teacher for his follow up for this internship.
iv
Acronym
ASEAN: Association of Southeast Asian Nations BSE: Bovine Spongiform Encephalopathy CDM: Clean Development Mechanism COD: Chemical Oxygen Demand EU: European Union
FAO: Food and Agriculture Organization of the United Nations GDP: Gross Domestic Product
GHG: Greenhouse gas
GWP: Global Warming Potential HDPE: High Density Polyethylene
IPCC: Intergovernmental Panel on Climate Change IRT: Investment Return Time
KES: Kenyan Shilling kWh: Kilowatt hour lb: Pound
MAC: Mitigation Abatement Cost
MICCA: Mitigation of Climate Change in Agriculture
MtCO2eq: Metric ton CO2 equivalent = ton CO2 equivalent (tCO2eq)
MMtCO2eq: Million metric ton CO2 equivalent = 10^6MtCO2eq
MWh: Megawatt hour
NASS: National Agricultural Statistic Service NRCS: Natural Resources Conservation Service OM: Organic Matter
Ppbv: part per billion by volume PTD: Plastic Tube Digester UK: United Kingdom
UNECE: United Nations Economic Commission for Europe
UNFCCC: United Nations Framework Convention on Climate Change USDA: United States Department of Agriculture
USEPA: United States Environmental Protection Agency USA: United States of America
1
Introduction
Since a couple of years, thanks to the creation of the United Nations Framework Convention on Climate Change and the Kyoto Protocol, concerns have been developed about the need to reduce the greenhouse gases emissions, whose amount increased, to fight against climate change. These gases have many sources but the role of agriculture is especially significant as is the potential to reduce its CO2 and non-CO2 (such as CH4 and N2O) emissions. Indeed,63% of the world’s anthropogenic
non-CO2 emissions (84% of the N2O and 52% of the CH4 generated) [USEPA a, 2006] and 10-12% of all
GHGs anthropogenic emissions [IPCC, 2007] were generated by agricultural activities in 2005, and as the population continues to increase, we expect that the contribution of agriculture to climate change will not decrease unless measures be taken. Livestock contributes to 39% of the world’s non-CO2 greenhouse gas (GHG) emissions (2005), whose 7% from manure [IPCC, 2007]. Animal and
their excreta are the principal agricultural methane source and most of the N2O comes from the field
and animal house. Thus, within agriculture, livestock is one important source of GHGs. Many international organizations, programs, researchers, politicians tried to find the best mitigation options from agriculture. It is also the case for FAO, which is actively working on the livestock sector to find solutions to decrease the impact of agriculture on the environment and especially on climate change. More specifically, the Mitigation of Climate Change in Agriculture (MICCA) Program has been created in 2010. This program, funded by Germany, Finland and Norway, tries to improve the livelihood of small farmers in developing countries, while proposing solutions to these farmers to decrease the GHGs emissions. The aims are also to estimate the GHG emission sources in agriculture and the mitigation potential of different management practices within farming systems, their economic implications and the factors the policymakers have to take into account while building new policies about climate change. One of the most effective mitigation options from manure is the use of anaerobic digesters in hog and dairy farms. This technology can capture methane and convert it in biogas, which can be used to generate heat and electricity. Thus, the GHGs emissions can be reduced directly and indirectly by decreasing the amount of fossil fuel used to generate the electricity.
There are many types of anaerobic digester technologies. They also differ between developed and developing countries. In this study, we firstly explore what could be the GHGs abatement potential of these technologies, and secondly which technology could be the most cost-effective in the USA and Vietnam. Marginal Abatement Cost (MAC) curves are built to answer to these questions, and according to the sensitivity of the model to some parameters, we can analyze what could be the key factors policymakers have to take into account in future climate change policies. Then, the effectiveness of a model applied at a country level can be tested, the same way the effectiveness of a global model can be tested at the international level. This study can thus support the FAO MICCA project.
We begin with a literature of GHGs and their mitigation options in a global scale to explain the current state of the greenhouse gases emissions and why we chose to focus on manure emissions and anaerobic digesters. Then, an economic model will be built to construct MAC curves about the anaerobic digesters in the USA and Vietnam, according to the available data in 2010, and test some assumptions including those used by USEPA (2006) in a similar study. The results will be finally discussed to point out some limitations of the analysis and future improvements.
2
I. Literature review
A. The greenhouse gases (GHGs) in livestock
a. Background
GHGs have many sources (energy, industry, agriculture, waste, see Appendix I). In 2005, 5 developing regions, including South and East Asia, Latin America and Caribbean, Sub-Saharan Africa, were responsible for the ¾ of the total agricultural emissions [IPCC, 2007]. Agricultural GHGs will increase over the next 20 years especially in Asia (particularly from livestock), Africa (which have the highest emission growth) and Latin America (because of the high exportation and deforestation). Because of population growth, more products are demanded, the diet is changing (more meat (5% increase until 1997, probably 57% in 2020 especially in South Asia and Africa [IPCC, 2007]) and dairy products), and the technologies, the public policies, the prices and costs are changing too. Developing countries emit more GHGs than developed countries, but methane emissions from manure were higher in developed countries up to 2005 [USEPA b, 2006]. West Europe is supposed to be the only region where the GHGs emissions should decrease in 2020, thanks to the climate and environmental policies and the economic constraints on agriculture [IPCC, 2007]. Compared with the 2000 level, the four main non-CO2 emission sources which are agricultural N2O,
enteric livestock CH4, manure CH4 and N2O, and rice CH4 could increase by 37%, 30%, 24% and
22% until 2020, respectively [USEPA a, 2006]. Ruminants are the main livestock CH4 producers
because of their special digestive system.
Housed animals can produce slurry (feces, urine, feed residues, bedding material, and water [Van der Meer, 2008]) and manure, in other words liquid manure and solid manure, which can give nutrients to plants, but also generate GHGs. These gases include nitrous oxide (N2O), methane
(CH4), ammonia (NH3, which is a precursor to N2O), which are much more effective than CO2 at
trapping heat because they have a higher global warming potential (GWP1). Their amount can be measured thanks to several techniques (see Appendix II). Most of these GHGs emitted from manure are CH4 emissions which come from swine and dairy cattle, because their manure is typically
managed in liquid under anaerobic conditions. The other species emit less because they are either on pasture (non-dairy ruminants) or housed with dry litter systems (poultry) with solid manure deposited in aerobic conditions [USEPA a, 2006, Rigolot et al., 2010]. This statement may be opened to debate because other studies indicate that liquid manure emits twice less GHGs than solid manure, because of the high levels of N2O emitted from this latter. As manure is an important source of GHGs and
because many benefits can be obtained from this mitigation (see B.a. and B.c.), it is the focus of this study.
1
The GWP enables us to compare the ability of the GHG to trap the heat in the atmosphere. CO2 is the
reference and the calculation of this GWP is based on 100 years. Thus CH4’s GWP is 23 and N2O’s GWP is 296.
With this “unit”, we can convert the non-CO2 emissions into CO2 equivalent units. Here we will only present the
3
i. Nitrous oxide (N2O)
This gas can remain for about 114 years in the atmosphere (CO2 has a lifetime of 100 years) and
has a heat trapping effect 296 times higher than CO2 (100 years of time horizon) [IPCC b, 2001].
Thus, it has an important impact on global warming and on the ozone depletion in the stratosphere (conversion of N2O in NO). N2O can be produced naturally (about 60% of the N2O emissions on a
global basis [IPCC a, 2001]), especially from biological sources in soil and water, and by humans through agricultural soil and livestock waste management (65% of the anthropogenic N2O [FAO,
2006], but Kroeze (1998) explained that the contribution of N2O from the animals is not really
known and could be negligible at national scale [Monteny et al., 2001] because of the anaerobic character of slurry that prevents nitrification), mobile and stationary fossil fuel combustion, adipic and nitric acid production (main manmade sources in the USA). Once in the atmosphere it can be removed by photolysis in the stratosphere. The atmospheric concentration of N2O increased by 16%
between 1750 and 1998 (314 ppbv). Nowadays the increase rate is 0.25% per year. [USEPA a, 2006] N2O is produced by nitrification (aerobic)/denitrification (anaerobic, no oxygen) from soil after
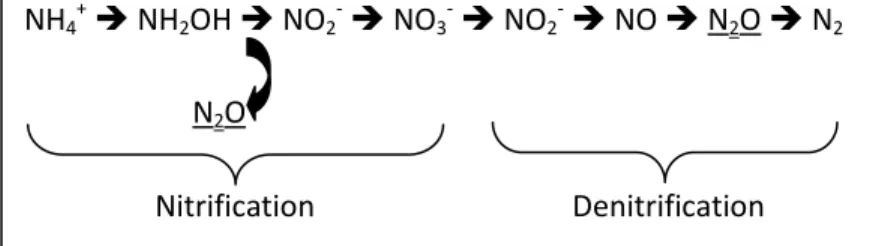
manure spreading, livestock bedding, solid manure stores, and stored slurry (figure 1).
Figure 1: Nitrification/denitrification process
The ammonification of urea from urine creates ammonium NH4+, which will be subject to
aerobic conditions. So, nitrification occurs and produces nitrate (NO3-) for denitrification. A delay
can be observed between manure application and N2O emission because of
mineralization/nitrification and the sufficient NO3- creation. The emission factor (between 0.1 and
3% [Chadwick et al., 2011]) depends on the soil type and conditions, the manure composition, the measurement period, the type of bacteria involved in the process, and the amount of oxygen and liquid in the manure system. Immediate N2O emissions following manure application can occur
because of a source of NO3- within the manure, or the denitrification of residual soil NO3-. But, no
N2O will be produced in the short and medium term from the organic form. Within 48 hours, a large
amount of N volatilizes as NH3 after manure spreading, which decreases the quantity available for
N2O production. So the readily available N drives N2O emissions.
The key management decisions that have an impact on N2O emissions after spreading are:
- Manure type: dairy slurry leads to higher emissions than pig slurry (not the same C content and presence of fine solids in the dairy slurry blocking soil pores which creates anaerobic conditions).
- Soil type: a clay soil after manure application leads to higher emissions (different water capacity, organic matter (OM) content and cation exchange capacity) [Chadwick et al., 2011]. The source of N2O in this soil is denitrification, while the one in a sandy loam soil is
nitrification [Rochette et al., 2008]
NH4+ NH2OH NO2- NO3- NO2- NO N2O N2
N2O
4
- Timing of manure application (temperature, soil water): After autumn/winter slurry application, a higher quantity of N lost as NO3- can be found because slurry applied to
actively growing crops during spring creates a bigger N sink. If water content of the surface layer reduces, then N2O emissions will increase. [Chadwick et al., 2011]
- Manure application rate: optimizing the rate, timing and technique of manure application could reduce losses of direct (higher rates lead to more N2O losses) and indirect N2O (via O2
depletion of the soil, which increases denitrification). [Van der Meer, 2008]
- Application method: broadcasting across the surface or slurries injected into the soil. Shallow injections (reduce the contact with the air) can reduce 73% and 23% of the NH3 emissions
when applied to grassland and arable land respectively, but increase N2O emissions
[Misselbrook et al., 2002]. If the conditions are not good enough for denitrification, injection can reduce NH3 emissions without increasing N2O one. [Chadwick et al., 2011]
- Slurry treatment: soils treated with digested slurries could lead to lower emissions than from untreated slurries, but it depends on soil properties (for example the redox potential) and on application conditions [Chadwick et al., 2011].
Moreover, studies mentioned by Chadwick et al. in 2011 show that the absence of bedding or the presence of hard standing areas enable slurry to stay in anaerobic state which prevents nitrification and so no or little N2O emissions will occur. Higher emissions will occur from deep litter systems
with fattening pigs. Slurry stores create anaerobic conditions. Thus, N2O production from slurry
manure with no surface cover is negligible (no nitrification). Some materials used to cover liquid manure stores to prevent ammonia emissions enhance crust formation (aerobic conditions), which leads to an increase in N2O emissions.
Finally, solid manure stores provide aerobic and anaerobic conditions. They are a source of N2O
production, consumption and emission (which release usually between less than 1% and 4.3% of the total N). Thorman et al. in 2006 showed that between 0.2 and 0.8% of total heap N is lost as N2O
from stored poultry manure and covering these heaps reduces NH3 emissions but has no effect on
N2O. However, covering the heaps and compacting the manure create anaerobic conditions that can
reduce N2O and NH3 emissions from solid manure heaps [Chadwick et al., 2011].
ii. Methane (CH4)
Its lifetime in the atmosphere is 12 years and its GWP is 23 times higher than CO2 (100 years
time horizon) [IPCC b, 2001]. CH4 comes from landfills, natural gas and petroleum systems, coal
mining, agriculture, combustion, wastewater treatment, and industrial processes [USEPA a, 2006]. The livestock sector emits 37% of the world anthropogenic CH4 [FAO, 2006]. 10% of the digestible
feed intake or 5.5% of the gross energy intake will become CH4 for ruminants. For pigs and poultry it
is far less than that (0.6% of gross energy for sows [Jorgensen et al., 2011]). The type of feed, the production level (beef cattle versus dairy cows) and the age (calves versus dairy cows) have a great impact on CH4 emission levels [Monteny et al., 2001].
o Enteric CH4
The enteric fermentation occurs in the stomach/rumen of the ruminants (major emitters) and in the colon of the pigs (less CH4 produced because the capacity for this production is lower) where
5
source of CH4 in dairies (80%) whereas fermentation of manure is the most important source of CH4
for pig and poultry farms (70%) [Monteny et al., 2006]. If the increase of CH4 is proportional to the
increase in livestock number, then the CH4 production from livestock should increase by 60% in
2030, but changes in the feed and manure management could improve the situation [IPCC, 2007]. Concerning beef cattle, non lactating cows like heifers produce less CH4 per day than steers because
the latter have higher daily feed intake. But their higher growth rate leads to 20% less CH4 produced
during the whole production period. The cattle on pasture can emit more CH4 if the grass quality is
poor and if their level of performance is low [Clemens et al., 2001]. The fermentation occurs in two steps: the fast growth of acidogenic bacteria (optimum at 30°C), which produces organic acids, H and CO2, and the specific methanogenic bacteria work, which produces CH4 from organic acids
[Monteny et al., 2006]. Enteric fermentation is responsible for 80% of the CH4 emission from cattle
houses and 35% (mainly from indoor) for pig’s houses in the Netherland (72%, 23%, 1,3% of the CH4 emissions from enteric fermentation came from beef cattle, dairy cattle, and swine respectively
in the USA in 2000 [USEPA, 2012]). [Monteny et al., 2001] o Manure CH4
Manure stores are also a major source of CH4. If manure is stored or treated in anaerobic
conditions (e.g. as liquid or slurry in lagoons or tanks), its decomposition will produce CH4.
Preventing anaerobic conditions could therefore decrease CH4 production. As mentioned, if manure
is solid or deposited on pasture for example, there will be an aerobic decomposition and little CH4
production. Liquid system use is higher in dairy and swine farms in industrialized countries and in newly industrializing countries in Asia and Latin America [USEPA a, 2006].
CH4 flux is positively correlated with slurry temperature, and it tends to increase above 15°C
[Chadwick et al., 2011]. This CH4 source is influenced by the composition of the manure which
depends on the animal type and diet. If the feed contains a lot of energy, there will be more CH4
produced. But some higher-energy feeds are more digestible than lower energy feeds, so less waste will be excreted from the animal [USEPA a, 2006]. A lot of studies have been done to determine the factors that affect CH4 production, which is influenced by management and environmental factors
like the temperature, the biomass composition, the manure management, the duration of the indoor or outdoor storage, the percentage of volatile solids, pH, water content, or the substrate availability [Chadwick et al., 2011]. This production depends also on the rate of organic matter fermentation, the type of volatile fatty acids produced (if their production increases and if pH decreases, there will be more production of propionate which is an alternative to the production of CH4), and the efficiency
of microbial biosynthesis. As CH4 is not soluble, it will easily volatilize [Monteny et al., 2006]. CH4
comes also from the anaerobic digestion of slurry stored indoor and outside, and more specifically from the hydrolysis of hemicelluloses. Temperature and storage are the most important parameters that determine the amount of CH4 produced [Monteny et al., 2001].
Diet and animal type (age and the weight) have an impact on CH4 emissions [Monteny et al.,
2001]. CH4 production will increase if the organic matter content in the excreta increases. So cattle
slurry produces less CH4 than pig slurry, which produces less CH4 than poultry manure, but more
6
CH4 is an energy source. The prevention or the capture and then the use of CH4 emissions can
provide energy, economic and environment benefits (see part I.B.c.). A study on air bubbles in glaciers shows that there are more CH4 now than at any time during the past 400 000 years [USEPA
a, 2006]. Since 1750, CH4 concentration in the atmosphere increased by 150% up to 1745 ppbv in
1998 [IPCC a, 2001], but it is slowing nowadays (with a rate of 20, 9-13, and 0-13 ppbv per year in the late 1970s, 1980s, and 1990s respectively), up to 1751 ppbv in 2002. [USEPA a, 2006]
CH4 is removed from the atmosphere by sinks. The main one is the oxidation with hydroxide
radicals OH (CH4+OH=CH3+H2O) in the troposphere. The same process happens in the stratosphere
but with less amount of CH4 destroyed. Troposphere and stratosphere reactions represent 90% of the
CH4 removal. The other sinks are the microbial uptake of CH4 in soils (7% of the CH4 removal) and
the reaction of CH4 with chlorine atoms in the marine boundary layer (<2% of the CH4 removal) [USEPA a, 2006]. The most effective way to reduce CH4 emissions during outside storage could be
to reduce organic matter content of slurry with a biogas digester (emissions 30 to 66% lower). [Chadwick et al., 2011]
iii. Ammonia (NH3)
This gas is not considered as a direct GHG, however, it is a precursor to N2O (direct active
GHG) and NO [Clemens et al., 2001]. 65% of all NH3 emissions from terrestrial systems come from
animal farming systems [National Research Council, 2002]. NH3 comes from the anaerobic digestion
of food proteins. In the cow’s rumen, the microbes use NH3 to create proteins. But sometimes, too
much NH3 can be found in the rumen, so it goes into the blood and is excreted with the urine in the
urea form. When NH3 is in the atmosphere, a part of this gas comes back to the ground, which can
create environmental problems such as the acidification or changes of the ground structure, and the other part remains in the atmosphere and reacts with some atmospheric acids to create aerosols, which can be a problem for air quality and for animal’s and human’s health. [McGinn et al., 2007]
b. Livestock GHGs emission trends
The livestock sector has grown fast in recent decades as population growth and increases in per capita incomes have increased demand for livestock products, particularly in developing countries. New technologies, including genetic selection, shift from grazing to feedlot systems, reproductive technologies, increased livestock production in response to the increase in demand. Thus, meat and milk production are projected to double between 2001 and 2050 [FAO, 2006], and this demand could be met especially through an increase in animal numbers in developing countries [Rosegrant et al., 2008]. This increase in livestock number will lead to more GHGs emissions (20% more enteric and manure CH4 emissions from 2005 to 2020 particularly from China, Latin America, Africa, South
Asia, South East Asia…) [USEPA b, 2006]. The amount of emissions depends also on the animal type: beef production emits 13 times more (by output weight) than chicken meat production (because it is less intensive and they have a better feed conversion efficiency), on the regions (beef meat production in Argentina leads to much higher emissions than in the US or in South Korea), and on the production type (meat emits more than milk for example because dairy farms are more efficient at converting feed into food for consumption). Thus, agriculture and livestock contribute to climate change, which has bad impacts on agriculture and grazing livestock systems especially (increases temperature, changes in rainfall, extreme weather) [Henderson et al. 2011]. Non grazing livestock,
7
which stay inside buildings, can better control production conditions [FAO, 2009]. Finally, 70% of the mitigation potential is in the developing countries [McKinsey & Company, 2009], where appropriate policies (climate or non-climate one) will have to be created to reduce the emissions. [Henderson et al., 2011]
c. Legislation for GHGs emissions
CH4 and N2O production are regulated by the Kyoto protocol (1997) under the United Nations
Framework Convention on Climate Change (UNFCCC). The countries do not have the same emission targets. For example, the USA’s target would have been -7% between 2008 and 2012 if they had ratified the protocol [UNFCCC a, no date]. To reach this aim, the countries can create national measures or use three mechanisms: the carbon market (emission trading), the Clean Development Mechanism (CDM, see below) or the Joint implementation (a country from the Annex B of the protocol, see Appendix III, can earn emission reduction credits from a project in another Annex B country). National or international strategies exist to reduce the GHGs directly or indirectly, e.g. In the case of the Nitrates Directive for the protection of the water against NO3- that comes from
agriculture and that could be used for denitrification and produce N2O. The Gothenburg Protocol
(1999) to Abate Acidification, Eutrophication and Ground-level Ozone is included in the Convention on Long-range Transboundary Air Pollution (CLRTAP) and provides abatement options and economic instruments to reduce NH3 emissions from agriculture. [Chadwick et al., 2011] [UNECE
no date]
30 to 50% of the total N2O emissions from agriculture could come from wastes from animal
production systems [Oenema et al., 2005]. The assessment of the percentage of manure N2O
emissions includes manure spreading, manure management in animal housing and stores, and excludes emissions from urine and feces from grazing livestock. This percentage varies from country to country, for example, in the UK and Japan, manure contributes to 16% and 50% of agricultural emissions in 2007 respectively; this difference comes from different use of fertilizer, crop, livestock, or management. Globally, 12 to 41% of the agricultural CH4 emissions come from manure.
Differences in these emissions among countries come from the duration of manure storage, the proportion of ruminant livestock and the extent of rice production and biomass burning [Chadwick et
al., 2011]. So, each country needs legislations adapted to their amount of emissions to respect their
Kyoto protocol commitments. The manure management legislation in the Netherlands in 2008 forbids to discharge livestock effluent to surface waters (collection and storage of feces and urine) and to apply slurry in the season without plant growth or when the soil is frozen (need storage). The establishment of new livestock farms, the expansion of existing farms in areas with a high livestock density and the application rate of N are restricted [Van der Meer, 2008].
In developing countries the CDM projects are important. It enables some projects, whose aim is to reduce emissions, to earn Certified Emission Reduction (CER) credits and to sell them to developed countries. These countries will then use these credits to meet their emission targets under the Kyoto Protocol. Thus, this mechanism can benefit both developing and developed countries. It allows developing countries to develop new technologies and achieve sustainable development while decreasing their own GHGs emissions, and provides developed countries with more flexibility to meet their commitments under the Kyoto Protocol. A lot of CDM projects exist in China (49.73%), India (19.47%), Latin America or Brazil. On August, 14th 2012, 4464 projects were registered, whose
8
163 in agriculture (36.2% large scale, 63.8% small scale) [UNFCCC b, no date]. Some countries such as China have introduced many laws and programs under some UN conventions, which can also achieve mitigation benefits related to land use. For example, under the UN Convention on Biodiversity, China created a program to restore croplands close to lakes, sea, or other natural lands as conservation zones for wildlife (this could increase soil carbon sequestration but also CH4
emissions) [IPCC, 2007].
In many regions, non-climate policies related to macro-economics, agriculture and environment have a higher impact on agriculture pollution mitigation than climate policies. Even if agriculture has good technical potential for mitigation, only little progress has been made to apply these mitigation options because of barriers that cannot be easily overcome [IPCC, 2007].
B. Mitigation options
Many options exist to reduce the GHGs emissions, some of them focus on one GHG, others are efficient only in laboratory experiments, and some are widely studied and discussed in the literature. According to the evidence found in studies about the effectiveness of these mitigation practices, some options will be selected to be compared. While there are some effective measures which reduce the emissions only indirectly, e.g. genetic selection for more efficient animals, these measures are not taken into account, but if they did, they could increase the abatement potential by 2/3 [Moran et al., 2008]. Enteric options will be presented here but not taken into account in the rest of the study.
a. Interaction between mitigation options and GHGs emissions
i. Summary of possible options
Some reviews have been done for GHGs mitigation options. Clemens’s study (2001) sets apart the preventive measures, which reduce C and N input or output related to animal husbandry (the best one, according to criteria such as the emission reduction potential, the efficiency of N conversion, or the effect on yield, is animals with a high productivity fed with an optimized diet to reduce CH4
production), and “end of pipe” measures, which reduces GHGs production from C and N in the system of animal husbandry (the best one is the anaerobic digestion of the manure).
9
o Measures to reduce enteric emissions (table 1)
Mitigation options Comments
Preventive measures for ruminants
Optimizing the diet (more concentrates, less forages, or improve forage quality)
Can reduce the CH4 emissions especially in
developing countries (for example, less crude fiber) High performance animals, herd management CH4 decreases when the product unit increases (for
example, lower emission/unit of milk produced)
Anabolic steroids 5-10% reduction of the GHGs emissions
Hormone treatment Increases milk production by 10-20% and reduces animal stock reduction of 9% of the CH4
emissions in the USA Increasing the reproductive performance,
selecting the individuals for the reproduction
Decrease of the GHGs emissions Change bacterial flora of the ruminant stomach
End of pipe measures No technology available
Table 1: Enteric emissions mitigation options [Clemens et al., 2001]
The anabolic steroid and hormone treatment options can be effective, but they are forbidden in some countries such as Germany, Canada, EU because some residues remain in the final product. As non-ruminants do not emit a lot of enteric emissions, these mitigation options are not relevant for them.
For ruminants, the most effective CH4 mitigation dietary measures could be the increase of the
level of starch or soluble carbohydrate to increase the production of propionate instead of CH4, the
change of the diet (less fiber) to increase the productivity, or the decrease of methanogens. But only the two first solutions are feasible because the third option would lead to the addition of probiotics for example and many consumers are against this. The change of the diet could decrease enteric CH4
emissions but also change the composition of the manure and thus the greenhouse gases production from this source [Monteny et al., 2006]. Moreover, the use of additives has an effect on rumen microflora population, which could change the fermentation and lead to lower emissions (but some additives, considered as medicines are not allowed in some countries including those in the EU).
So, it appears that among these different options, the change in the diet2, the selection of the animals and genetics (better breeding, feeding methods and husbandry can lead to 10-14% less CH4
emissions from dairy in Germany (30% less CH4 emissions over the last 40 years in this country)
[Clemens et al., 2001]) are efficient and feasible options to reduce the enteric emissions.
2 especially in developing countries because in developed countries the diet is already optimized, which can lead to
20% less CH4 emissions per cow per day but 21% more CH4 emissions from the total herd if an intensive production
system becomes an extensive one with more cows and a restricted diet [Monteny et al., 2006], 20-30% less ammonia emissions according to Powell et al. 2008, less N excretion, and other potential benefits according to Chadwick et al. (2011) and Oenema et al. (2005)
10
o Measures to reduce manure GHGs emissions (table 2)
Mitigation options Comments
Preventive measures
Reduction of the N output of the excreta By reducing the animal number for example Optimizing the diet of the animals Improve the digestibility which could decrease CH4
emissions Influencing and controlling microbial processes in
the excreta
For the non grazing systems so that the excreta can be collected, the grazing systems are uncontrolled Adding straw to solid manure Will reduce NH3 emissions but could increase N2O
emissions; mixing 50% straw with cattle manure at the beginning of the storage reduced CH4 and N20
emissions by 45% and 32% [Chadwick, 2011]
Compact farmyard manure Will reduce NH3 but increase CH4
Quickly remove the excreta into biogas plant while using a storage in a closed system
Will reduce CH4 and N2O emissions (10%)
[Monteny et al., 2001]; in pig houses, emissions can be 40% lower than in houses where channels are not cleared frequently. [Haeussermann, 2006]
Outdoor slurry treatment (combination of aerobic (nitrification) and anaerobic (denitrification) treatment) (example of the Netherland’s veal calf)
Could lead to an ammonia free slurry. Between 10 and 20% of the slurry N can be lost as N2O from
aerobic slurry treatment. [Monteny et al., 2001] Adding lactic acid until pH 4.5 90% less NH3 and CH4, decrease of N2O emissions
[Monteny et al., 2001]
Total solid content: at least 18% (more aeration) Decreases CH4 and N2O emissions [Monteny, 2001]
End of pipe measures
Anaerobic digesters Improve energy efficiency, can reduce 85% of CH4
Housing system and manure storage
Hot fermentation Could remove 60% of the N in the liquid manure (reduction of the CH4)
A cover placed on the excreta surface or a biofilter For nitrification of the NH3 (but NO2 emissions
would increase) Adding gypsum (CaSO4) to pig slurry (experiment
in Germany [Berg et al., 2008])
CH4 flux decrease linearly with the quantity of
added gypsum, no NO2 emission detected
Field application
Influencing the balance NH3-NH4 +
(acidification, addition of CaSO4 to modify the pH)
No or a few CH4 is emitted after land application of
the excreta; a solution with a low pH no NH3
emissions
Incorporation of slurry Reduce NH3 but increase N2O emissions
After slurry application 40% of the NH4
+
applied with liquid manure reaches the soil microorganisms and is available for the plants (the rest volatilized as NH3). These 40%
are a potential source of N2O. The injection of
liquid manure avoids the NH3 volatilization and
about 90% of the NH4 +
could be available for the soil microorganisms
11
As shown in table 2, there are many mitigation options for manure. For the preventive measures, optimizing the diet for cows while decreasing the crude content and the use of proteins with low degradability in the rumen could decrease the N excretion. For sows and fattening pigs, improving the amino acid content of the diet could also decrease this N excretion (the change in the feeding method could lead to 12% less N excretion [Clemens et al., 2001]). Moreover, composting can lead to lower inorganic nitrogen (available for the plants), lower total carbon concentration, higher dry matter, higher total mass losses (water + dry matter), higher losses of C and N but it allows the transport of up to twice more phosphorus than fresh or stockpiled manure [Larney et al., 2006].
For the “end of pipe” measures, cooling the manure (<10°C), (21% less CH4 emissions for pig
slurry in-house), reducing the pH (with lactic acid), removing manure from indoor storage pits (if a sufficient outdoor storage capacity and other measures to prevent outdoor CH4 emissions are
available), and a better management of the bedding (minimize compaction, add litter, remove regularly) are other CH4 mitigation options. Nitrification inhibitors can be used to decrease N2O
emissions, the control of nitrification/denitrification is important to have a greater flux of N2 instead
of N2O (the factors controlling N2O/N2 ratio are not perfectly well-known). The interaction between
manure and fertilizer nitrate is important for N2O emissions especially in the Nitrate Vulnerable
Zones3.
Anaerobic digestion (which will be detailed below) will first decrease the amount of CH4 emitted
but could also increase the amount of NH3 available for the plants, have an impact on the quantity of
C (the anaerobic digester will use more C for the biomass or for CH4 production, less C in the slurry
will be available for the denitrification), and will reduce the N2O emissions after land spreading
[Monteny et al., 2006]. We can deal with the climate change problem while using CH4 for energy
production (reduce the emissions of CH4 and CO2 from fossil fuels). Finally, the use of anaerobic
digestion and electrochemical oxidation has been tested for dairy manure in Japan by Ihara et al. (2008). Indeed, anaerobic digestion can recover biomass energy and treat animal waste for C recycling but it does not allow much denitrification. Hence the need for electrochemical oxidation of the NH3 produced, which requires electricity. This study evaluates the feasibility of using electricity
created by a biogas plant for the electrochemical oxidation of ammonium nitrogen in anaerobically digested effluent. The author found that 24 to 33% of the electricity required for the electrochemical oxidation can be supplied by the biogas plant, which is not very efficient. But electrochemical oxidation of digested effluent from a biogas plant for dairy manure is a good option for the treatment of NH4-N. This oxidation and the use of NaCl decrease NH4-N and COD (by 28.9% for COD and
almost 100% for NH3 after 5h). Indeed, during the indirect oxidation, the electrochemically
generated oxidants destroy the pollutants and decrease NH4-N in the solution. During the direct
oxidation, the organic matter is destroyed on the oxide anode by electrochemical conversion or combustion. Indirect oxidation is dominant during electrochemical oxidation of the digested effluent [Ihara et al., 2008].
3 Area of land that have or could have an excess of nitrate (more than the limit 50 mg NO
3/L) and where farmers
have to take measures to decrease the NO3 concentration (less fertilizer use or use it with a better timing, better
12
o Packages of options and interactions between measures
Finally, the use of several mitigation options is feasible. For example in the UK, the use of ionophore, improved genetics and productivity for beef and dairy, and anaerobic digesters for beef, dairy, poultry and pigs could lead to the reduction of 5% of the emissions [Moran et al., 2008]. Moreover, there could be some interactions between enteric and manure emissions. Indeed, the adoption of one option to reduce emissions from one source could also have an effect on other emission sources. The typical example is the change in the diet, which could lead to less enteric emissions but will also change the composition of the manure and thus, could decrease the emissions from this source.
Some options can decrease GHGs but others, in some conditions, can increase them or decrease one of them and increase the others. A study done by De Klein about the N2O mitigation options in
2008 concludes that nitrification inhibitors, managing animal diets and fertilizer management had the best potential for reducing emissions in the short-term. But some practices could increase CH4
emissions (practices that increase the efficiency of N in the soil-plant system), so all GHGs need to be taken into account to be sure that the mitigation of one GHG will not lead to the increase of another one. Schils et al. (2006) showed that the reduction of N fertilizer used and grazing times could lead to the mitigation of 50% of the N2O emissions in Dutch dairy farms, but only 26% of the
total GHGs emissions will be reduced. Indeed, for example, if N2O emissions decrease but CO2 or
CH4 emissions increase, then total GHGs emissions could increase [De Klein et al., 2008].
Dinuccio (2008) made a study about the treatment of the slurry by solid-liquid separation, which creates a nutrient rich solid fraction that can be transported at lower costs to deficit areas. GHGs emissions have been measured during the storage of pig slurry such as the solid and liquid fractions obtained by mechanical separation in laboratory. The study found 7.8% solid and 92.2% liquid produced after the separation. It also shows that this separation, for the solid phase, increases the pH, doubles the total nitrogen, decreases the total ammonia-nitrogen, and leads to higher volatile solids in total solids whereas it is the contrary for the liquid phase. The main GHG emitted from liquid manure (and also for rough slurry) is CH4 (and then CO2, and NH3). N2O emissions are low during slurry
storage (anaerobic conditions). The main GHG emitted from solid fraction is N2O (and then CO2 and
CH4) because solid fraction produces a fibrous product, so the air goes into the upper part of the solid
fraction samples, where nitrification and denitrification occur. NH3 and CH4 emissions are low. So, if
we combine solid and liquid, N2O emissions increase, CH4 and CO2 emissions increase by 3% and
10% respectively, NH3 emissions decrease. In general, GHGs emissions increase by 25%. So, solid
liquid separation is not a good option for the environment due to high emissions of CH4 from the
liquid fraction and high emissions of N2O from the solid fraction [Dinuccio et al., 2008]. But this
study has been done from manure of one farm in Europe, so the results are specific to this area. Different results may be found in other agro-climatic conditions.
However, only a few adverse effects have been found for anaerobic digesters. For example, their use could decrease the carbon supply in the soil, which could decrease the organic matter supply, and thus have an effect on the mineral transfer in the soil. Their use could also lead to some issues about the cultivated land for food or energy purposes.
13
Thus, among these options, the ones that lead to a decrease of one GHG but an increase of another one may not be considered as efficient measures: literature about adding straw leads to different results, in some condition (little amount of straw and litter used which will create wet and dense areas like anaerobic ones), N2O emissions could increase; the compaction of farmyard manure;
slurry incorporation. Moreover, lactic acid is considered as a biochemical pesticide which is strictly regulated and can face consumer opposition and the addition of gypsum has been tested only during an experiment. So these options cannot be considered as feasible either. The efficiency of changing the diet explained before is valid for enteric and manure emissions. The reduction of the animal number is feasible only if their performance and productivity increase. Finally, removing excreta in a biogas plant, treating the slurry and using a cover are options used within the anaerobic digester technology. This method is very detailed in the literature and is well developed in the developing and developed countries (USA, Germany, Vietnam…). Its efficiency can be up to 85% less GHG (CH4)
in the USA for example and the digesters, according to their type and localization, can be quite cost-effective. According to these criteria (environmental, studies and international discussions about this option), the anaerobic digestion, while using a digester, can be one of the best options to reduce the GHGs from manure.
ii. Co-benefits from GHGs manure mitigation options
Land application of livestock manure increases soil OM, C content, soil structure and aeration, water-holding capacity and cation exchange capacity. Thus a good use of manure can improve soil quality and yields. [Van der Meer, 2008]. Increasing on-farm N-use will slow down nitrate loading and eutrophication of surface and coastal water. The use of N more efficiently will decrease the need of fertilizer, and so the quantity of CO2 emission (because CO2 is created while producing these
fertilizers). Some practices to reduce CH4 emissions can also improve crop and animal productivity
(like changing the diet or improving the animal breeding). Moreover, the use of CH4 for energy could
lead to less expenditure on energy and so could decrease CO2 emissions. Increasing soil organic
matter levels can lead to improved fertility and soil sustainability (better water storage capacity, increased water infiltration, reduced erosion, increased soil buffering capacity and storage of essential plant nutrients) [Paustian et al., 2004]. Composting can lead to less haulage requirement and can remove viable weed seeds, bacteria and human parasites [Lamey, 2006]. It can also reduce the manure volume and weight. Finally, manure is a good product for agriculture. It contains N, P, K, nutrients, improves infiltration and aggregation, decreases the energy needed for tillage. Organic carbon and mineralizable N in manure-amended surface soils are 22 to 40% greater than in non-manure amended soils receiving fertilizer and/or herbicide. The conservation of N could reduce the cost of crop production, so manure has economic and energy efficiency potential. But the use of excess manure could have adverse effects: soil and water pollution, acidification, less water infiltration, which has an impact on soil-exchangeable K and P. The fast removal of the manure from feedlots can reduce the nitrate movement into the soil, maintain aerobic conditions and decrease odor [Eghball et al., 1994]. According to these environmental or social benefits, emissions mitigation from manure is an important issue. This is why we will focus on this source.
14
iii. Comparison example of different methods to reduce manure GHGs
A study has been done by Kaku in Thailand in 2008 about the comparison between GHGs emissions with and without mitigation options for broiler manure in the context of a small-scale CDM, which can be used to have credit in the ASEAN and Japanese livestock industries. This study estimates GHGs emissions from three different waste management systems in the broiler industry in Thailand in an international market (mainly for the Japanese customers): incineration, drying without energy input (with sunlight), drying with energy input (thermal energy). The CH4 emissions for one
management of broiler excretion are obtained by multiplying the emission factor for a treatment with the amount of organic matter in broiler manure. CH4 and N2O emission factors for sunlight drying
are 0.20%, CH4 and N2O emission factors for thermal drying are 0% and 2%, CH4 and N2O emission
factors for incineration are 0.40% and 0.1% respectively. From 1994 to 2003, the GHGs emissions increased of 26% because broiler and pork were the favorite meat in Thailand and decreased of 37% in 2004 (baselines) because of the influenza (less production). If we use energy, GHGs emissions will be reduced by 57% and incineration will increase GHGs emissions by 17% if we compare to the no mitigation option scenario (see Appendix IV) [Kaku et al., 2008].
Hishinuma in 2008 compares different methods of mitigation (composting and biogas plants) in Japan, where GHGs emissions from manure treatment and application represented 26.3% of the agricultural GHGs emissions. Three cases are observed for 100 cows: composting at a compost depot and then application (case 1), solid and liquid composting and then application (case 2), biogas plant for slurry treatment and then application (case 3). Efficiency of NH3 reduction and fuel consumption
for splash plate (spreading slurry to the air), band spread (spilling to surface through hoses) and shallow injection (SI) into the soil have been compared, and CO2, CH4, N2O, NO, SO, NH3 are also
taken into consideration for each process. No emissions related to the energy in the case 3 are observed because a co-generator is used instead of electricity or fuel. The lowest NH3 emissions are
for case 3 but it requests fuel for the manure application. GHGs emissions are the highest in case 2 and the lowest for case 3 (because of lower emissions during manure treatment and higher N2O
emissions from composting). Thus biogas plant is the best option. Acidification gases emissions from manure treatment were divided by 2 for case 3 compared with other cases. However, NH3 emissions
from digested slurry application were relatively high. Biogas plant with digested slurry application and with SI seems to be the best option according to this study. [Hishinuma et al., 2008]
b. Choice of the studied technologies to reduce manure GHGs
According to what we said before, manure appears to be an important GHGs source and many mitigation options exist to reduce the amount of the gases emitted. The benefits from manure mitigation options are numerous (environmental or economic).
Especially, it appears that among all the mitigation options that exist in the literature, anaerobic digesters, especially the largest ones, seem to be one of the best technologies to reduce GHGs emissions from manure: in 2005, 39% of the agricultural non-CO2 emissions came from livestock,
whose 7% from manure (the digester could help to decrease this percentage) [IPCC, 2007], many studies about this, a lot of environmental, agricultural and social benefits, high effectiveness to reduce GHGs, no important adverse effects, can be cost-effective (see below)... Thus this study will focus on the comparison and cost-effectiveness analysis of several anaerobic digesters to reduce the GHGs emissions, especially CH4 emissions, from manure.
15
c. Anaerobic digestion
i. Background
Anaerobic digesters are used to treat biodegradable organic matter, such as manure, by the use of bacteria which will create CH4 biogas. The aim of this option is to recover the CH4 before its
emission in the air, and use it for electricity, offsetting purchases electricity, heat, offsetting purchases of propane or natural gas, or hot water production, to reduce household and farm operating costs [USEPA, 1999].
Anaerobic digestion takes place in six steps (see Appendix V):
- Hydrolysis of solid organic particles or high molecular weight compounds (which are too large to permeate the cell membrane). It is catalyzed by extracellular enzymes released by fermentative and/or acid forming bacteria.
- The carbohydrate and protein hydrolysis will create sugars, lipids and amino acids, and they will become volatile fatty acids (VFA), H2 and CO2 by fermentative bacteria.
- H2 producing acetogens oxidize VFA and long chain fatty acids into acetic acid, H2 and CO2.
These bacteria work with methanogens which consume the H2 produced during oxidation.
- CO2 and H2 will be transformed into acetic acid by homoacetogenic bacteria.
- Acetic acid will be degraded into CH4 and CO2 by acetoclastic methanogens.
- H2 utilizing methanogens will reduce CO2 to CH4.
This process can be done at psychrophilic (10-25°C, but at a low biogas production), mesophilic (more common, 30-40°C) and thermophilic (50-60°C, the biogas production is faster but more difficult to manage) temperature with a batch reactor (5 operations: fill, react, settle, draw, idle), a sequencing batch reactor (for farm scale operations), and continuous flow reactors (plug flow reactor). [Massé et al., 2011]
An anaerobic digester can be fed with manure, water, plant matter, straw and other materials. Manure can bring fresh bacteria and stabilize the pH (usually at 7.5-8) and so the environment. The OM in liquid manure is lower than in solid manure. The plant matter such as crop, fruit or vegetable waste have a high CH4 production potential and can easily be assimilated by bacteria. A balanced
food ration (which depends on the fat and protein quantity, the C/N ratio or the NH3 concentration
for example) is essential for the well-running of the digester (otherwise, the biogas production will be lower and the digester could be damaged). [ADEME, 2011]
Such a system has 4 components: a manure collection system, the anaerobic digester (to stabilize manure and optimize the CH4 production), a biogas collection system (collected and piped to a
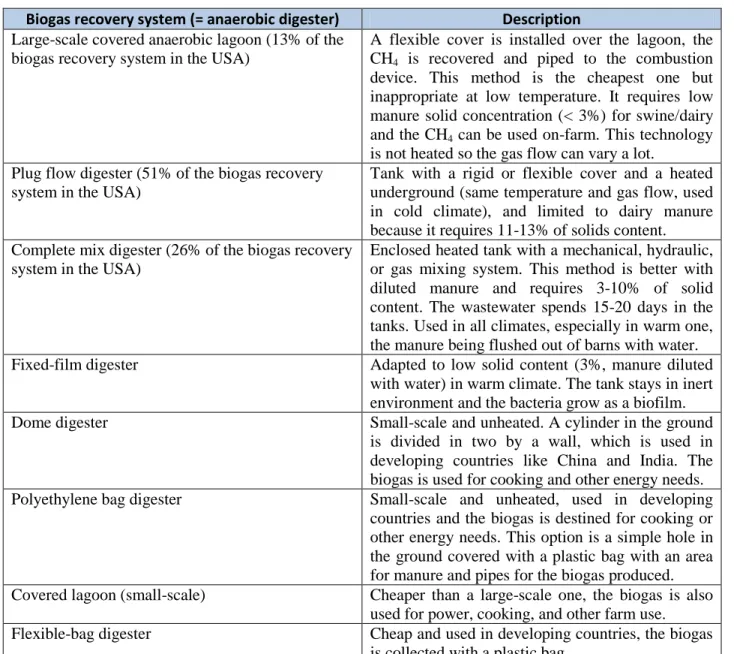
combustion device) and a gas use device (heat or electricity). [AgSTAR, no date] (see Appendix VI) There are 8 different kinds of biogas recovery systems (table 3):
16
Biogas recovery system (= anaerobic digester) Description Large-scale covered anaerobic lagoon (13% of the
biogas recovery system in the USA)
A flexible cover is installed over the lagoon, the CH4 is recovered and piped to the combustion
device. This method is the cheapest one but inappropriate at low temperature. It requires low manure solid concentration (< 3%) for swine/dairy and the CH4 can be used on-farm. This technology
is not heated so the gas flow can vary a lot. Plug flow digester (51% of the biogas recovery
system in the USA)
Tank with a rigid or flexible cover and a heated underground (same temperature and gas flow, used in cold climate), and limited to dairy manure because it requires 11-13% of solids content. Complete mix digester (26% of the biogas recovery
system in the USA)
Enclosed heated tank with a mechanical, hydraulic, or gas mixing system. This method is better with diluted manure and requires 3-10% of solid content. The wastewater spends 15-20 days in the tanks. Used in all climates, especially in warm one, the manure being flushed out of barns with water. Fixed-film digester Adapted to low solid content (3%, manure diluted
with water) in warm climate. The tank stays in inert environment and the bacteria grow as a biofilm.
Dome digester Small-scale and unheated. A cylinder in the ground
is divided in two by a wall, which is used in developing countries like China and India. The biogas is used for cooking and other energy needs. Polyethylene bag digester Small-scale and unheated, used in developing
countries and the biogas is destined for cooking or other energy needs. This option is a simple hole in the ground covered with a plastic bag with an area for manure and pipes for the biogas produced. Covered lagoon (small-scale) Cheaper than a large-scale one, the biogas is also
used for power, cooking, and other farm use. Flexible-bag digester Cheap and used in developing countries, the biogas
is collected with a plastic bag.
Table 3: The biogas recovery systems (or anaerobic digesters). Source: USEPA a 2006 and AgSTAR no date The four first options are applied only in the USA, EU-15, Japan, Australia and some other developed countries and also in Eastern Europe, Central and East Asia, China, and South Korea according to the climate, the environmental regulations or the costs. They are estimated to reduce CH4 emissions by 85% (maximum) compared to the baseline (when CH4 is released into the
atmosphere) as mentioned part I.B.a. [USEPA a, 2006]. Other studies find differences according to the animals: 62 and 70% less CH4 from dairy and hogs [Chadwick et al., 2011], or according to the
climate: 50% less GHGs from the farm-scale, centralized digesters in cool climate, 75% less GHGs in warm climate in Europe [Bates, 2001]. The four other options are applied in the other part of the world, in China and in some countries in East Asia, namely especially developing countries. They could reduce emissions by 50% (between 23 and 53% according to Hristov et al. (2012)). If an option has engines and equipment for electricity production, it will need twice as much labor than options which only produce heat. The animal production yields do not change with these options but other revenues could come from the use of CH4 for heat and electricity. [USEPA a, 2006]
17
ii. Efficiency of this mitigation option
o Environmental, agronomic and socio-economic benefits (figure 2)
Figure 2: Benefits of the anaerobic digestion. Sources: Massé et al. 2011 for environmental and agronomic benefit, ADEME 2011 for socio-economic benefits.
Anaerobic digestion can lead to many benefits (figure 2). The GHGs mitigation from manure storage can be realized provided that a bioreactor eliminates fugitive CH4 from the full bioreactor,
the retention time is enough to extract most of the energy from the organic substrates and, the long term storage tank receiving the bioreactor effluent has a gas tight cover to collect and recycle residual CH4. Moreover, the anaerobic digestion could be a potential solution for mortality disposal (reduces
the risk of farm contamination related to transport of infected livestock carcasses but this is not allowed in the USA, and Europe made strict rules following the BSE case). [Massé et al., 2011]
o AgSTAR guide
AgSTAR (see Appendix VII) developed a guide to find the place in the USA where the best opportunities are present to install and operate biogas recovery systems with dairy and swine manure. The profitable systems depends on the ability to recover the capital and costs at a good rate of return and generate a long-term income stream, which depends on the size of the operation (costs of construction and operation decrease when biogas system size increases and better financial returns can be made for a herd size over 500 cows or over 2000 heads in theory), the manure management method (liquid, slurry, semi-solid state, collection frequency), local energy costs (electricity price from the local electric utility), the carbon price, the baseline CH4 emissions and reductions from the
farms. This study concludes that for swine, 85% of the electricity generating potential is concentrated in 10 states, with North Carolina and Iowa (big pork producing states) each accounting for 20% of
![Table 1: Enteric emissions mitigation options [Clemens et al., 2001]](https://thumb-eu.123doks.com/thumbv2/123doknet/5841759.141600/18.918.99.817.107.444/table-enteric-emissions-mitigation-options-clemens-al.webp)
![Table 2: Manure emissions mitigation options [Clemens et al., 2001]](https://thumb-eu.123doks.com/thumbv2/123doknet/5841759.141600/19.918.107.833.101.1120/table-manure-emissions-mitigation-options-clemens-al.webp)

![Figure 3: Methods to assess the economic feasibility of a project [USEPA, 2004]](https://thumb-eu.123doks.com/thumbv2/123doknet/5841759.141600/30.918.154.767.615.844/figure-methods-assess-economic-feasibility-project-usepa.webp)