Bulk and grain strain measurements in sandstone by Image Analysis
Y. Vanbrabant*, V. Lebrun**, J.-F. Nivart**, D. Jongmans*, and E. Pirard**
*Laboratoires de Géologie de l’Ingénieur, d’Hydrogéologie et de Prospection Géophysique, Université de Liège, 17, Boulevard duRectorat, B-4000 Liège
[email protected] ; [email protected] Laboratoire MICA, Université de Liège, 45 Avenue des Tilleuls
B-4000 Liège
[email protected]; [email protected] ABSTRACT
Two techniques of strain measurement by image analysis (Enhanced Normalized Fry and intercept) are applied on Belgian sandstone and quartzite thin sections. Results are compared and discussed. Finally, the intercept method robustness is tested with different kinds of noise.
KEYWORDS
Strain measurements, Enhanced Normalised Fry, intercept, boundary recognition,
INTRODUCTION
Geodynamic models of tectonic structures development, for instance the fold-and-thrust belt formation, can be partly constrained by the quantitative analysis of finite strain in rocks. Therefore, structural geologists developed techniques allowing to determine the strain from individual deformed objects or from redistribution of locatable points (Ramsay & Huber 1983). These methods measure the changes of object shape and the bulk (or whole-rock) strain, respectively (Ramsay & Huber 1983, Erslev & Ge 1990).
The bulk strain methods, usually called centre to centre techniques, started by a « nearest neighbour » approach, where the distances between pairs of adjacent objects are plotted against the inclinations of the tie line. In 1979, Fry developed a graphical process, today called Fry method, that measures the finite strain from centres more or less equidistant. Such point distribution (anticlustered) can record a strain, whereas a random or Poisson set of points can not. Crespi (1986), quantifying the distribution degree, has shown that it is not possible to find the strain ellipse from a Fry diagram if the point distribution is not enough anticlustered. In two-dimensions, sandstones frequently present a low degree of anticlustering that could be explained by a poorly-sorting of grains during the sedimentation. Furthermore, even for aggregates with a perfect anticlustering degree in three-dimensions, any plane through this volume (e.g. a thin-section) will exhibit a low anticlustered degree. In this case indeed, most of the grains
are not cut through a plane including the grain centre, showing thus sections of different size (Erslev, 1988). The resulting Fry diagram is not interpretable. Erslev (1988) has solved the problem by normalising the distance between grain centres. This technique called Normalised Fry method, leads to the definition of an accurate bulk strain ellipse. Finally, considering only touching grains, Erslev & Ge (1990) proposed the Enhanced Normalised Fry method (ENFry) using a least-squared fitting of ellipses on grain boundaries and on Fry plot.
On the other hand, Launeau (1990) proposed a more automatic method of strain measurement in rocks. In this technique, a rose of the mean intercept lengths is computed on the image and the strain is directly measured from the rose. This approach allows to work without any condition on the initial state of the grains. The measurement do not require perfectly closed boundaries.
METHOD
Thin sections in sandstone and quartzite have been made in rock samples taken at Heer-Blaimont (Esneux Formation : Upper Famennian) and at Prayon (Acoz Formation : Lower Devonian), respectively. The principle of the method consists in acquiring X images of each thin section by a black and white CCD camera. The strain measurement is then achieved by both ENFry and intercept methods. The results are finally interpreted and compared.
PRINCIPLE OF IMAGE ACQUISITION
Contrast between quartz grains in quartzite and sandstone thin sections is due to the variable orientation of their optical axis (Fig.1a). In quite argilous sandstone, grains are separated by a thin matrix of clay minerals remaining dark under all orientations of the polarizers (Fig.2a) .
In order to extract the boundaries of the grains, it is thus important to grab a sequence of images at different orientations of the polarizers (Starkey and Samantaray, 1993). This rotation can be automated with a stepper motor (Fueten, 1997). For technical reasons, in this study, the sole analyzer has been rotated, causing a lack of information. A mechanical system is under construction that will allow simultaneous rotation of crossed nichols in both transmitted and reflected light modes.
The acquisition process is based on a continuous grabbing during rotation of the polarizer. Two resulting images are simultaneously updated after each frame acquisition. The first image contains the maximal grey level of each pixel obtained during the rotation (Fig.2b). The second presents the maximal value of the morphologic gradient (Fig.1b). Two successive median filters are applied on each grabbed image before computing the gradient. The two resulting images are then added and thresholded. On the final binary image, some boundaries remain incomplete. It is necessary to close them manually because the ENFry method for strain measurement are based on elliptic interpolation on complete edges (Erslev and Ge, 1990).
PREFERRED ORIENTATION ANALYSIS
After labelization of the final image, the following information is extracted: inertia parameters (Medalia, 1970) and intercept measurement.
For each grain, the position (xcg, ycg) of its center of gravity is
computed and used to construct simple Fry Plots (Fry, 1979). Inertia ellipses (orientation, position and axial ratio) are used instead of least-square ellipses to apply the Normalized Fry method (Erslev and Ge, 1990). These data are automatically computed on every individual grain and allow statistical analysis of grain deformation and orientation.
At the same time, intercept measurements are computed in 8 directions from 0 to 180 degrees. These are used to plot a rose of intercepts on which an ellipse is fitted by least-square adjustment (Launeau, 1990).
STRAIN MEASUREMENT
Both techniques have been used at first on a test image. In a second part, they have been applied to the strain measurements within two folds of two different lithologies.
Test image
Ramsay and Huber (1983, p.118) studied the bulk strain of a quartzite in thin-section using the nearest-neighbours technique. They found a axial ratio equal to 1.79 and an azimuth of 155°. Fig. 3 presents the plot of diagram and the results of the strain measurement computed on this image in the present study. The azimuth corresponds to the angle between the long axis of the fitted ellipse and the north axis of the diagram counted in clockwise.
Fold structures
The studied folds are small-scale anticlines, with an amplitude of few meters within two different lithologies. Both folds affect Devonian rocks, which have been deformed during the Variscan orogeny at the end of Westphalian (Upper Carboniferous). The first fold, situated in the Vesdre Massif (Prayon) in the northeast of Belgium, is a decollement anticline affecting quartzite of the Acoz Formation (Lower Devonian).
The second structure (Blaimont-Heer) is located in the southern part of the Dinant Synclinorium. The lithology (Esneux Formation : Famennian) is a fine-grained sandstone rich in phyllitic matrix. In the Prayon fold, five samples have been taken, while in the Blaimont-Heer anticline only 3 samples have been studied. On each sample, three thin-sections have been made in order to reconstruct a 3D-ellipsoid.
Fig.1 : a - Image of a quartzite in thin section b – Maximal gradient image
a b
Fig. 2: a - Image of a sandstone in thin section b - Maximal grey level image
-Axial ratio = 1.32 + 0.06 -Azimuth = 146.6° + 0.6° -Azimuth = 152° + 2° -Axial Ratio = 1.49 + 0.05
A
B
Fig. 3 : Strain measurement on Ramsay and Huber’s picture (1983, p.118) using the Enhanced Normalized Fry method (A) and the intercept method (B) where the rose of mean intercept lengths is plotted.
Analysis of the Prayon fold
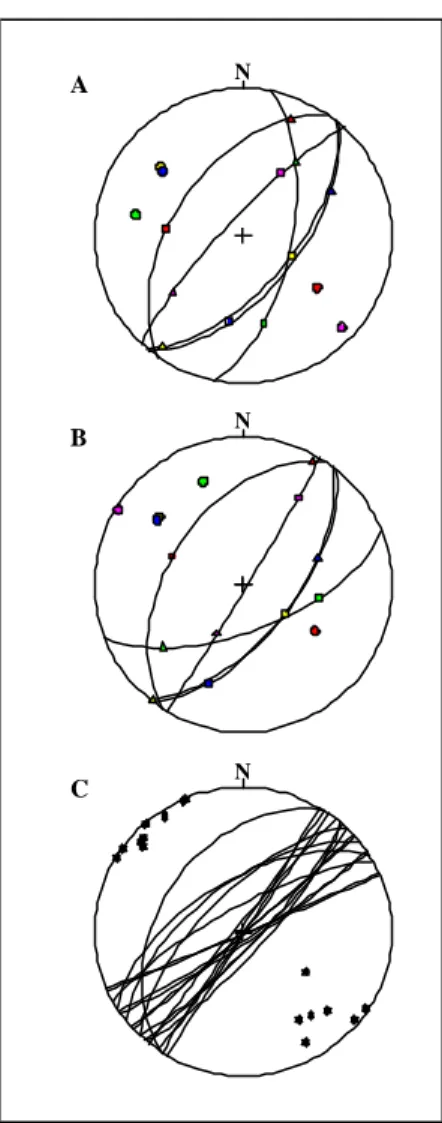
Two samples have been taken on both limbs of the fold and the fifth in the hinge. This decollement fold is oriented N45°E, facing southward. The cleavage direction in the surrounding siltite varies between N30°E and N60°E and the dip is roughly vertical to 60° northward. The XY-planes (flattening plane) deduced from the ENFry method (Fig.4A) and the intercept method (Fig.4B) agree with the surrounding cleavage (Fig.4C).
The axial ratios (R) calculated with the ENFry method vary between 1.02 and 1.35 with an average value for the 15 sections of 1.17, while the intercept method gives lower R values between 1.02 and 1.17 (average = 1.09). Sections which are perpendicular to the fold axis shows systematically higher value than other sections with different orientations. No clear evidence exists for a sharp axial ratio difference between the different parts of the fold, but more samples are needed to verify this result.
A
B
C N
N N
Fig. 4 : Stereographic projections of strain ellipsoid axis (symbols) and flattening planes (circles) using the Enhanced Normalised Fry method (A), the intercept method (B) for Prayon fold. (C) cleavage planes and the corresponding poles (star) in the surrounding siltite of the fold. Symbols : X = square, Y = triangle and Z= circle.
Analysis of the Blaimont-Heer fold
The studied anticline is oriented N80°E, facing southward in a rich-matrix sandstone. Two samples have been taken on both limbs of the fold and one in the hinge. The ENFry and intercept methods have shown that the axial ratios vary between 1.05 and 1.31 (average value = 1.20) and between 1.01 and 1.17 (average = 1.09), respectively.
Discussion
The axial ratios computed with the intercept method are systemically lower than with the ENFry method. The difference seems greater in matrix-rich sediments than in quartzite. This results come from the method principles: the ENFry method measures the deformation of the matrix added to the quartz-grains shape variation while the intercept method only considers the second one.
ROBUSTNESS OF INTERCEPT METHOD
intercepts may be computed on open grain boundaries. This is the main advantage of the intercept approach compared to center-to-center methods. It could indeed make useless the manual boundary closing and lead to an automatic image analysis. One condition has still to be checked: the strain measurement deduced from the intercept count on altered edges must remain stable when the proportion of lost contours remains low. The robustness of intercept counting when the efficiency of edge detection diminishes has been tested.
The image presented by Ramsay and Huber (1983, Fig. 7.16) was used as a reference in previous studies (Panozzo, 1987 ; Launeau and Robin, 1996) where axial ratio values between
1.27 and 1.38 and azimuth from 170° to 165° were obtained. In the present work, the sensitivity of intercept measurement to different kinds of noise (random, oriented and local) has been tested on the same image. Randomly deleting boundary points produces a random distributed noise. Oriented noise is created by subtracting from the test image a randomly traced set of parallel line segments (Fig.5). In practice, the edges between adjacent grains are either totally preserved or totally lost. In order to account for this observation, a so-called «local noise» is applied by randomly deleting edges between two triple points.
Table 1 : Influence of noise on axial ratio and pitch values
∆(ratio) ∆(Azim)
Random noise -10 % ± 2°
Noise parallel to strain axis -5 % ± 1° Noise perpendicular to strain axis -15 % ± 1°
Local noise ± 1 % ± 2°
Pitch and axial ratio of the strain ellipses have been computed with increasing noise density. Table 1 shows their relative variation after a 15 % loss of boundaries. One can see that the pitch measurement is very stable with respect to all kinds of noise. Axial ratio measurement seems more sensitive to random and oriented noise than to local noise. Finally, oriented noise appears to have a higher influence perpendicularly to the strain axis than in a parallel direction.
The ability of intercepts to be measured on open boundaries solves another drawback of center-to-center methods. Indeed, to fit ellipses on all grain edges makes it necessary to eliminate objects that are cut by the borders of the image (border-kill algorithm). This process eliminates a higher area in the direction of elongation causing a reduction of apparent strain (table 2, line3).
Table 2 : Influence of border kill and window shape R Azim. Boundaries, rect. window 1,4 167° Boundaries, circ. window 1,34 170° Grains with border-kill, rect. window 1,3 164°
Finally, the influence of the window shape has been examined. Classical rectangular images induce a bias in preferred orientation detection (Table 2, line 2). The use of circular windows must be recommended. But this circular selection dramatically reduces the number of entire grains for center-to-center techniques. The precision of final ellipse fitting can therefore be altered.
CONCLUSION
This study demonstrates the efficiency of intercept method to measure grain deformation, improving analysis time, while the ENFry remains necessary for bulk strain measurement. In the future, optimisation of the acquisition technique (Fueten, 1997) will decrease the grain boundaries closure work for ENFry and should allow to apply intercept method without any manual stage. A more accurate structural analysis will later be achieved with a wider sampling.
REFERENCES
CRESPI, J.M. 1986. Some guidelines for the practical application of Fry’s method of strain analysis. J. Struc. Geol., 8 (7), 799-808. ERSLEV, E.A. 1988. Normalised center-to-center strain analysis of packed aggregates. J. Struc. Geol. 10 (2), 201-209.
ERSLEV, E.A. & GE, H. 1990. Least-squares center-to-center and mean object ellipse fabric analysis. J. Struc. Geol. 12 (8), 1047-1059.
FRY, N. 1979. Random point distributions and strain measurement in rocks. Tectonophysics 60, 89-105.
FRY, N. 1999. Fry plots : warning about summed moments. J. Struc. Geol. 21, 129-134.
FUETEN, F. 1997. A computer-controlled rotating stage for the petrographic microscope. Computer and Geosciences. 23, 2, 203-208.
MEDALIA, A. I. 1970. Dynamic shape factors of particles. Powder Technology. Powder Technology, 4, 117-138
RAMSAY, J.G. & HUBER, M.I. 1983. The techniques of modern structural Geology - Volume 1 : Strain Analysis. Academic Press, London, 307 pp.
STARKEY, J. and SAMANTARAY, A.K. 1993. Edge detection in petrographic images. J. Microscopy. 172, 3, 263-266.
Fig. 5: Grain boundaries taken from Ramsay and Huber (1983 p.118) on which oriented noise has been applied by subtracting a randomly traced set of parallel line segments.